|
|
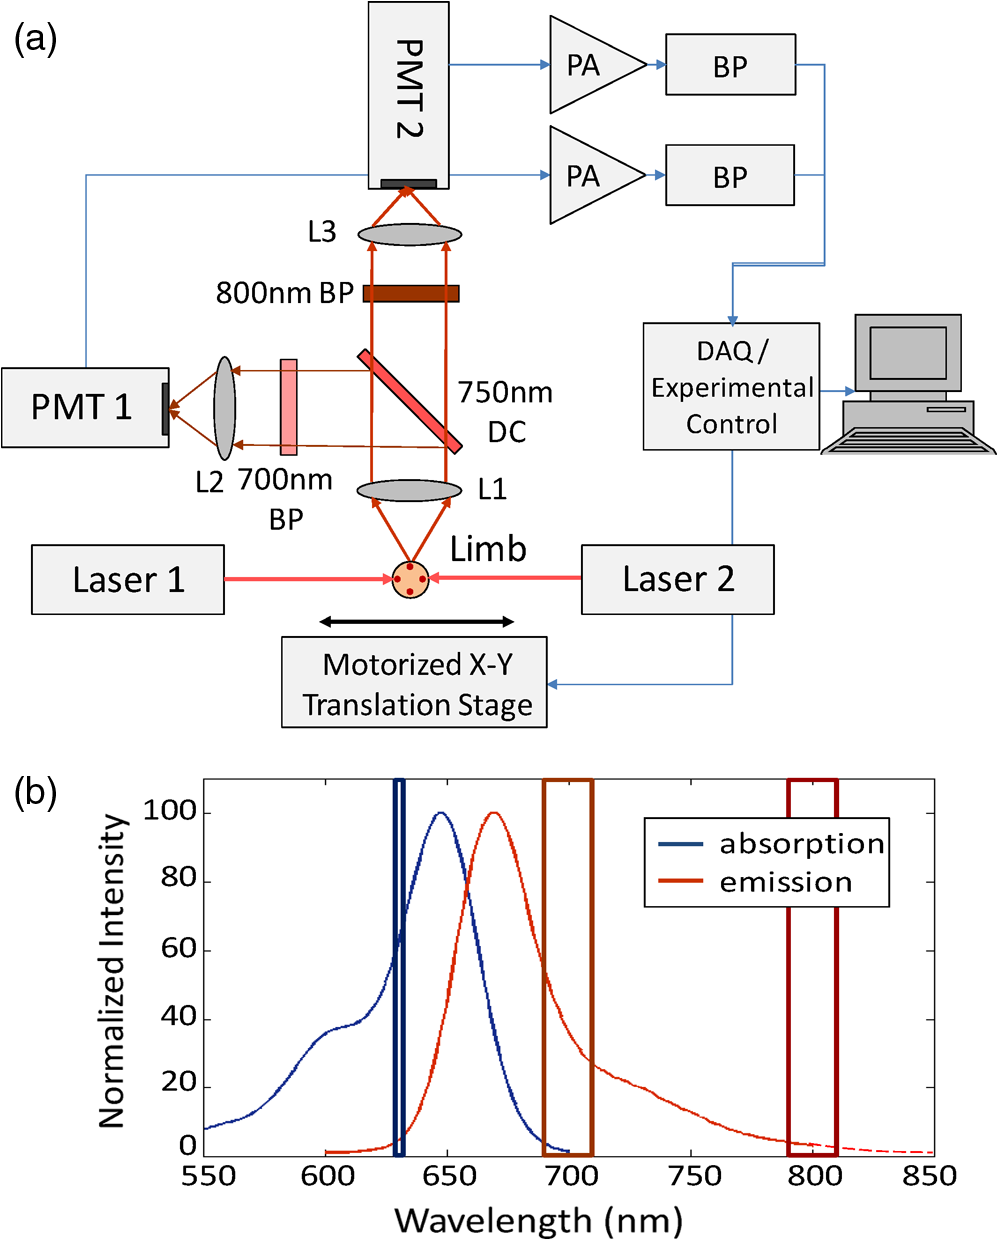
1.IntroductionQuantification of rare circulating cell populations in mice is important in many areas of preclinical biomedical research such as immunology, stem cell-based therapeutics, and the metastatic spread of cancer.1–4 Minimally invasive in vivo flow cytometry (IVFC) methods have recently garnered significant interest since they do not require drawing peripheral blood samples and therefore allow continuous enumeration of cells and quantification of circulation kinetics in vivo. Although fluorescence microscopy, two-photon microscopy, photoacoustic and photothermal sensing variations of IVFC have been reported in the literature,5–8 in general, existing techniques rely on interrogation of relatively small blood vessels with low blood flow rates on the order of to (although systems that rely on interrogation of larger blood vessels have also been reported).9 This sets a practical lower limit of sensitivity in the range of , which is often inadequate for applications where very rare circulating cell populations are of interest, for example, in the study of early-stage circulating tumor cells. As such, higher sensitivity IVFC instruments are needed. Motivated by this, we recently developed and reported a new method termed “diffuse fluorescence flow cytometry” (DFFC).10,11 The underlying principle was to utilize mesoscopic scale illumination and detection of fluorescent light from relatively large blood vessels in a limb (e.g., hindleg or tail),10,11 where blood flow rates are about 0.2 to .12 In principle, this enables sampling of the entire mouse blood volume in minutes. Our previously reported design10,11 used two sequentially illuminated lasers and an array of six detectors arranged in a ring around a mouse limb. As labeled cells passed through the DFFC field of view, transient fluorescence “spikes” were recorded on a multichannel photomultiplier tube (PMT). We showed that we could detect and coarsely tomographically localize circulating multiple myeloma (MM) cells in the tails of nude mice at injected concentrations of approximately . Although our previous work provided proof-of-principle demonstration of the approach, DFFC scanning of the mouse tail was not optimal because of its dense connective tissue and correspondingly high optical attenuation. Our data indicated that we could significantly improve DFFC detection sensitivity simply by interrogating the hindleg of a mouse since it is significantly less attenuating (we estimated by approximately a factor of 2). However, in practice, when we performed DFFC on the hindleg, we observed significant movement artifacts due to breathing and twitching, even in a properly anesthetized animal with a physically secured leg (versus the tail which could be more easily immobilized). These motion artifacts had similar amplitude and temporal characteristics as fluorescent spikes from cells. As such, they periodically obscured cell spikes or generated false-positive counts that could not be directly subtracted or filtered out in postprocessing. In this work, we developed a new multiwavelength DFFC prototype that, as we show, allowed efficient rejection of movement artifacts, thereby suppressing false-positive cell counts and allowing us to improve sensitivity by taking advantage of lower attenuation of the tissue in the mouse hindleg. As we describe in detail, we also improved our optical collection efficiency and instrument preamplifier performance. In combination, this allowed detection of individual circulating cells at injected concentrations of less than , with an overall estimated instrument sensitivity on the order of of circulating peripheral blood or better. This represents at least an order-of-magnitude improvement versus our previous work. In this paper, we demonstrate this first in limb-mimicking optical flow phantoms with fluorescent microspheres and then in detection and quantification of very low concentrations of circulating Vybrant DiD-labeled mesenchymal stem cells (MSCs) in nude mice. We anticipate that the high sensitivity of our DFFC instrument will have many potential applications in preclinical research where very rare circulating cell populations are of interest. 2.Methods2.1.DFFC InstrumentA schematic diagram of the dual-wavelength DFFC prototype is shown in Fig. 1(a). The hindleg of the mouse was illuminated with two 635 nm diode lasers (Coherent Inc, Santa Clara, CA), each with a 1-mm spot size and 5-mW intensity. Emitted fluorescent and autofluorescent light were collected with a 25-mm focal length plano-convex lens (Edmund Optics, Barrington, NJ) and then separated with a 750-nm dichroic beamsplitter (Edmund) into two detection arms fitted with either a 700- or 800-nm bandpass filter (20-nm bandpass, Chroma Technologies, Bellows Falls, VT) corresponding to “in-band” and “out-of-band” signals. After filtering, light was focused onto two single-anode PMTs (H5783-20, Hamamatsu Photonics, Bridgewater, NJ). As indicated in Fig. 1(b), the 800-nm filter also passed a small amount of the fluorescence tail of the Vybrant-DiD fluorophore (used in our in vivo experiments; see below) so that the ratio of DiD fluorescence in the 800-nm channel was about 7% of that in the 700 nm channel. The excitation laser and detection filter wavelengths were selected to work well with a number of other commonly used fluorophores including Alexafluor-680 and Cyanine5.5 as well as red-shifted fluorescent proteins (RFPs) including TurboRFP or mCherry.13 The output of each PMT was passed through a current preamplifier configured to operate with a 0.1 to 100 Hz spectral filter (SR570, Stanford Research Systems, Sunnyvale, CA) corresponding to the known frequency range of the fluorescent spikes established in our previous work.10,11 The gain of the preamplifier was configurable but was typically operated in the 60 to 80 dB range (higher gains were used for in vivo studies). Data was acquired and processed using custom-written MATLAB software (The Mathworks, Natick, MA) and a multipurpose data acquisition system (DAQ, USB-6212, National Instruments, Austin, TX). Sensitivity of the instrument was also improved by removal of the DC signal component at the preamplifier stage. In our previous work, we showed that the magnitude of the DC component of the detected signal was about 100 times larger than the detected fluorescent spikes in vivo (due to tissue and instrument autofluorescence). Therefore, removal of the DC component allowed us to apply high amplifier gain and increase the amplitude of the detected spikes without saturating the input of our DAQ. Finally, use of open optics, as opposed to fiber-optic light collection, allowed improvement in geometrical collection efficiency of our system. 2.2.Phantom MeasurementsAs an initial test of our prototype instrument and motion artifact removal algorithm, we used an optical flow phantom model with similar size, optical properties, and flow speeds as a mouse limb, as documented in detail in our previous work.10,11 Briefly, these were 3-mm diameter cylindrical phantoms constructed from polyester resin (Casting Craft, Fields Landing, CA) with titanium oxide (TiO2, Sigma-Aldrich, Inc., St. Louis, MO) and ink added to adjust the optical properties which were as follows: reduced scattering coefficient and absorption coefficient . These optical properties were estimated based on previously published time-resolved characterizations of the phantoms at 730 nm (Ref. 14), which were assumed to be a good estimate of the optical properties over the 635- to 800-nm wavelength range used in these experiments. Solutions of fluorescent microspheres (6 μm PeakFlow Claret, P-24670, Invitrogen, Carlsbad, CA) having 650 and 690 nm excitation and emission maxima, respectively, were suspended in phosphate-buffered saline (PBS) and passed through the phantom by connecting the embedded 250 μm internal diameter strand of Tygon tubing (TGY-010-C, Small Parts, Inc., Seattle, WA) to a microsyringe pump (70-2209, Harvard Apparatus, Holliston, MA). To simulate limb movement, phantoms were mounted on a motorized linear translation stage (X-slide, Velmex, Bloomfield, NY) which could move the phantom laterally in a sinusoidal pattern. We tested our system under a variety of physiologically relevant flow speeds (0.5 to ), sphere concentrations ( to ), oscillation frequencies (1 to 3 Hz) and oscillation amplitudes (1 to 5 mm). These frequency ranges were chosen since they approximately match breathing artifacts in mice observed in our previous work and by other groups.10,11,15 We also tested the signal-to-noise ratio (SNR) improvement realized through the use of the 0.1 Hz high-pass filter and increased preamplification with four additional phantoms. For these experiments, microsphere concentrations of and flow speeds of were used, and we did not move the translation stage as above to isolate the improvement realized by the filter. We use the standard definition of , where is the mean spike height in the trace and is the standard deviation of the background noise. Finally, we tested the SNR improvement obtained using open optic collection of fluorescent light, as opposed to fiber optic collection as in our previous prototype.10,11 We used a 1-m long multimode, 0.37 NA, 600 μm core step-index optical fiber (BFL37-600; Thorlabs, Newton, NJ), the output of which was coupled to a PMT using an sub miniature version A (SMA)-coupled achromatic plano-convex lens package (F260 SMA-B; Thorlabs). As in our previous work, we used two 700-nm bandpass filters, (30 nm BP, Edmund Optics) placed between the fiber and the sample and between the fiber output and the PMT. The fiber was positioned as close to the phantom as possible () to maximize light collection. SNR was measured for the open optic and fiber optic configurations for an additional four phantoms with at a flow rate of . 2.3.In Vivo Testing of the DFFCWe tested our system in vivo with nude () mice injected with MSCs. Before injection, suspensions of MSCs were incubated for 30 min at 37°C with 0.1 mM DiD (Molecular Probes, Eugene, OR) and washed three times to remove excess dye. Mice were anesthetized using a cocktail of ketamine () and xylazine () and a total of labeled MSCs suspended in 100 μL of media were injected via the tail vein (), leading to approximately initially in circulation in the blood volume. Uninjected () mice served as controls. MSCs were observed to take up DiD by approximately a factor of 2 compared to MM cells as we used in our previous studies.10,11 Mice were placed on an adjustable platform in front of the DFFC with a warming pad. The back leg was positioned under the detector and carefully secured to a holder with medical adhesive tape to limit breathing movement as much as possible. The lower section of the mouse leg (approximately 3 mm in diameter) was placed in the DFFC field of view. Illumination with two lasers on opposite sides of the limb generated a symmetrical but nonuniform fluence profile in the cross-section, which may have resulted in minor differences in sensitivity at different axial positions. Approximately 5 to 10 min passed between the time of injection and DFFC data collection, and data was acquired for at least 30 min in each case. 2.4.Movement Artifact CorrectionMovement artifacts were removed from the fluorescence traces using where is the corrected fluorescence trace, and and were measured signals at 700 and 800 nm, respectively. The scalar reflected the inherent relative autofluorescence intensities at 700 and 800 nm as well as differences in detection efficiency (optical throughput, detector sensitivity, etc.). Accurate estimation of this parameter was critical to the approach. Initially, we attempted to simply measure the mean value of the ratio of the two traces for a control (uninjected) mouse. However, it was determined experimentally that this value varied by as much as 300% between individual animals. A more robust method was to estimate for individual mice using the ratio of the variances of the two signals,Here, a fixed percentage of measured data points with greatest deviation from mean was excluded from the variance calculation. The rationale was that the points with the largest deviation may contain signals from circulating cells and thus should be excluded from estimation of . As we describe below, it was experimentally determined using phantom models that rejection of about 50% of the data set resulted in stable estimation of at cell concentrations in the range of to which corresponds to the expected operating range of our system in vivo. 2.5.Fluorescence Microscopy In Vivo Flow CytometryWe also performed fluorescence microscopy IVFC on severe combined immunodeficiency (SCID) mice in parallel (as has been described in detail previously)5 to compare and validate the MSC clearance kinetics measured with the DFFC prototype. Briefly, three mice were anesthetized with inhaled isofluorane and MSC Vybrant-DiD-labeled cells (using the same labeling protocol as above) were injected intravenously. Mice were positioned on a temperature-controlled stage (32°C). An appropriate arteriole in the ear was then chosen for obtaining measurements. Fluorescence from DiD-labeled cells was excited with a 633-nm HeNe laser (1144P, JDS Uniphase, Milpitas, Ca) focused across the arteriole and fluorescence signal was detected by a PMT (R3896 with socket C6271, Hamamatsu Corporation, Bridgewater, NJ) through a filter (XF3030 670DF40, Omega Optical, Brattleboro, VT). The output of the PMT was digitized for analysis on a personal computer equipped with MATLAB software (The MathWorks) and cell counts per minute following injection are obtained. The time between injection and beginning of IVFC measurements was about 3 min. 3.Results and Discussion3.1.Phantom ExperimentsWe first tested our system with phantoms mounted on a motorized linear translation stage. Example data is shown in Fig. 2(a)–2(d), where solutions of were flowed through a phantom at . In this case, the phantom was moved laterally in a sinusoidal pattern with 2 mm amplitude (representing a large movement artifact effect) at a frequency of 1.8 Hz. Data traces acquired at 700 and 800 nm are shown in Fig. 2(a) and 2(b), respectively. In Fig. 2(b), the 800 nm signal was scaled by (in this case about 2.5), reflecting the relative sensitivity and autofluorescence intensity between the two channels (minimal fluorescence bleed was observed in the 800-nm channel since the microsphere emission spectra was narrower than Vybrant-DiD). As is evident, sinusoidal movement artifacts almost completely obscured some fluorescent spikes from microspheres in the 700 nm trace (red arrows). We then applied our movement correction algorithm and the results are plotted in Fig. 2(c), wherein the individual fluorescence spikes were significantly more apparent. In the specific example in Fig. 2(a)–2(c), the average spike SNR was increased from 21.8 to 28.1 dB, with an average SNR improvement of approximately 6 dB over all phantoms tested. As a further check, we applied a 1.8-Hz notch filter directly to the 700 nm data and replotted the data in Fig. 2(d). Excellent agreement between the two traces was observed, demonstrating the efficacy of the movement artifact rejection approach. It is noted, however, that this type of simple signal filtering of movement artifacts is not possible in mice in vivo since the frequency of movement artifacts exhibits strong inter- and intraexperimental variability and overlaps with detected spikes. Fig. 2Example data trace acquired at 700 nm (a) from a flow phantom with , physically moved at 1.8 Hz with 2 mm amplitude. The effects of movement artifacts are evident as they obscure fluorescent spikes from the microspheres. (b) the background signal acquired at 800 nm scaled by weighting factor (see text for details), (c) weighted subtraction of the out-of-band signals allowed effective removal of the movement artifacts, allowing better visualization of spikes, and (d) replotting the 700 nm data trace with a 1.8 Hz-bandpass filter applied in post-processing, demonstrating the accuracy of the motion artifact removal approach. Example data acquired (e) with and (f) without the 0.1 Hz high-pass filter in operation. Removing the DC component of the signal allowed us to increase amplification, increasing the average SNR by approximately 4 dB. Example data acquired from a phantom (g) with open optics setup as shown in Fig. 1(a), and (h) with fiber-optic light collection similar to our previous design (Refs. 10, 11), increasing the SNR by approximately 7 dB. 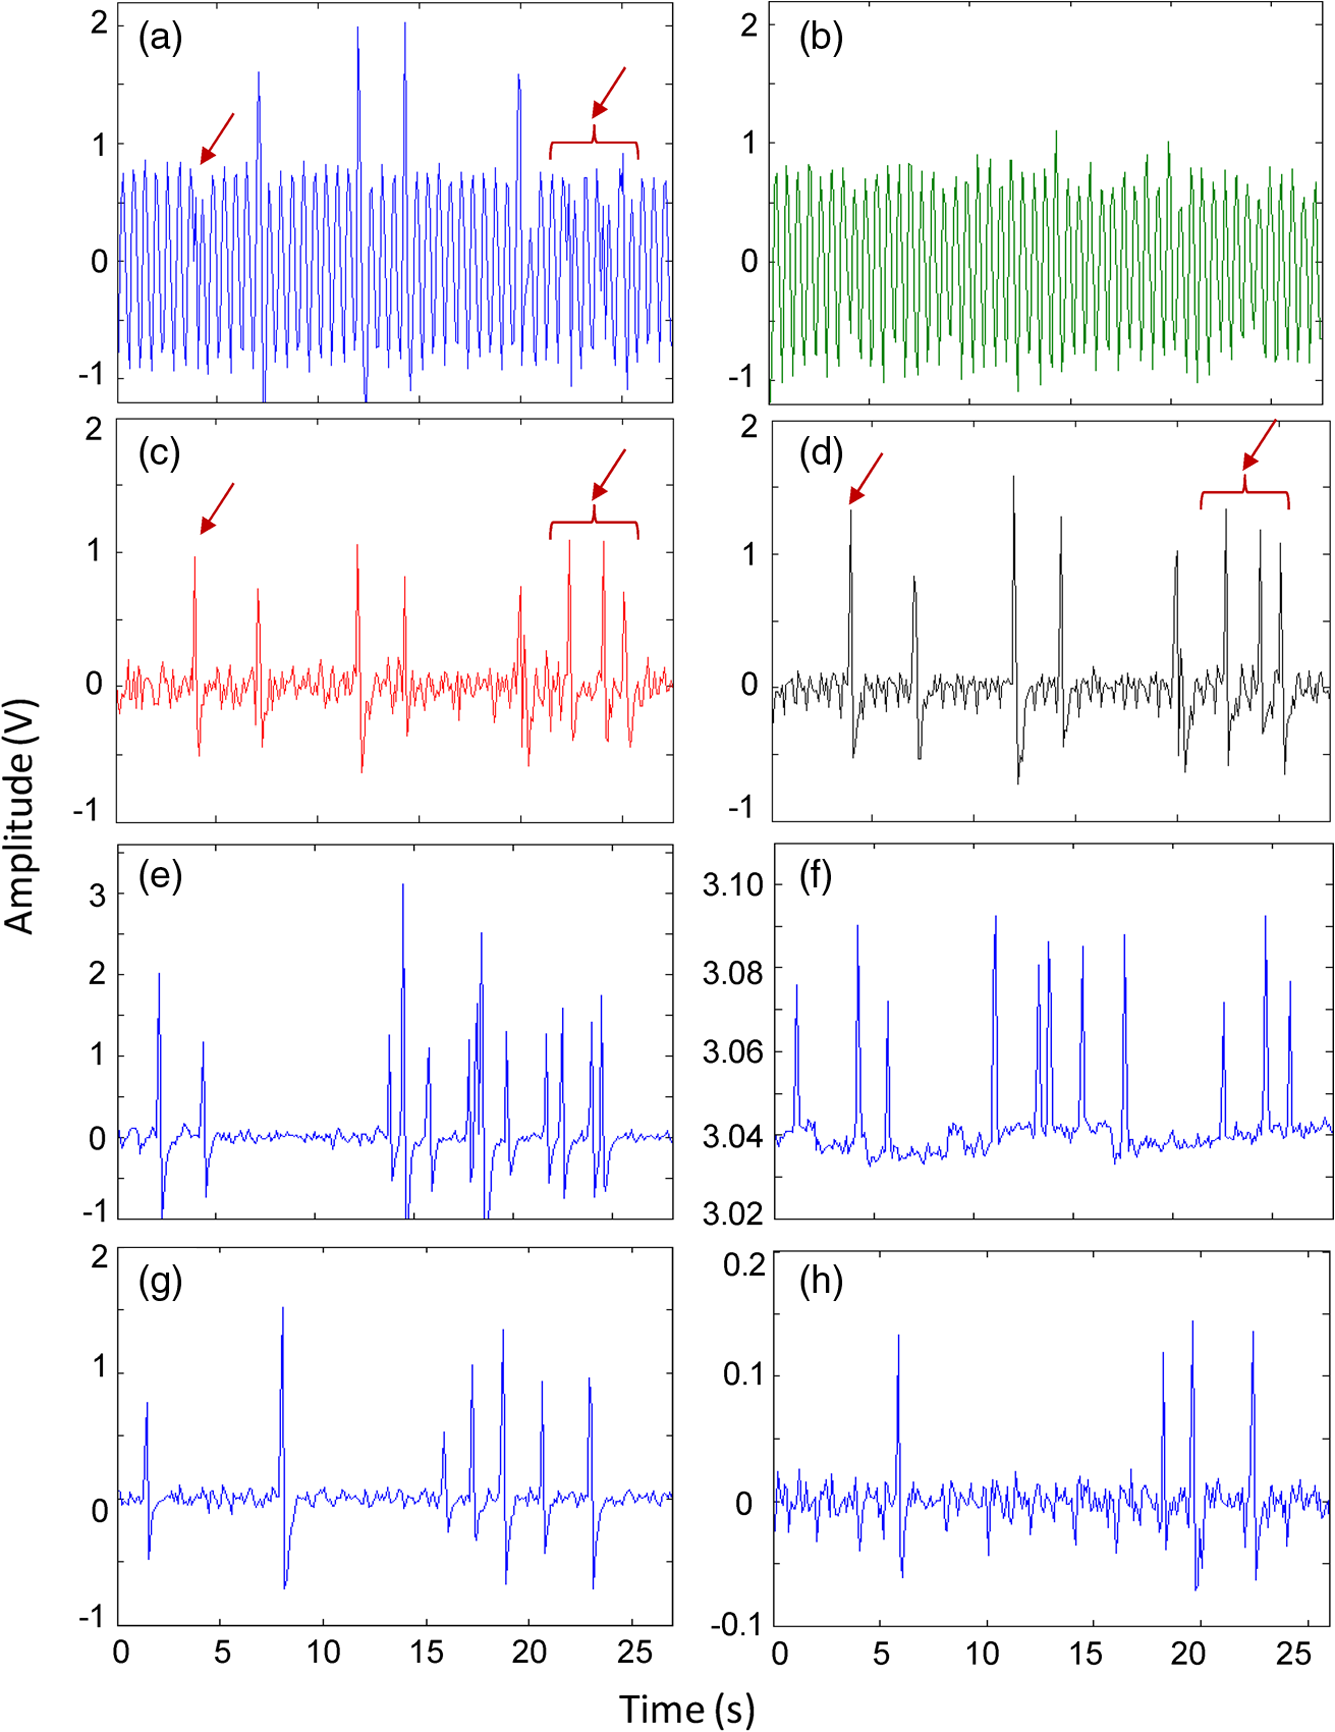 Further SNR improvement was gained from the use of a high pass (0.1 Hz) preamplifier filter, which allowed greater amplification of the PMT output without saturating the input limit of our DAQ board. Example data acquired with and without the high-pass filter in operation are shown in Fig. 2(e) and 2(f), respectively. On average, use of the high-pass filter improved the SNR from to (i.e., approximately 4 dB) over the phantoms tested. Likewise, we quantified the improvement in SNR obtained using open-optic versus fiber-optic collection of fluorescent light as shown in Fig. 2(g) and 2(h), respectively. On average, the SNR with fiber collection was compared with with open optics for the phantoms tested, yielding an average improvement of approximately 7 dB. We note that in our previous work,10,11 we used an array of six detector fibers to improve this SNR (and summed the signal from the six channels); as such we intend to use at least four detector arms [as in Fig. 1(a)] in DFFC future prototypes to further increase collection efficiency. For phantom experiments, it was possible to directly calculate the ratio [as in Eq. (1)] by first running a blank solution of PBS through the phantom. However, when operating the DFFC in vivo, this is not generally possible since cells are frequently injected prior to scanning. Therefore, to estimate when fluorescent microspheres were present in the signal, we flowed dilutions of spheres through phantoms at , , or . As shown in Fig. 3, we excluded a fixed percentage of points with the largest deviation from the calculation and compared this to the “true” value of , which was obtained by flowing PBS through the phantom. Exclusion of of the outliers resulted in negligible error in the estimated value for for our target DFFC operating range of and . At higher concentrations (), was overestimated by about 50% when half of the signal was excluded due to the large fraction of time that spheres were in the DFFC field-of-view. Although this implies an upper limit of DFFC operation in vivo (without additional processing), we note that, in practice, this effect would lead to overestimation of which would reduce the amplitude of detected spikes. This is preferable to underestimation which might produce false-positive cell counts. Further, this error is actually significantly smaller than observed when using a separate uninjected control animal to estimate . 3.2.In Vivo ExperimentsExample data from the in vivo experiments are shown in Fig. 4(a)–4(i). Example traces acquired at 700 nm are shown for two injected and one uninjected control mouse in Fig. 4(a), 4(d) and 4(g), respectively. Although mice were properly anesthetized and the hindleg restrained, significant movement artifacts were observed in the control data [Fig. 4(g)] which, by simple inspection, were difficult or impossible to differentiate from circulating cells [Fig. 4(a) and 4(d)]. Movement correction was performed by weighted subtraction of data acquired at 800 nm shown in Fig. 4(b), 4(e), and 4(h); as above, the 800 nm traces presented were scaled by . In general, varied significantly between individual animals and for the subset of data in Fig. 4 ranged from 3.1 to 10.0. The corresponding background-subtracted data were then replotted in Fig. 4(c), 4(f), and 4(i). In all experiments performed, this operation suppressed motion artifacts in control mice [Fig. 4(i)], while substantial residual fluorescence, i.e., fluorescent “spikes,” were observed in injected mice [Fig. 4(c) and 4(f)]. However, significant bleed from the Vybrant-DiD fluorescent tail was observed in the 800-nm channel [i.e., in Fig. 4(b) and 4(e)] which, when weighted by , reduced the overall spike height by approximately 40% to 75% [Fig. 4(c) and 4(f)] depending on the ratio of the background autofluorescence between the two channels (i.e., larger values of resulted in a greater effect). Similar reduction was observed when we tested Vybrant-DiD-labeled MSCs in optical flow phantoms as shown in Fig. 4(j)–4(l). In this phantom, was 4.8 and spike heights were reduced on average by about 45%. Unlike in phantoms, the average SNR of detected spikes measured in vivo before and after motion artifact correction was comparable ( pre versus ), primarily due to the issue of bleed into the 800-nm background channel and associated reduction of spike height. We expect that better selection of detection filters and fluorophores can mitigate or eliminate this problem in the future and as a result further improve the system SNR. Despite this issue, we were able to measure clear spikes in vivo following background subtraction in the injected mice we tested, and motion artifacts were effectively suppressed in control mice. Fig. 4Example data acquired from the hindleg of (a–f) nude mice injected with Vybrant-DiD labeled MSCs, and (g–i) uninjected control mice. As is evident from the data acquired at 700 nm (a, d, g) movement artifacts were problematic since they obscured cells and potentially introduced false-positive counts in control mice. (b, e, h) Background signals were acquired at 800 nm and then scaled by the weighting factor . (c, f, i) Weighted subtraction was performed, significantly reducing movement artifacts. After rescaling, emission from the Vybrant DiD fluorophore in the 800-nm channel reduced the corrected spike heights, an effect that was also observed when we tested (j–l) optical flow phantoms with fluorescently labeled MSCs. The (j) fluorescence signal, (k) scaled background signal, and (l) corrected signal are shown. Dotted lines in panels (c, f, g, l) indicate the counting threshold for each sample.  Moreover, cells could be enumerated with this technique as follows: We counted any detected spikes above a minimum threshold equal to four times the standard deviation above baseline as a cell. This threshold is indicated by the dotted lines in Fig. 4(c), 4(f), and 4(i) for these specific mice, but this threshold varied significantly between individual animals depending on background noise. Using this definition, the motion artifact rejection algorithm reduced the false-positive rate in control (uninjected) mice on average by a factor of 3, from to (the latter value being in reasonable agreement with the expected false-positive rate of based on the threshold and assuming normally disturbed data acquired at 600 data ). Therefore, this significant reduction in false-positive cell counts allowed us to take an advantage from the lower optical attenuation of the hindleg (which we estimate was approximately half that of the tail) and resulted in improved instrument sensitivity. Example clearance data for MSCs measured with the DFFC is shown in Fig. 5 (red line), showing the normalized cell count rate as a function of time (there were approximately 5 to 10 min between injection and start of data acquisition). The error bars shown are the standard error from three repeated experimental trials. As a comparison, the clearance kinetics of injected MSC cells in SCID mice was measured using fluorescence microscopy IVFC,5 and the data is also shown in Fig. 5 (blue line). These experiments were performed in parallel on different mice, but nonetheless allow comparison of clearance kinetics measured by the two systems. We normalized the data in Fig. 5 to the first measurement time point for both instruments since the exact time from injection to start of the acquisition was slightly different in both cases and since significantly different concentrations of cells were injected. Generally, the kinetics agreed well, indicating a cell clearance half-life of about 10 min although slightly faster clearance was measured with the DFFC system in nude mice. This disagreement may have been due to the use of different mouse strains or dilutions of MSCs between experiments. Since IVFC is a well-characterized approach, this demonstrates the ability of the DFFC to quantitatively measure rapid changes in cell populations in vivo. Fig. 5Example data showing clearance of MSCs from circulation after injection. Normalized cell counts acquired with the DFFC for cells injected are shown, along with normalized cell counts acquired using IVFC in SCID mice injected with cells for comparison. Both methods yielded a circulation half-life of about 10 min.  Finally, we could estimate the overall sensitivity of our DFFC prototype as follows: of the injected cell concentration of , our flow cytometry analysis of drawn peripheral blood samples indicates that between 1% and 10% remained in circulation 5 min following injection (unpublished data) since many of the MSCs are trapped at the site of injection as well as in the lung and spleen as the initial injected bolus of cells passes through the animal. Therefore, the true concentration of circulating cells is not known but was most likely in the range of 50 to . At this concentration, our measured maximum cell count rate (i.e., at the first time point in Fig. 5) was . Therefore, assuming a 1-h acquisition, the minimum sensitivity would be in the range of 0.14 to . Given that the DFFC system has a false-positive rate of (after correction), we can estimate that our system has detection sensitivity on the order of . In conclusion, these data demonstrate the high detection sensitivity of our new DFFC prototype compared to our previous work.10,11 We previously performed DFFC scanning in the mouse tail since it could be easily immobilized, but detection sensitivity suffered due to the dense, optically attenuating connective tissue. As such, the improved sensitivity shown in this work resulted from the lower optical attenuation of the hindleg and an efficient rejection of movement artifacts. This was important since movement artifacts created a relatively high number of false-positive counts (i.e., ) relative to true counts ( at maximum in these studies). Filtering of the DC component of the PMT output also allowed us to better amplify the detected fluorescent spikes without saturating the input of our DAQ board, which further improved sensitivity. Finally, use of open optic collection of fluorescent light (as opposed to fiber optic collection) improved collection efficiency and the overall sensitivity of the instrument. Compared to our previous prototype,10,11 we also used larger single element PMTs (with active detector area) versus a multianode PMT (with detector area per anode). Both PMTs had similar quantum efficiency in this spectral range. Although we did not test this directly, the larger PMT active area may have further increased SNR. We also recorded the amplified analog output of the PMT in the current prototype as opposed to performing photon counting as we did previously. Optimization of detection optics to reduce or eliminate fluorophore bleed into the background detection channel is a priority in future prototypes. We also plan to test our system with alternate cell lines and mouse models. Our choice of excitation laser and emission filters for this prototype will allow us to use the technique for a range of immunotargeted organic near-infrared fluorophores or constitutively expressed fluorescent proteins for the long-term study of a number of biological models.16 In particular, we anticipate that this technique has significant potential use in applications where very rare circulating cell populations are of interest, such as study of early-stage metastatic development or dissemination of hematological malignancies in small animals. Moreover, as we have documented in our earlier work, it is also possible that individual cells could be over-counted if they passed through the DFFC field-of-view multiple times in the vasculature. Therefore, in the future, we also plan to add tomographic imaging capabilities to this system as we have done previously10 through modulation of the sources and the addition of multiple detector arms. AcknowledgmentsThis work was funded with a grant from the National Institutes of Health (Grant No. 5R21HL098750) and from a New Investigator award from the Massachusetts Life Sciences Center. The authors wish to thank an anonymous reviewer for helpful comments in preparation of this manuscript. ReferencesR. R. Mathiesenet al.,
“Persistence of disseminated tumor cells after neoadjuvant treatment for locally advanced breast cancer predicts poor survival,”
Breast Cancer Res., 14
(4), R117
(2012). http://dx.doi.org/10.1186/bcr3242 BCTRD6 0167-6806 Google Scholar
P. S. SteegD. Theodorescu,
“Metastasis: a therapeutic target for cancer,”
Nat. Clin. Pract. Oncol., 5
(4), 206
–219
(2008). http://dx.doi.org/10.1038/ncponc1066 1743-4254 Google Scholar
C. Lo Celsoet al.,
“Live-animal tracking of individual haematopoietic stem/progenitor cells in their niche,”
Nature, 457
(7225), 92
–96
(2009). http://dx.doi.org/10.1038/nature07434 Google Scholar
A. K. Azabet al.,
“Hypoxia promotes dissemination of multiple myeloma through acquisition of epithelial to mesenchymal transition-like features,”
Blood, 119
(24), 5782
–5794
(2012). http://dx.doi.org/10.1182/blood-2011-09-380410 BLOOAW 0006-4971 Google Scholar
I. Georgakoudiet al.,
“In vivo flow cytometry: a new method for enumerating circulating cancer cells,”
Cancer Res., 64
(15), 5044
–5047
(2004). http://dx.doi.org/10.1158/0008-5472.CAN-04-1058 CNREA8 0008-5472 Google Scholar
Z. C. Fanet al.,
“Real-time monitoring of rare circulating hepatocellular carcinoma cells in an orthotopic model by in vivo flow cytometry assesses resection on metastasis,”
Cancer Res., 72
(10), 2683
–2691
(2012). http://dx.doi.org/10.1158/0008-5472.CAN-11-3733 CNREA8 0008-5472 Google Scholar
E. I. GalanzhaV. P. Zharov,
“Photoacoustic flow cytometry,”
Methods, 57
(3), 280
–296
(2012). http://dx.doi.org/10.1016/j.ymeth.2012.06.009 MTHDE9 1046-2023 Google Scholar
V. P. ZharovE. I. GalanzhaV. V. Tuchin,
“Integrated photothermal flow cytometry in vivo,”
J. Biomed. Opt., 10
(5), 051502
(2005). http://dx.doi.org/10.1117/1.2070167 JBOPFO 1083-3668 Google Scholar
E. I. Galanzhaet al.,
“In vivo, noninvasive, label-free detection and eradication of circulating metastatic melanoma cells using two-color photoacoustic flow cytometry with a diode laser,”
Cancer Res., 69
(20), 7926
–7934
(2009). http://dx.doi.org/10.1158/0008-5472.CAN-08-4900 CNREA8 0008-5472 Google Scholar
E. Zettergrenet al.,
“Tomographic sensing and localization of fluorescently labeled circulating cells in mice in vivo,”
Phys. Med. Biol., 57
(14), 4627
–4641
(2012). http://dx.doi.org/10.1088/0031-9155/57/14/4627 PHMBA7 0031-9155 Google Scholar
E. Zettergrenet al.,
“Instrument for fluorescence sensing of circulating cells with diffuse light in mice in vivo,”
J. Biomed. Opt., 17
(3), 037001
(2012). http://dx.doi.org/10.1117/1.JBO.17.3.037001 JBOPFO 1083-3668 Google Scholar
S. Wagneret al.,
“Time-of-flight quantitative measurements of blood flow in mouse hindlimbs,”
J. Magn. Reson. Imaging, 19
(4), 468
–474
(2004). http://dx.doi.org/10.1002/(ISSN)1522-2586 1053-1807 Google Scholar
D. Shcherboet al.,
“Bright far-red fluorescent protein for whole-body imaging,”
Nat. Methods, 4
(9), 741
–746
(2007). http://dx.doi.org/10.1038/nmeth1083 1548-7091 Google Scholar
J. Baetenet al.,
“Development of fluorescent materials for Diffuse Fluorescence Tomography standards and phantoms,”
Opt. Express, 15
(14), 8681
–8694
(2007). http://dx.doi.org/10.1364/OE.15.008681 OPEXFF 1094-4087 Google Scholar
S. H. Yunet al.,
“Motion artifacts in optical coherence tomography with frequency-domain ranging,”
Opt. Express, 12
(13), 2977
–2998
(2004). http://dx.doi.org/10.1364/OPEX.12.002977 OPEXFF 1094-4087 Google Scholar
C. M. Pitsillideset al.,
“Cell labeling approaches for fluorescence-based in vivo flow cytometry,”
Cytometry A, 79A
(10), 758
–765
(2011). http://dx.doi.org/10.1002/cyto.a.v79a.10 1552-4922 Google Scholar
|