
|
|
1.IntroductionRapid noninvasive label-free molecular imaging is essential for monitoring biological dynamics of single living cells. Germination of bacterial spores is a dynamic process in which dormant spores return to life upon stimulation by nutrient or nonnutrient agents. Dormant bacterial spores are very resistant to harsh environments and can remain dormant and survive for many years.1 However, when spores are exposed to specific chemicals, they can rapidly return to life through germination and then outgrowth.2,3 Spore germination takes place in two stages. In stage I, germinants bind to specific receptors located in the spores’ inner membrane, triggering the rapid (1 to 3 min) release of small molecules and their replacement by water; the molecules released are most notably the large depot ( of spore core dry weight) of dipicolinic acid (DPA) present in a chelate with divalent cations, predominately (CaDPA)4 In stage II, the peptidoglycan cortex is hydrolyzed, which allows further core water uptake; stage II takes tens of minutes to complete and is followed by spore outgrowth. A widely used method to monitor spore germination is phase contrast microscopy.5–7 Dormant spores with their cores’ high refractive index appear phase bright, but germinated spores have a low refractive index due to the release of core small molecules and their replacement by water, and thus appear phase dark. Raman spectroscopy and optical tweezers have also been combined with phase contrast microscopy to characterize the kinetics of germination of individual spores.8,9,10 In the latter work, a precise correspondence has been established between the initial rapid drop in spore refractility during germination and the release of the great majority of spore’s CaDPA, followed by a slower further drop of in spore refractility due to cortex hydrolysis, and concomitant core swelling and further core water uptake. In previous studies, the method of Raman spectra intensity analysis has given information on the levels of various molecules in individual spores. Raman imaging is a powerful molecular spectroscopy technique for generating images of different molecules in living cells.11–13 Compared with the most popular fluorescence imaging methods used in biological studies, being label-free and noninvasive are two major advantages of Raman imaging.11–14 A traditional spontaneous Raman spectrum can provide a large spectral range and can image several different biological molecules at the same time. However, spontaneous Raman scattering of biological molecules is very weak and requires tens of seconds of exposure time to collect enough Raman scattering light from a sample point excited by a highly focused laser.14 If combined with normal point-scan imaging mapping, it normally takes tens of minutes to generate a full Raman image.14,15 Consequently, the low time resolution of spontaneous Raman scattering limits its application in observation of fast dynamic biological processes. Nonlinear Raman techniques such as coherent anti-Stokes Raman scattering (CARS)16,17 and stimulated Raman scattering (SRS)18,19 have been developed largely to enhance the Raman signal, and video-rate molecular imaging by nonlinear Raman spectroscopy has been realized.20,21 However, CARS or SRS usually obtain just one vibrational mode of the Raman spectrum, and thus, provide an image of only one biomolecule in living cells. In addition, ultrafast pulsed lasers are usually employed in CARS or SRS, which may influence the dynamic behaviors of single germinating spores due to the very high-peak power of the lasers used. Until now, no molecular distribution changes have been reported using Raman imaging to follow a single spore’s germination. In order to achieve this goal, an advanced Raman imaging system should have the following requirements: (1) being noninvasive is essential, so that a low-power continuous-wave near-infrared laser is employed; (2) phase contrast microscopy should be combined with the Raman imaging system to pinpoint the overall kinetics of spore germination;15–19 (3) bacterial spores are very small (1 to 2 μm in size), and thus, a high spatial resolution of the imaging system is required; (4) stage I of spore germination takes from tens of seconds to tens of minutes depending on the species and germination temperature used,8,9 and observation of this event will require a high-imaging speed; and (5) the total spore germination time including stages I and II can take 30 min to many hours,8,9,10 and because of spores’ small size, long-term stability in the axial direction between the objective and an individual spore is required to enable the exciting laser to remain focused on the spore for continuous Raman spectral acquisition. Recently, multifocus confocal Raman microspectroscopy has been developed to achieve a fast imaging speed.22–24 Different from the line-scan technique, multifocus confocal excitation can give the same high spatial resolution as that of confocal point-scan mapping.15 In this paper, we have further improved our recently developed multifocus confocal Raman system24 by increasing the time resolution to for acquiring one Raman image as well as stabilizing the laser focus position along the axial direction, giving a long-term stability of . With these improvements, we now report the successful Raman imaging of several molecules’ dynamic distribution during the germination of single bacterial spores using a low-power continuous-wave near-infrared laser. 2.Experimental Section2.1.Bacterial Spore Used and PreparationThe Bacillus megaterium strains used in this work were QM B1551 (wild-type; originally obtained from H.S. Levinson) and PS4164 (cwlJ),25 in which the gene encoding CwlJ, one of the two redundant cortex-lytic enzymes (CLEs) in B. megaterium QM B1551, has been insertionally inactivated. Spores of B. megaterium strains were prepared at 30°C in liquid-supplemented nutrient broth without antibiotics, cleaned by repeated centrifugation and washing with water, and stored in water at 4°C protected from light.26 B. megaterium spores were heat activated at 60°C for in water, cooled on ice for 10 min, and germinated with 10 mM d-glucose and 25 mM buffer (pH 7.4) at room temperature (23°C).25 The Bacillus cereus strain used was B. cereus originally obtained from H.O. Halvorson. B. cereus spores were prepared at 30°C in liquid-defined sporulation medium, harvested by centrifugation, washed extensively with 4°C water over a period of days, and stored at 4°C in water protected from light.26 B. cereus spores were heat activated for 30 min at 65°C in water, cooled on ice for , and germinated at room temperature (23°C) with 10 mM l-alanine in 25 mM Tris–HCl buffer (pH 7.4).9 All spores used in this work were free () from growing or sporulating cells, germinated spores, or cell debris as observed by phase contrast microscopy. 2.2.Experimental Setup and MethodsFigure 1(a) shows the schematic setup of the multifocus confocal Raman system.9,24 A diode laser at 780 nm was the Raman excitation light for Raman imaging. A pair of galvo-mirrors and were used to carry out the multifocus scan, and another galvo-mirror was synchronously mapping the Raman scattering light of each excitation focus point onto different vertical positions of a spectrograph’s CCD chip. The spatial resolutions of the Raman imaging system along the lateral and axial direction were and 1.6 μm, respectively. Stage I of spore germination is very fast and takes only to release the large CaDPA depot from a spore, resulting in a huge decrease in CaDPA Raman scattering intensity.8,9 If the time resolution of Raman image is in minutes, this will be much too slow to accurately follow the CaDPA release that takes place in . Consequently, in order to monitor the fast CaDPA release in stage I of germination by Raman imaging, a high imaging speed is essential. We have realized recording a full Raman image with pixels in 33 s with our multifocus confocal Raman system. The scan step of the Raman image is . In 0.5 s, 30 points of the target spore’s area were exposed, and the corresponding 30 Raman spectra were recorded simultaneously by a spectrograph. Another 0.6 s was the waiting time for the readout time of each of the 30 spectra and the close/open time for the spectrograph’s mechanical shutter. If equipped with an electron multiplying CCD camera, the spectra readout time could be reduced even further and the acquisition time for one Raman image could be less than 20 s. The total incident laser power was 60 mW per 30 points, and the average power for every point was 2 mW. The short exposure time of 0.5 s per point with an average power of 2 mW could generate a good Raman signal from the band at [a maximum Raman band of CaDPA, as shown in Fig. 1(b)] to form a good CaDPA Raman image. However, this exposure time was not good enough to form a Raman image for low intensity Raman bands such as the weak protein band at [Fig. 1(b)]. However, by summing the first 33 s and the second (or the second, and then the third) 33 s acquired Raman spectra, one Raman image with good quality could be formed even for weak Raman bands. In effect, the summing of two (or three) measurements extends the exposure time of each point from 0.5 to 1 s (or 1.5 s) to get a higher Raman signal, and thus, Raman images even of weak bands can be obtained. Fig. 1(a) Experimental setup; DM: dichroic mirrors; GM: galvo-mirrors; (b) Raman spectrum of a single dormant wild-type Bacillus megaterium spore; (c) Phase contrast (c1) and Raman images of the single dormant wild-type B. megaterium spore on a quartz coverslip; (d) Intensity profiles of Raman images in (c). Scale bar: 1 μm. All profiles plotted in (d) were normalized to 1 based on their own maximum intensity values to allow a direct comparison of their width.  Normally, it takes 30 min to many hours to monitor the whole spore germination process. During long observation periods, the Raman excitation laser focus can easily drift outside the spore, since the thickness of the spore attached on the coverslip is less than 1 to 2 μm. Since the laser focus drift would eventually disturb the Raman image measurements, it is critical to keep the Raman excitation laser focus at the height of the target spore to ensure a continuous and stable Raman excitation. Consequently, a custom-made -direction active locking system has been developed and added to our multifocus confocal Raman imaging system. A diode laser at 650 nm was introduced to detect the distance change between the objective and the lower surface of the sample coverslip through total internal reflection and position detection techniques. The feedback signal was added to a fast reaction piezo attached on the bottom of the objective to lock the distance between the objective and the sample coverslip. The measured long-term stability of the locking along the direction was , and the automatic locking could last for more than 12 h. A lamp was used to illuminate the sample for the phase contrast image, and the image was recorded with a digital camera.8,9 The recorded phase contrast images were analyzed in time by the Matlab program, and the real time change in spore refractility as a function of time was plotted to show a spore’s germination status. 3.ResultsFigure 1(b) shows the Raman spectrum of a dormant B. megaterium spore. Raman images from selected vibrational bands of a single B. megaterium spore attached on the surface of a quartz coverslip are shown in Fig. 1(c2)–1(c8). Raman bands at 1017, 1395, and are assigned to CaDPA, is a band with contributions from both CaDPA and protein, is the protein amide I band, and 1156 and are carotenoid bands.8,9,24 Figure 1(c1) is the phase contrast image of the B. megaterium spore. The profiles of the Raman images in Fig. 1(c) have been plotted in Fig. 1(d) to show the distribution of different spore molecules, and the profiles plotted in this figure were normalized to 1 based on their maximum intensity. Because the value of the full-width at half maximal intensity (FWHM) of the profile was used to estimate the width of the diffraction-limited Raman image, the reason for the normalization of profiles in Fig. 1(d) was to allow a direct comparison of each profiles’ width. The and -axes in Fig. 1(d) are along the spore’s minor (left–right) and major axes (up–down), respectively. The data in Fig. 1(d) show that: (1) profiles of CaDPA images, especially for profiles along the spore’s major-axis [Fig. 1(d2)], are relatively flat at the maximum intensity suggesting that CaDPA is evenly distributed in the spore core, partly because the axial resolution of the Raman imaging system was 0.46 μm, while the spore core has a diameter of , (2) profiles of the protein image () and the image from the band that has contributions from both CaDPA and protein () are slightly wider than that of CaDPA (bands at 1017, 1395, and ) images, while CaDPA is only in the spore core and protein is present in the whole spore, the relatively small difference in the profiles of CaDPA and protein Raman images suggests that spore protein is concentrated in the central core, (3) profiles of carotenoid images (1156 and ) are much wider than that of protein and CaDPA images and with a significantly lower intensity at the center; the carotenoids are located only in B. megaterium spore’s outer membrane,2 so the carotenoid distribution reveals the outer membrane region in the spore, and (4) the FWHM of the Raman image intensity profiles for spore’s minor and major axes are 0.86 and 1.09 μm for CaDPA, 0.91 and 1.18 μm for protein, and 1.21 and 1.38 μm for carotenoid, respectively. These values provide information on this spore’s different components, and indicate that the outer membrane is about 300 nm away from the spore core. The observations noted above were similar when four to five individual dormant wild-type B. megaterium spores were analyzed by Raman imaging (data not shown). A single B. megaterium spore’s germination has been observed with Raman images as shown in Fig. 2. Figure 2(a) shows the phase contrast image intensity change as well as the changes in the intensity of different Raman bands calculated from the various Raman images. Image analysis of the germination of four to five spores gave very similar results (data not shown). These data indicated that the protein image ( band) also exhibited a small decrease in intensity during CaDPA release ( band) with no further change after CaDPA was completely released. Figure 2(b) shows the Raman spectra at time points marked in Fig. 2(a). Time-lapse Raman images of CaDPA (), the band with contributions from both CaDPA and protein (), and protein alone () are shown in Fig. 2(c)–2(e), respectively. In order to get better image quality, two continuously measured Raman images (with 33 s acquisition time for each) were summed to give the Raman image in Fig. 2; the time separation between the two adjacent Raman images was 66 s. Figure 2(f1)–2(f3) shows normalized intensity profiles of Raman images of Fig. 2(c)–2(e) along the -axis (up–down direction), respectively. The results suggest the following conclusions: (1) the intensity profiles of the CaDPA Raman image plotted in Fig. 2(f1) show a slightly wider CaDPA distribution at time than at ; and (2) there was no apparent size change in the protein image during germination of B. megaterium spores with d-glucose [Fig. 2(f2)and 2(f3)]. Fig. 2(a) Intensity changes of phase contrast and Raman images as a function of the incubation time during germination of a single wild-type B. megaterium spore on a quartz coverslip; (b) sequential Raman spectra at times marked in (a) during germination; time-lapse Raman images of: (c) the dipicolinic acid (CaDPA) band at , (d) CaDPA and protein together in the band at , and (e) the protein band at at time points marked in (a); (f) intensity profiles of Raman images in (c), (d), and (e). Scale bar: 1 μm. All profiles plotted in (f) were normalized to 1 based on their own maximum intensity values to allow a direct comparison of their width. 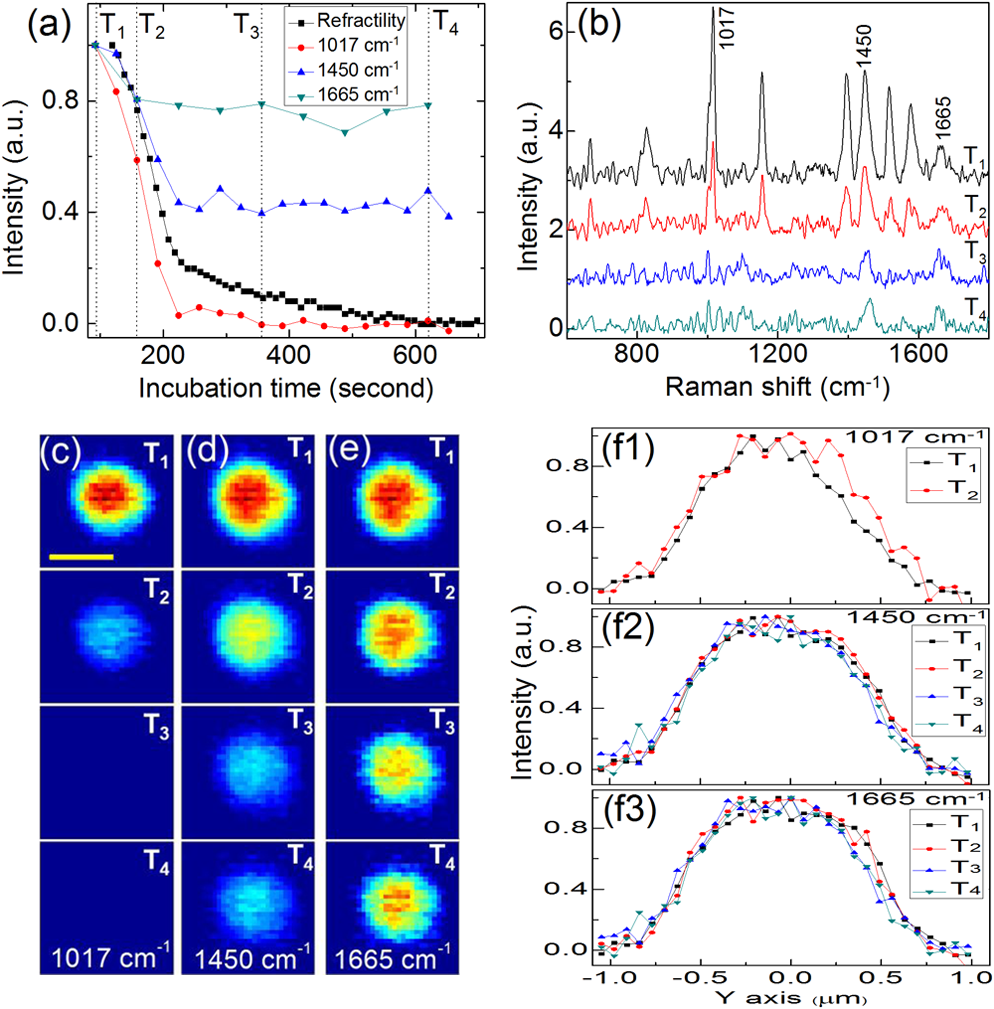 The germination of a single B. megaterium cwlJ spore was also observed with Raman imaging. The cwlJ spores contain only one CLE, SleB, and lack CwlJ,25 and they exhibited slower cortex hydrolysis and slower CaDPA release during spore germination than wild-type B. megaterium spores [compare Fig. 3(a) with Fig. 2(a)]. This was true for all five cwlJ spores examined (data not shown), and the slow CaDPA release from the cwlJ spores was as expected.25 Time-lapse phase contrast images and Raman images at various time points noted in Fig. 3(a) are shown in Fig. 3(c)–3(f), respectively. In Fig. 3, three continuously measured Raman images (with 33 s acquisition time for each) were added together to yield one good quality Raman image. Figure 3(b) shows intensity profiles along the -axis (left–right direction) of CaDPA Raman images in Fig. 3(d). In order to clearly see changes in the CaDPA level, the profiles plotted in Fig. 3(b) were not normalized. Raman images of the cwlJ spore’s germination show that: (1) before time of the slow CaDPA release process, CaDPA was evenly distributed in the spore core, and no change in CaDPA distribution was observed, (2) CaDPA was still evenly distribution in the spore core at when less than 30% of the initial CaDPA level remained, although there was a small expansion of CaDPA distribution at when FWHMs were measured, and (3) no changes in protein distribution were seen in protein Raman images, except for the intensity decrease noted above. Fig. 3(a) Intensity changes of phase contrast and Raman images as a function of incubation time during germination of a single B. megaterium cwlJ spore on a quartz coverslip; (b) intensity profiles of CaDPA Raman images in (d); (c) time-lapse phase contrast images and Raman images of: (d) CaDPA from the band, (e) CaDPA and protein together from the band, and (f) protein from the band at time points marked in (a). Scale bar: 1 μm. All profiles plotted in (b) were the original intensity values of the corresponding Raman images for a clear view of intensity changes. 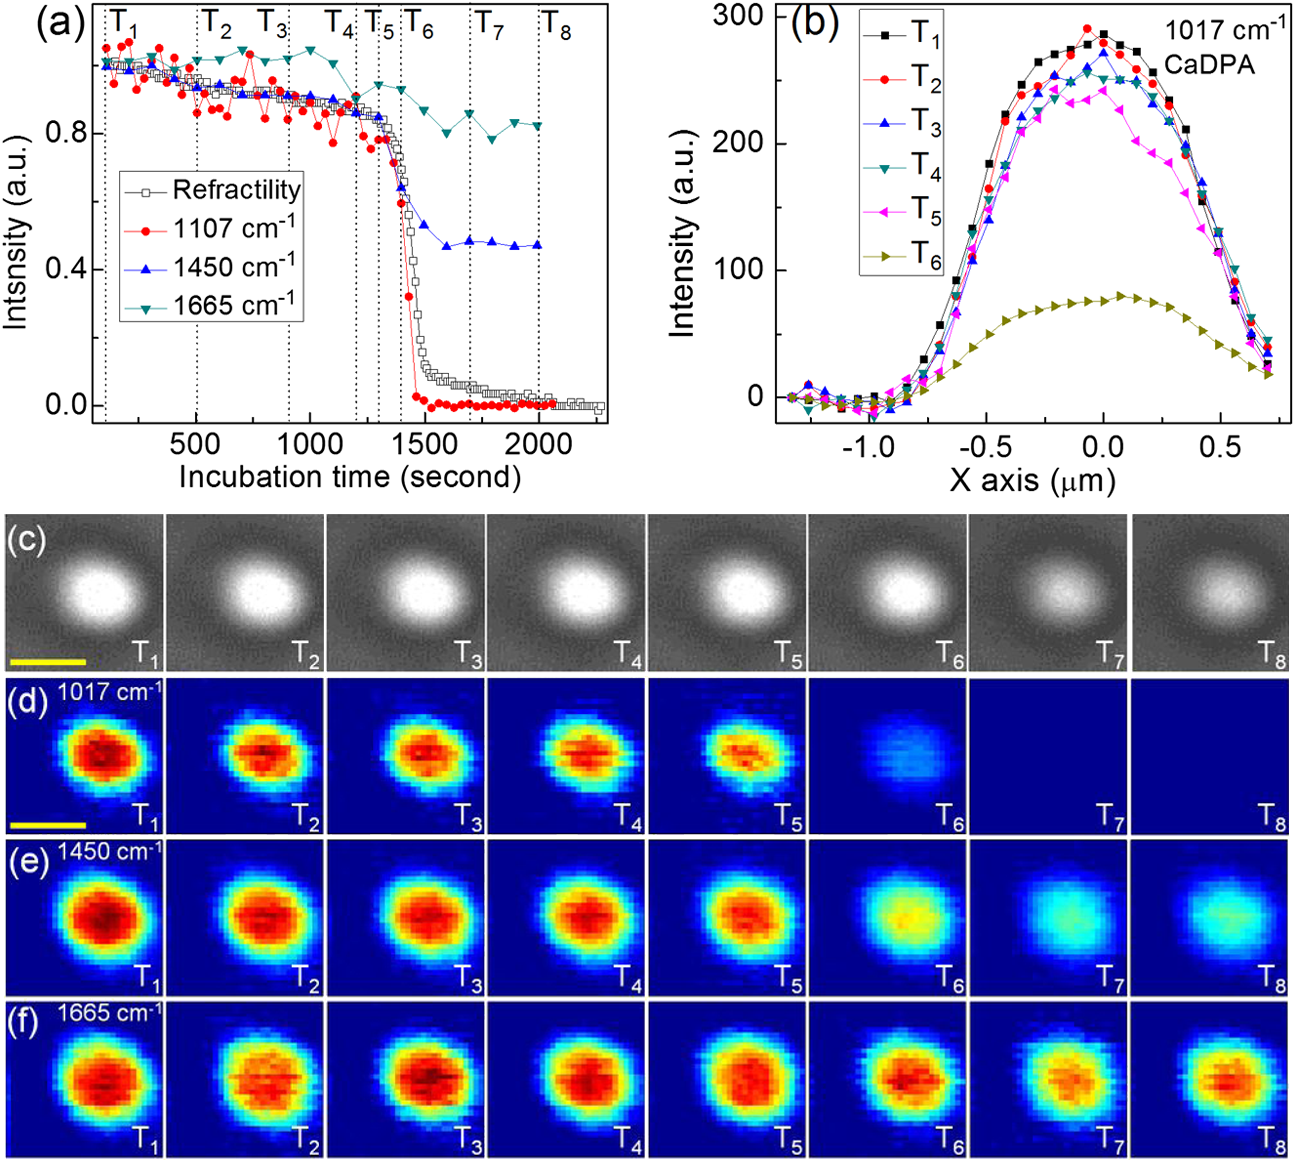 Figure 4 shows Raman images of a single B. cereus spore germinated with l-alanine. In addition to Raman images of CaDPA and protein, a Raman image from the band at due to the nucleic acid [Fig. 4(d)] was also obtained. The nucleic acid Raman band of B. megaterium spores was too weak to obtain a good Raman image; while for the B. cereus spore, the intensity of the Raman band was high enough to obtain a good Raman image of spore nucleic acid. The results from the analyses of the B. cereus spore’s Raman images during spore germination showed that: (1) both nucleic acid and protein images showed slight decreases in intensity during germination [Fig. 4(a)], (2) CaDPA images showed the same behavior as with wild type, and B. megaterium cwlJ spores in that CaDPA remained evenly distribution in the spore core during its release, although there was again a slight expansion of CaDPA distribution beginning soon after fast CaDPA release began, and (3) comparison of the time-lapse Raman images of nucleic acid [Fig. 4(d)] and protein [Fig. 4(f)] from time to showed a slow increase in the sizes of these images as germination proceeded. This expansion could be clearly observed from normalized intensity profiles as shown in Fig. 4(b), and the fitted FWHM values gave an overall radial expansion of . Note that the standard error of Gaussian fitting for the profile was around 80 nm. Five individual B. cereus spores germinated with l-alanine were examined, and the results were similar (data not shown). Fig. 4(a) Intensity changes of phase contrast and Raman images as a function of the incubation time during germination of a single Bacillus cereus spore on a quartz coverslip; (b) intensity profiles of nucleic acid and protein Raman images in (d) and (f); time-lapse phase contrast Raman images of: (c) CaDPA from the band, (d) nucleic acid from the band, (e) CaDPA and protein together from the band, and (f) protein from the band at time points marked in (a). Scale bar: 1 μm. All profiles plotted in (b) were normalized to 1 based on their own maximum intensity values to allow a direct comparison of their width.  4.Discussion and ConclusionsOur multifocus confocal Raman system with a low-power continuous-wave NIR laser has allowed us to successfully observe bacterial spore germination dynamics with Raman image analysis. The time-lapse CaDPA, protein, and nucleic acid images obtained have allowed analysis of the distribution of these molecules in the spore during germination. Conclusions from this work are as follows. First, CaDPA always exhibits an even distribution in the spore core not only in dormant spores, but also during CaDPA release in spore germination. Thus, the intensity profile of CaDPA Raman images of dormant spores exhibited a flat shape at the central maximum, indicating that CaDPA distribution in the spore core is larger than our Raman imaging lateral resolution of 0.46 μm. Consequently, we conclude that CaDPA does not concentrate only in a small central area of the spore core, but rather with an even distribution throughout the core. Similarly, although the intensities of time-lapse CaDPA Raman images decreased gradually during spore germination due to CaDPA release, the corresponding CaDPA intensity profiles always kept the same characteristic flat shape at the central maximum [Figs. 2(f1) and 3(b)], and no decrease in the size of CaDPA distribution during its release was found by fitting the time-lapse CaDPA Raman image intensity profiles. Indeed, the CaDPA distribution exhibited even a slight expansion after fast CaDPA release began during spore germination. The time-lapse Raman images of protein and nucleic acid during spore germination also showed decreases in intensity. These Raman intensity decreases mainly occurred during the CaDPA release process, with only very slight or no decreases after CaDPA was completely released [Figs. 2(a), 3(a), and 4(a)]. These intensity decreases looked to be concentrated only in the spore’s center [Figs. 2(e), 3(f), 4(d), and 4(f)], the position of the spore’s central core. Consequently, these intensity decreases suggest the second conclusion is that protein and nucleic acid levels in the spore’s core also undergo a small decrease during the CaDPA release process. Thus, the CaDPA release process may not be restricted to CaDPA, and some small proteins and nucleic acids may also be released. However, it is also possible that the large increase in core water content accompanying CaDPA release may cause some conformational changes in protein and nucleic acid that alters the intensities of these molecules’ Raman bands. The third conclusion concerns size changes during the spore’s germination. For B. megaterium spores, no size changes were observed for the protein distribution during complete germination, although the CaDPA distribution exhibited a slight increase in size after fast CaDPA release began. For B. cereus spores, in addition to a slight expansion of the size of the CaDPA image during its release, spore core expansion during germination could be clearly observed by analyzing the protein and nucleic acid Raman image [Fig. 4(d) and 4(f)]. Presumably, this latter expansion is due to core expansion following cortex hydrolysis. In summary, rapid Raman image analysis with a near-infrared laser has allowed a detailed observation of the distribution of various molecules during the spore germination process. These analyses have revealed some notable new phenomena and may provide new understanding of the dynamics of the spore germination process. AcknowledgmentsThis work was supported by a Department of Defense Multi-disciplinary University Research Initiative through the U.S. Army Research Laboratory and the U.S. Army Research Office under contract number W911F-09-1-0286 (PS/YQL) and by a grant from the Army Research Office under contract number W911NF-12-1-0325. ReferencesP. Setlow,
“Spores of Bacillus subtilis: their resistance to and killing by radiation, heat and chemicals,”
J. Appl. Microbiol., 101
(3), 514
–525
(2006). http://dx.doi.org/10.1111/jam.2006.101.issue-3 JAMIFK 1364-5072 Google Scholar
P. Setlow,
“Spore germination,”
Curr. Opin. Microbiol., 6
(6), 550
–556
(2003). http://dx.doi.org/10.1016/j.mib.2003.10.001 COMIF7 1369-5274 Google Scholar
A. Moir,
“How do spores germinate?,”
J. Appl. Microbiol., 101
(3), 526
–530
(2006). http://dx.doi.org/10.1111/jam.2006.101.issue-3 JAMIFK 1364-5072 Google Scholar
B. SetlowP. G. WahomeP. Setlow,
“Release of small molecules during germination of spores of Bacillus species,”
J. Bacteriol., 190
(13), 4759
–4763
(2008). http://dx.doi.org/10.1128/JB.00399-08 JOBAAY 0021-9193 Google Scholar
F. Zernike,
“How I discovered phase contrast?,”
Science, 121
(3141), 345
–349
(1955). http://dx.doi.org/10.1126/science.121.3141.345 SCIEAS 0036-8075 Google Scholar
T. HashimotoW. R. FriebenS. F. Conti,
“Germination of single bacterial spores,”
J. Bacteriol., 98
(3), 1011
–1020
(1969). JOBAAY 0021-9193 Google Scholar
S. C. Stringeret al.,
“Heterogeneity of times required for germination and outgrowth from single spores of nonproteolytic Clostridium botulinum,”
Appl. Environ. Microbiol., 71
(9), 4998
–5003
(2005). http://dx.doi.org/10.1128/AEM.71.9.4998-5003.2005 AEMIDF 0099-2240 Google Scholar
L. B. Konget al.,
“Characterization of bacterial spore germination using integrated phase contrast microscopy, Raman spectroscopy, and optical tweezers,”
Anal. Chem., 82
(9), 3840
–3847
(2010). http://dx.doi.org/10.1021/ac1003322 ANCHAM 0003-2700 Google Scholar
L. B. Konget al.,
“Characterization of bacterial spore germination using phase-contrast and fluorescence microscopy, Raman spectroscopy and optical tweezers,”
Nat. Protoc., 6
(5), 625
–639
(2011). http://dx.doi.org/10.1038/nprot.2011.307 NPARDW 1754-2189 Google Scholar
L. B. Konget al.,
“Monitoring the kinetics of uptake of a nucleic acid dye during the germination of single spores of Bacillus species,”
Anal. Chem., 82
(20), 8717
–8724
(2010). http://dx.doi.org/10.1021/ac1022327 ANCHAM 0003-2700 Google Scholar
G. TurrellJ. Corset, Raman microscopy, Academic Press, San Diego
(1996). Google Scholar
P. J. TreadoM. P. Nelson,
“Raman imaging,”
Handbook of Vibrational Spectroscopy, 2 WileyNew York,2002). Google Scholar
G. J. Puppelset al.,
“Studying single living cells and chromosomes by confocal Raman microspectroscopy,”
Nature, 347
(6290), 301
–303
(1990). http://dx.doi.org/10.1038/347301a0 NATUAS 0028-0836 Google Scholar
H. J. van Manenet al.,
“Single-cell Raman and fluorescence microscopy reveal the association of lipid bodies with phagosomes in leukocytes,”
Proc. Natl. Acad. Sci. U.S.A., 102
(29), 10159
–10164
(2005). http://dx.doi.org/10.1073/pnas.0502746102 1091-6490 Google Scholar
S. Schlückeret al.,
“Raman microspectroscopy: a comparison of point, line, and wide-field imaging methodologies,”
Anal. Chem., 75
(16), 4312
–4318
(2003). http://dx.doi.org/10.1021/ac034169h ANCHAM 0003-2700 Google Scholar
F. Ganikhanovet al.,
“High sensitivity vibrational imaging with frequency modulation coherent anti-Stokes Raman scattering (FMCARS) microscopy,”
Opt. Lett., 31
(12), 1872
–1874
(2006). http://dx.doi.org/10.1364/OL.31.001872 OPLEDP 0146-9592 Google Scholar
C. L. EvansX. S. Xie,
“Coherent anti-Stokes Raman scattering microscopy: chemical imaging for biology and medicine,”
Annu. Rev. Anal. Chem., 1
(7), 883
–909
(2008). http://dx.doi.org/10.1146/annurev.anchem.1.031207.112754 ARACFU 1936-1327 Google Scholar
E. Ploetzet al.,
“Femtosecond stimulated Raman microscopy,”
Appl. Phys. B, 87
(3), 389
–393
(2007). http://dx.doi.org/10.1007/s00340-007-2630-x APBOEM 0946-2171 Google Scholar
C.W. Freudigeret al.,
“Label-free biomedical imaging with high sensitivity by stimulated Raman scattering microscopy,”
Science, 322
(5909), 1857
–1861
(2008). http://dx.doi.org/10.1126/science.1165758 SCIEAS 0036-8075 Google Scholar
C. L. Evanset al.,
“Chemical imaging of tissue in vivo with video-rate coherent anti-Stokes Raman scattering microscopy,”
16807
–16812
(2005). Google Scholar
B. G. Saaret al.,
“Video-rate molecular imaging in vivo with stimulated Raman scattering,”
Science, 330
(6009), 1368
–1370
(2010). http://dx.doi.org/10.1126/science.1197236 SCIEAS 0036-8075 Google Scholar
T. Minamikawaet al.,
“Multi-focus excitation coherent anti-Stokes Raman scattering (CARS) microscopy and its applications for real-time imaging,”
Opt. Express, 17
(12), 9526
–9536
(2009). http://dx.doi.org/10.1364/OE.17.009526 OPEXFF 1094-4087 Google Scholar
M. OkunoH. O. Hamaguchi,
“Multifocus confocal Raman microspectroscopy for fast multimode vibrational imaging of living cells,”
Opt. Lett., 35
(24), 4096
–4098
(2010). http://dx.doi.org/10.1364/OL.35.004096 OPLEDP 0146-9592 Google Scholar
L. B. Konget al.,
“Rapid confocal Raman imaging using a synchro multifoci-scan scheme for dynamic monitoring of single living cells,”
Appl. Phys. Lett., 98
(21), 213703
(2011). http://dx.doi.org/10.1063/1.3595482 APPLAB 0003-6951 Google Scholar
B. Setlowet al.,
“Characterization of the germination of Bacillus megaterium spores lacking enzymes that degrade the spore cortex,”
J. Appl. Microbiol., 107
(1), 318
–328
(2009). http://dx.doi.org/10.1111/jam.2009.107.issue-1 JAMIFK 1364-5072 Google Scholar
W. L. NicholsonP. Setlow,
“Sporulation, germination and outgrowth,”
Molecular Biological Methods for Bacillus, 391
–450 Wiley, Chichester, England
(1990). Google Scholar
|


