
|
|
1.IntroductionHypoxia is a characteristic of many locally advanced solid tumors. Inadequate oxygen supply results from inefficient vascular support during exponential cellular proliferation. Hypoxia is an important factor in tumor growth and, consequently, in determining responsiveness to antihypoxia-directed therapies.1–3 The ability to assess variations in tumor oxygenation from changes in arterial blood partial pressure of oxygen () and carbon dioxide () and to correlate these changes to treatment response could identify patients who would benefit from vasoactive interventions.4,5 The methods that have received the most attention for measuring tumor hypoxia involve either oxygen electrodes or tissue immunohistochemistry.6 However, both approaches are invasive and difficult to apply in vivo.7 While human tumor hypoxia has been successfully imaged with positron emission tomography,5 blood oxygen level-dependent magnetic resonance imaging,7 and near-infrared spectral (NIRS) tomography,8 its global effect (which is a more important factor in cellular resistance to treatment7) is less likely to be observed with static blood oxygenation images as these results predominantly reflect perfusion-related hypoxia (because of the distance between blood vessels and hypoxic areas in tissue). Oxygenation changes in tumor during hyperoxic and hypercarbic gas breathing have also been imaged in animal models9,10 and humans.11–13 In these cases, the inspired gas stimulates a change in intravascular oxygenation, which enhances/modifies the diffusion of soluble oxygen into tissue, eventually inducing greater uptake in tumors. The approach represents more than just a passive hypoxia measurement because it is a direct probe of the responsiveness, and thereby aggressiveness, of the tumor. In previous studies, the hyperoxic stimulus has been the administration of , which causes hyperventilation, a reduction in arterial blood , and vasoconstriction, counteracting the effects of the increases in arterial blood on tissue. In addition, each subject has varied response to an increase in inspired concentration. This intersubject variability limits the ability to specify tumor via inspired (Refs. 14 and 15). Since increases in arterial blood and cause vasoconstriction and vasodilation in tumors, respectively, interpretation of these dynamic responses would be significantly improved if arterial blood and were known. Fortunately, these quantities can not only be tracked but they can also be prospectively maintained with an automated computer-controlled gas blender. While end-tidal , , and minute ventilation are commonly linked, this system applies the method described by Slessarev et al.16 to target independent values of inspired end-tidal and gas and minute ventilation. In this preliminary clinical study, the above gas sequencer and breathing circuit have been used to prospectively target and independently sustain end-tidal and values during an imaging session. We hypothesize that the response of tumor vascular and cellular energetics to a transient challenge in blood oxygen delivery is a direct measure of tumor aggressiveness and resistance to anticancer chemotherapies. We expect the higher contrast of dynamic NIR property changes between the tumor area and surrounding normal tissue will obtain better tumor response to treatment early in the course of therapy, especially when acquired during blood gas manipulation through control of inspired gas concentrations. To test this hypothesis, a patient gas access interface was designed to be consistent with breast imaging, and the dynamic vascular changes in breast were imaged with a 30-s time resolution. By analyzing the resulting images from five normal subjects breathing under different gas stimulation patterns, the sequence that maximized tissue vascular and oxygenation changes in the breast was determined. Representative results from one of the normal subject cases shows that maximum changes in deoxy-hemoglobin (Hb), oxygen saturation (), and total hemoglobin () of 21, 9, and 3%, respectively, can be induced. Three breast cancer patients undergoing neoadjuvant chemotherapy (NAC) were also imaged during their course of treatment. 2.Methods and Material2.1.Imaging System and ReconstructionThe basic design of the NIRS system used in this study for simultaneously acquiring three wavelengths of frequency domain data is described in detail elsewhere.17 Briefly, one end of each of the 16 10-mm-diameter optical fiber bundles is placed in a circular plane around the breast. The other ends of these 16 fiber bundles are uniformly attached to a circular rotating stage. One of the 16 fiber bundles is coupled to a source fiber that delivers light from a laser source subsystem, and each of the other 15 fiber bundles is coupled to individual photomultiplier tubes (PMTs) for detecting the diffuse light from 15 different positions around the breast. The laser source subsystem incorporates three laser diodes and couples wavelength and output power levels into the source fiber of , , and , respectively. The laser power at each wavelength is modulated with frequencies of 100.0006, 100.0009, and 100.0013 MHz, respectively, and the electrical outputs of each PMT are heterodyned with a 100.0000 MHz signal to generate offset frequencies of 600, 900, and 1300 Hz, accordingly. The total mixed signal containing each of the three frequencies is sampled, and the individual frequency components are extracted in software with lock-in detection to yield their respective amplitudes and phases. The process is repeated at each of the 16 source positions for all 15 detectors by rotating the stage 360 deg, such that 240 data points of amplitude and phase are acquired at each wavelength, simultaneously. One complete measurement at all source positions occurs in approximately 20 s. A spectrally constrained chromophore and scattering reconstruction method recovers images of the dynamic vascular and oxygenation changes.18 Since we only acquire amplitude and phase data at three wavelengths, the smaller dynamic changes of water and scattering power, which may be present, have been ignored. 2.2.Gas Administration and Stimulus SequenceTo manipulate arterial blood gases during a breast exam, a custom gas sequencer and associated breathing circuits (Respiract™, Thornhill Research, Toronto, Canada) were used. The Respiract™ gas sequencer is designed to prospectively target and sustain end-tidal and independent of each other. Baseline breathing data were obtained at the start of an exam, and a computer calculated and controlled gas flow from three cylinders with different and concentrations while a rebreathing circuit ensured that end-tidal and attained their desired values within a few mmHg. In order to integrate the gas sequencer into our breast imaging system, the original facemask and head holder portion of the exam table were modified. Figure 1 show a typical stimulation sequence used to manipulate the subject’s arterial blood gases. In this sequence, targeted end-tidal values of and were 38 and 100 mmHg for baseline, 45 and 400 mmHg for hypercarbia and hyperoxia (or 45 and 100 mmHg for hypercarbia only), and 38 and 500 mmHg for hyperoxia, respectively. 2.3.Preliminary Study DesignThis preliminary study was carried out under a protocol, which was approved by Dartmouth’s institutional review board. Five normal subjects of different ages and radiographic breast densities and three breast cancer patients undergoing NAC were enrolled and imaged multiple times. All subjects were questioned about their respiratory health, including specific inquiries on their history of asthma, medications, chronic obstructive pulmonary disease, and any current respiratory issues, to ensure inclusion criteria were met without exclusions. Subjects experiencing an exacerbation of a pre-existing respiratory condition and/or a current respiratory or lung problem, which could place them at risk during periods of hypercarbia, were excluded. Before proceeding to imaging, all subjects who met inclusion/exclusion criteria were tested for tolerance to the increase of (up to 45 mmHg or a increase that was no greater than 15% above the subject’s baseline end-tidal ). One of the study subjects had withdrawn at this testing stage because of her extremely low tolerance of increased . Figure 2 shows views of the imaging room in which the custom gas sequencer [Fig. 2(a)] and breathing circuit [Fig. 2(b)] were used to manipulate the arterial blood gases of the subject. The subject was positioned prone on the exam table [Fig. 2(c)] with a face mask applied [Fig. 2(d)]. The elastic straps on the mask are tightened to ensure a proper seal. End-tidal and of the subject were prospectively targeted to follow the inspired gas sequence shown in Fig. 1, and dynamic tissue oxygen changes were imaged in the breast with 30-s time resolution. Fig. 2Views of the imaging room. (a) Console area for NIRS and gas supply control system (Respiract™). Exam table is located behind the window. (b) The breathing circuit under the table next to the fiber optical interface. (c) A subject lying prone on the breast exam table. (d) A subject with facemask before being positioned on the headrest.  3.ResultsFigure 3 shows an example of end-tidal (dashed line), (solid line), and breast (squares) of a normal subject during (a) unregulated inhalation of medical air and (b) regulated inhalation of the gas from the Respiract™ gas sequencer. Without regulation, in the breast fluctuates erratically but with little overall variation on the order of 3% [Fig. 3(a)], whereas with regulation, changes much more smoothly and extensively with a 9% variation following a perturbation in and [Fig. 3(b)]. Fig. 3An example of end-tidal , , and breast of a normal subject during (a) unregulated inhalation of medical air and (b) regulated inhalation of gas with a step change in values at 4 and 10 min. Breast is determined from image data acquired by our dynamic near-infrared spectral (NIRS) tomography system.  Figure 4 shows an example of the dynamic changes in , Hb, and that occur in the breast of a normal subject during the gas manipulating sequence of hypercarbia and hyperoxia followed by periods of hyperoxia. The subject is a 45-year-old woman with mammographically scattered fibroglandular density. Her annual mammographic images indicated that she was free of breast disease. In Fig. 4, the left vertical axes show NIRS properties (i.e., , Hb, and ), whereas the right vertical axes represent one tenth of and . Dashed and solid lines indicate the measured end-tidal and values, and the squares, circles, and crosses show the average , Hb, and data over the whole image plane, over time. During the gas stimulus sequence, the NIRS properties remained constant for the baseline period (; ). As the arterial blood and values were increased to 45 and 400 mmHg (hypercarbia and hyperoxia), respectively, increased while Hb decreased significantly. The same trend continued during the period following baseline when and was further increased to 500 mmHg (hyperoxia). During the last period when and both returned to baseline values, and Hb remained relatively constant as the hyperoxia period ended, but did not return to the values present during the baseline period prior to and increase. As expected, did undergo notable changes during the entire blood gas stimulation process. Total changes in , Hb, and were 9, 21, and , with the variations over the entire image plane being less than , , and , respectively. These results indicate that dynamic NIRS tomography may track vascular and structural, as well as tissue oxygen, changes independently by combining the dynamic responses of the NIRS parameters. Fig. 4Dynamic changes in (a) , (b) Hb, and (c) during a gas stimulus sequence consisting of 5 min of hypercarbia and hyperoxia (; ) followed by periods of hyperoxia (; ). Left vertical axes represent the NIRS properties, and right vertical axes show one tenth of and . Dashed and solid lines indicate measured end-tidal and , and the squares, circles, and crosses show the imaged , Hb, and values over time. 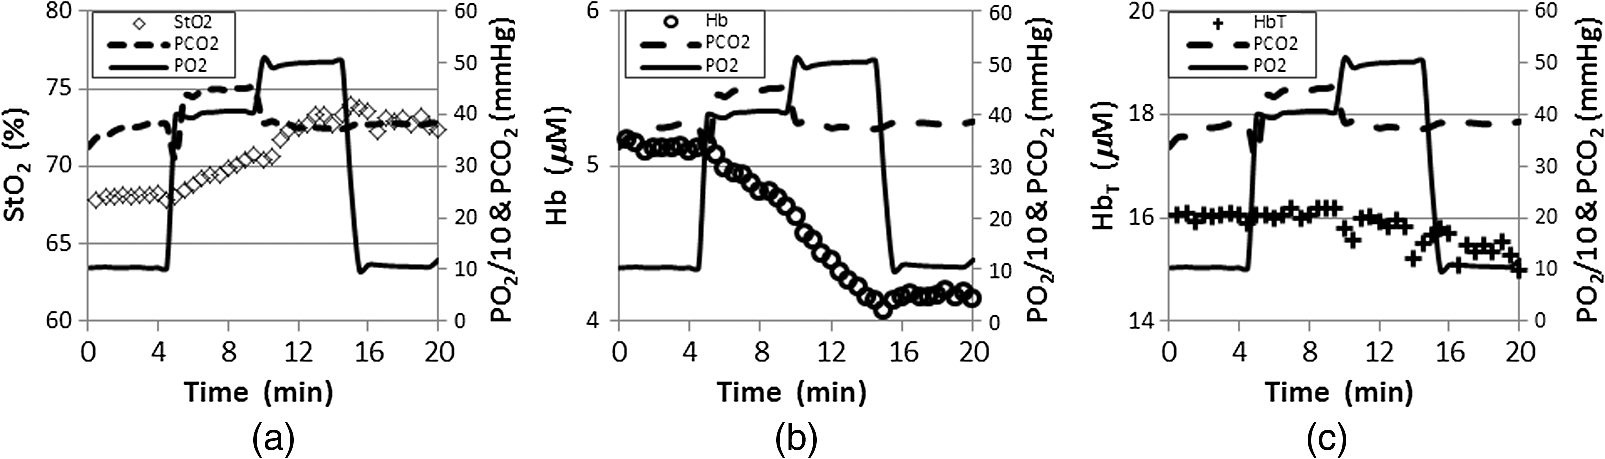 To validate the stability of the gas stimulation and systemically test which mixtures cause the largest change in breast oxygenation, five normal subjects were imaged multiple times under different gas sequences. Figure 5 shows dynamic Hb changes in the breast of a subject during four different stimulus sequences. The imaging sessions were carried out on different days over a three-month period. For each exam session, the images were acquired every 30 s during a total imaging time of 14 to 20 min. After 2 to 5 min of imaging under baseline conditions (; ), (a) 4 min of hypercarbia (; ) followed by 5 min hyperoxia (; ); (b) 5 min of hyperoxia (; ) followed by 2 min baseline and 4 min of hypercarbia (; ); (c) 4 min of hypoxia (; ) followed by 5 min hyperoxia (; ); and (d) 5 min hypercarbia and hyperoxia (; ) followed by hyperoxia (; ) were set as target goals for arterial blood and . All four of these sequences were completed after targeting the baseline and values for 2 to 5 min. During the baseline measurement period, the normal breast Hb remained constant. Following the end-tidal and/or increases to highs of 45 and/or 500 mmHg, respectively, Hb decreased gradually with different rates resulting from the different inspired gas manipulating sequences. The total changes in Hb were 14, 13, 5, and 21%, respectively. These results are shown in Fig. 5(d), which used the same sequence as in Fig. 4(b), but the exam was carried out 105 days after the first session. The largest normal breast Hb change (21%) was induced by hypercarbia and hyperoxia followed by periods of hyperoxia [Figs. 4(b) and 5(d) versus Fig. 5(a) through 5(c)]. The variation between Hb curves shown in Figs. 4(b) and 5(d) is less than 0.2%. Fig. 5Dynamic Hb changes in a breast during four different gas sequences. After 2 to 5 min of baseline (; ) imaging, (a) 4 min of hypercarbia (; ) followed by 5 min of hyperoxia (; ); (b) 5 min of hyperoxia (; ) followed by 2 min of baseline and 4 min of hypercarbia (; ); (c) 4 min of hypoxia (; ) followed by 5 min of hyperoxia (; ); and (d) 5 min of hypercarbia and hyperoxia (; ) followed by period of hyperoxia (; ). Left vertical axes show Hb while right vertical axes represent one tenth of and . Dashed and solid lines correspond to end-tidal and values, and the circles are the imaged Hb values at different times.  Three patients undergoing NAC for locally advanced breast cancer were enrolled in this imaging study. One patient withdrew in the first imaging session because of discomfort stemming from the scent of the facemask. For another cancer patient, the signal-to-noise ratio of the optical signal was not sufficiently high for the imaging processing due to high breast density and diameter (plane diameter is ). Figure 6 depicts representative NIRS images and dynamic changes in a patient who ultimately showed a pathological complete response (pCR) to therapy. This 44-year-old woman had two invasive ductal carcinoma masses in the upper central portion of her right breast at 11:00 and 1:00 o’clock en face with sizes and , respectively. The chemotherapy regimen consisted of four cycles paclitaxel/trastuzumab which were given weekly for 16 weeks. Figure 6(a) contains static NIRS images of the abnormal breast at three time points during treatment. Arrows in images indicate the tumors. The tumor was visible in the concentration image at cycle 1, day 5 (C1, D5), almost disappeared at (C1, D28), and was not observable after NAC. No significant change in tumor area was observed in either or Hb images during NAC. Figure 6(b) shows the dynamic (left), Hb (middle), and (right) changes quantified in the known tumor regions at the 11:00 (red triangles) and 1:00 (pink squares) clock-face positions relative to surrounding normal tissue (dark blue crosses), at (C1, D5) (top), (C1, D28) (middle), and post NAC (bottom). The size and the location of the region of interest were defined according to the radiologist assessment of the magnetic resonance images taken before beginning the treatment. Dashed and solid lines show the directly measured and values. Similar to the results shown in the normal breast [Fig. 4(c)], in the tumor regions does not present clear changes following and alterations in the patient’s inspired air. However, the absolute values of in the tumor regions were reduced after the first NAC infusion and reached levels similar to the normal surrounding tissue by the end of treatment. Additionally, Hb in the tumor regions did not follow the blood gas changes at (C1, D5). However, it started to follow the arterial blood gas manipulations at (C1, D28) and a trend similar to that shown in Figs. 4 and 5 was observed after the completion of NAC. Compared to the absolute values of in the surrounding normal tissue estimated from the images obtained at (C1, D5), in one tumor region was higher (pink squares) but was lower (red triangles) in the other tumor region. Nonetheless, in both tumor regions followed trends similar to that in and changes found in the normal breast [Fig. 4(a)]. Indeed, the relative changes from the inspired gas manipulation increased gradually toward the end of the treatment. The variations of , Hb, and over the region of interest were less than , , and , respectively. The maximum tumor dynamic changes in Hb increased from less than 7% at (C1, D5) to 17% at (C1, D28) and eventually reached 24% after treatment. The postsurgical pathology confirmed a complete pathological response. Fig. 6Representative NIRS images and dynamic changes in a pCR patient undergoing NAC. Arrows in images indicate the tumors. (a) Static NIRS images of the abnormal breast at three time points during treatment. (b) Dynamic (left), Hb (middle), and (right) changes in tumors at 11:00 (red triangles) and 1:00 (pink squares) o’clock en face and the surrounding normal tissue (dark blue crosses) at (C1, D5) (top), (C1, D28) (middle), and post-treatment (bottom). Dashed and solid lines show measured and values inferred from the measured expired-air gas concentrations. 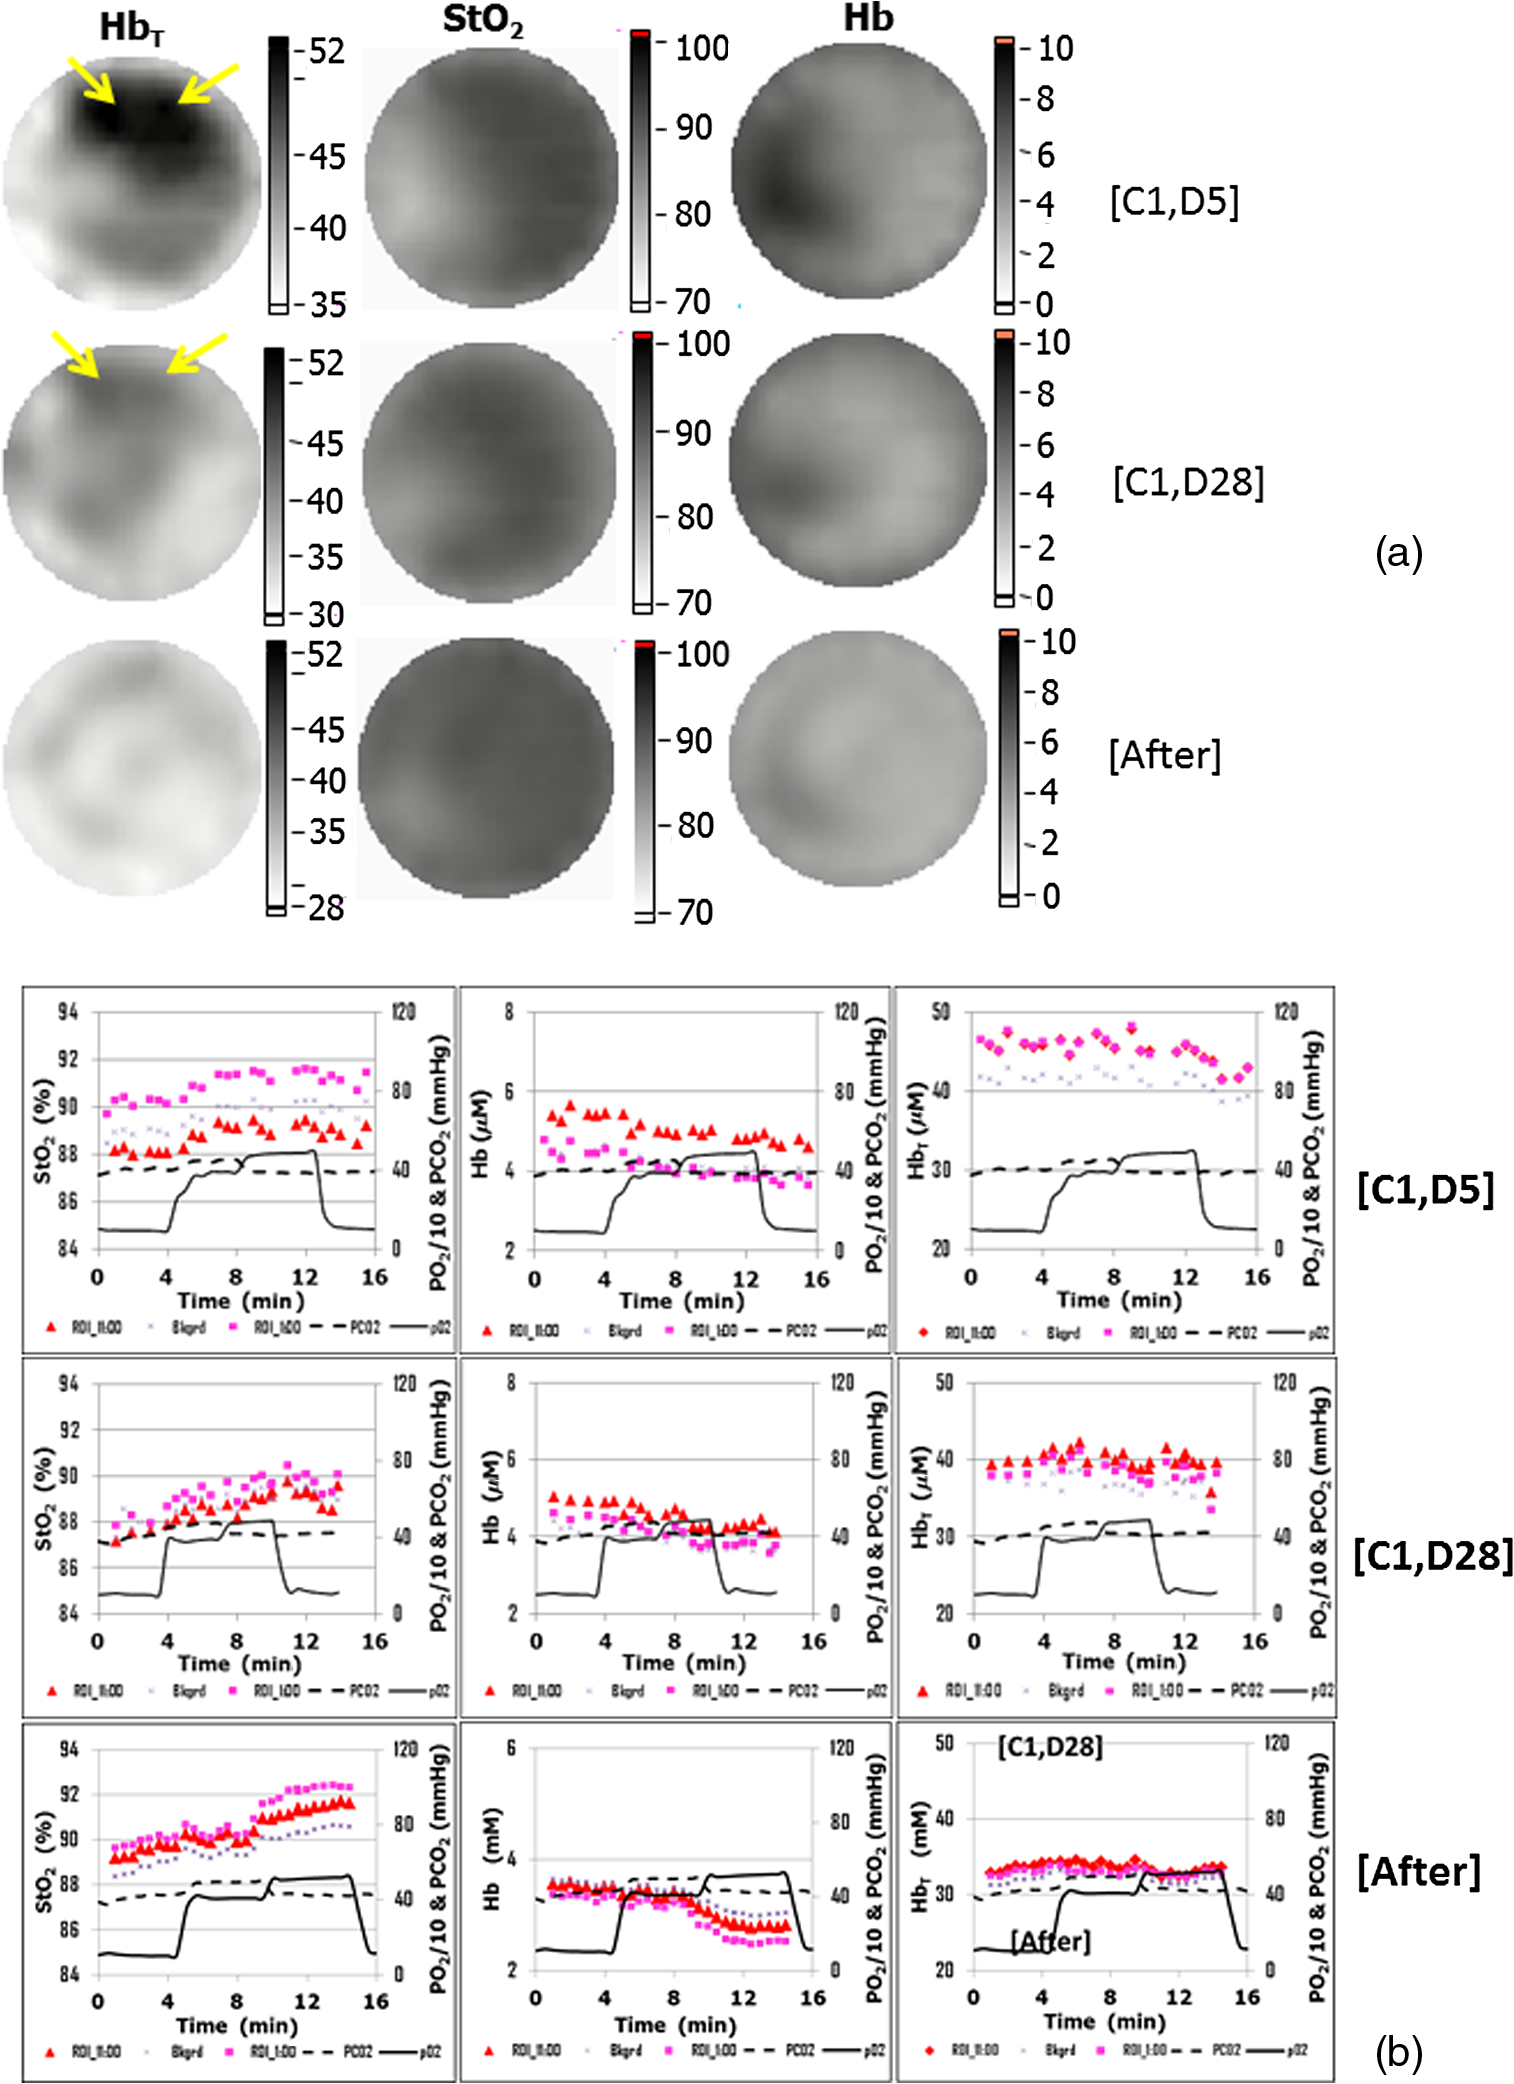 4.DiscussionThe static NIRS images in Fig. 6(a) were insensitive to prepost treatment effects, but may not reflect tumor hypoxia because the vascular supply may be too distant from areas of hypoxia.7 To overcome this limitation, we developed a dynamic NIRS tomography system to image the breast during changes in inspired gas concentrations to amplify the effects caused by tissue vascular supply. Since increases in arterial blood and cause vasoconstriction and vasodilation in tumors, respectively, interpretation of these dynamic responses would be significantly improved if arterial blood and were known. Fortunately, these quantities can not only be tracked but also be prospectively maintained with an automated computer-controlled gas blender. While end-tidal , , and minute ventilation are commonly linked, this system applies the method described by Slessarev et al.16 to target independent values of inspired end-tidal and gas and minute ventilation. As opposed to otherwise administering inhaled gas mixtures (where a poor relationship exists between the exhaled gas concentrations and those in the blood),11–15 end-tidal (i.e., exhaled gas) partial pressures were controlled, and these quantities have been shown to be surrogates for those in the arterial blood (allowing the arterial blood partial pressure to be monitored and controlled during NIRS imaging for the first time). The results in Figs. 3 through 6 indicate that manipulating the arterial blood and independently is likely to optimize the tissue oxygenation measured by NIRS. In addition, the variations of only 0.2% in the Hb changes that occurred during two exams, which were conducted on different days [Figs. 4(b) and 5(d)], suggests that the approach used in this study has significant potential to provide the stable arterial blood gas manipulation necessary for achieving repeatable, dynamic tissue oxygenation imaging. Theoretically, and Hb should return to their baseline values after and are similarly returned to baseline. However, in the results shown in Figs. 3 through 6, and Hb are kept constant either at the highest () or lowest (Hb) values during the last recovering period. This trend was observed during every gas manipulating sequence for each subject. To validate that the changes in and Hb were due to arterial blood gas manipulations, the baseline images acquired under baseline and were recorded for 20 min after the last gas sequence was completed in the normal subjects. The baseline and Hb from these later images indicate that the data variation at the end of the imaging exam was caused by the very slow recovery process after arterial blood gas manipulation. Although we observed this trend in all our normal and cancer subjects, the reason is still unclear physiologically. It may due to the compensation of the vasoconstriction and vasodilation in breast or tumor, but at this early pilot phase, it is hard to discern mechanisms underlying this subtle change in baseline. Nonetheless, the changes in and Hb during the first three gas manipulation periods provide important information on the dynamics of blood supply in response to subject-controlled arterial blood gas changes. In future studies, reductions in imaging time will allow us to eliminate the final recovery period. In Fig. 4, as expected, did not change significantly during the arterial blood gas manipulation because blood vessel vasoconstriction and vasodilation mainly influence blood oxygenation but not blood volume. This result may indicate that the arterial blood gas manipulation approach can more clearly link tumor response to antihypoxia-directed therapies than static NIRS imaging methods, because it can separate tumor hypoxia from blood volume change. Originally, we expected to obtain a larger change during arterial blood gas manipulation. However, larger percentage Hb changes have been observed in both normal (Fig. 4) and cancerous [Fig. 6(b)] breasts. Considering the results we obtained in our previous study without feedback control of the inspired gas mixture based on end-tidal measurements,11,14 this outcome may be due to changes involving both Hb and HbO, but with some phase delay between the Hb and HbO alterations. In Fig. 6(b), changes in Hb in both tumor regions resulting from arterial blood gas manipulation gradually increased during NAC and reached after NAC in the pCR case presented, which may be due to the decreasing ability of tumor vessels to vasoconstrict and vasodilate compared with their counterparts in the normal breast. Consider that the absolute and Hb values in the two tumor regions presented different trends relative to the surrounding normal tissue at (C1, D5) and at (C1, D28); yet, both tumors were found to have pathological complete responses after NAC, the percent change in and Hb under arterial blood gas manipulation may be the better predicators of tumor response to NAC. 5.ConclusionBased on blood vessel vasoconstriction and vasodilation expected in tumors from increases in arterial blood and , tumor imaging during manipulation of both arterial blood and would allow a direct assessment of tumor aggressiveness and resistance to NAC. In this pilot series of clinical exams, dynamic NIRS imaging was performed in the normal breast and the cancer-bearing breast undergoing NAC, during consistent stimulation created by controlling the subject’s inspired gas concentration based on monitoring the expired gas concentrations. A specialized sequencer and breathing circuit were applied to target prospectively and sustain independently end-tidal and . Dynamic vascular changes in the breast were imaged by a frequency-domain NIRS tomographic system with 30-s time resolution. By analyzing the resulting images from subjects with asymptomatic mammography under different arterial blood and manipulation sequences, the best sequences for maximizing tissue vascular and oxygenation changes were found. Results from a particular normal subject show maximum changes in Hb, , and of 21, 9, and 3%, respectively. By using the same manipulation sequence, three cancer patients undergoing NAC have been imaged at different time points during the course of treatment. In a representative case of a complete responder, the induced changes indicative of response in Hb, , and of two invasive ductal carcinoma masses in the same breast were observed early during treatment. AcknowledgmentsThis work has been sponsored by National Institute of Health grants R21CA135303 and PO1CA80139. ReferencesM. Pelleret al.,
“Oxygen-induced MR signal changes in murine tumors,”
Magn. Reson. Imag., 16
(7), 799
–809
(1998). http://dx.doi.org/10.1016/S0730-725X(98)00076-9 MRIMDQ 0730-725X Google Scholar
C. BaudeletB. Gallez,
“Current issues in the utility of blood oxygen level dependent MRI for the assessment of modulations in tumor oxygenation,”
Curr. Med. Imag. Rev., 1
(3), 229
–243
(2005). http://dx.doi.org/10.2174/157340505774574754 CMIRCV 1573-4056 Google Scholar
A. M. Shannonet al.,
“Tumour hypoxia, chemotherapeutic resistance and hypoxia-related therapies,”
Cancer Treat. Rev., 29 297
–307
(2003). http://dx.doi.org/10.1016/S0305-7372(03)00003-3 CTREDJ 0305-7372 Google Scholar
A. Padhani,
“Science to practice: what does MR oxygenation imaging tell us about human breast cancer hypoxia?,”
Radiology, 254
(1), 1
–3
(2010). http://dx.doi.org/10.1148/radiol.091669 RADLAX 0033-8419 Google Scholar
D. W. Dietzet al.,
“Tumor hypoxia detected by positron emission tomography with 60Cu-ATSM as a predictor of response and survival in patients undergoing neoadjuvant chemoradiotherapy for rectal carcinoma: a pilot study,”
Dis. Colon Rectum, 51 1641
–1648
(2008). http://dx.doi.org/10.1007/s10350-008-9420-3 CMIRCV 1573-4056 Google Scholar
C. B. Westburyet al.,
“Hypoxia can be detected in irradiated normal human tissue: a study using the hypoxic marker pimonidazole hydrochloride,”
Br. J. Radiol., 80 934
–938
(2007). http://dx.doi.org/10.1259/bjr/25046649 BJRAAP 0007-1285 Google Scholar
P. J. Hoskinet al.,
“Hypoxia in prostate cancer: correlation of BOLD-MRI with pimonidazole immunohistochemistry—initial observation,”
Int. J. Radiat. Oncol. Biol. Phys., 68
(4), 1065
–1071
(2007). http://dx.doi.org/10.1016/j.ijrobp.2007.01.018 IOBPD3 0360-3016 Google Scholar
S. Jianget al.,
“Evaluating tumor response to neoadjuvant chemotherapy with diffuse optical spectroscopic tomography: case studies of tumor region of interest changes,”
Radiology, 252
(2), 551
–560
(2009). http://dx.doi.org/10.1148/radiol.2522081202 RADLAX 0033-8419 Google Scholar
Y. Guet al.,
“Dynamic response of breast tumor oxygenation to hyperoxic respiratory challenge monitored with three oxygen-sensitive parameters,”
Appl. Opt., 42
(16), 2960
–2967
(2003). http://dx.doi.org/10.1364/AO.42.002960 APOPAI 0003-6935 Google Scholar
K. T. Kotzet al.,
“Inspiratory contrast for in vivo optical imaging,”
Opt. Express, 16
(1), 19
–31
(2008). http://dx.doi.org/10.1364/OE.16.000019 OPEXFF 1094-4087 Google Scholar
C. M. Carpenteret al.,
“Inspired gas induced vascular change in tumors with MR-guided near-infrared imaging: a human breast pilot study,”
J. Biomed. Opt., 15
(3), 036026
(2010). http://dx.doi.org/10.1117/1.3430729 JBOPFO 1083-3668 Google Scholar
R. Rakow-PennerB. L. DanielG. H. Glover,
“Detecting blood oxygen level-dependent (BOLD) contrast in the breast,”
J. Magn. Reson. Imag., 32 120
–129
(2010). http://dx.doi.org/10.1002/jmri.v32:1 1053-1807 Google Scholar
R. Alonziet al.,
“Carbogen breathing increases prostate cancer oxygenation: a translational MRI study in murine xenografts and humans,”
Br. J. Cancer, 100 644
–648
(2009). http://dx.doi.org/10.1038/sj.bjc.6604903 BJCAAI 0007-0920 Google Scholar
C. M. Carpenteret al.,
“Monitoring of hemodynamic changes induced in the healthy breast through inspired gas stimuli with MR guided diffuse optical imaging,”
Med. Phys., 37
(4), 1638
–1646
(2010). http://dx.doi.org/10.1118/1.3358123 MPHYA6 0094-2405 Google Scholar
M. J. Brischettoet al.,
“Effect of aging on ventilatory response to exercise and ,”
J. Appl. Physiol., 56
(5), 1143
–1150
(1984). JAPYAA 0021-8987 Google Scholar
M. Slessarevet al.,
“Prospective targeting and control of end-tidal and concentrations,”
J. Physiol., 581
(3), 1207
–1219
(2007). http://dx.doi.org/10.1113/jphysiol.2007.129395 JPHYA7 0022-3751 Google Scholar
S. Jianget al.,
“Measurement of pressure-displacement kinetics of hemoglobin in normal breast tissue with near-infrared spectral imaging,”
Appl. Opt., 48
(10), D130
–D136
(2009). http://dx.doi.org/10.1364/AO.48.00D130 APOPAI 0003-6935 Google Scholar
S. Srinivasanet al.,
“Spectrally constrained chromophore and scattering near-infrared tomography provides quantitative and robust reconstruction,”
Appl. Opt., 44
(10), 1858
–1869
(2005). http://dx.doi.org/10.1364/AO.44.001858 APOPAI 0003-6935 Google Scholar
|


