|
|
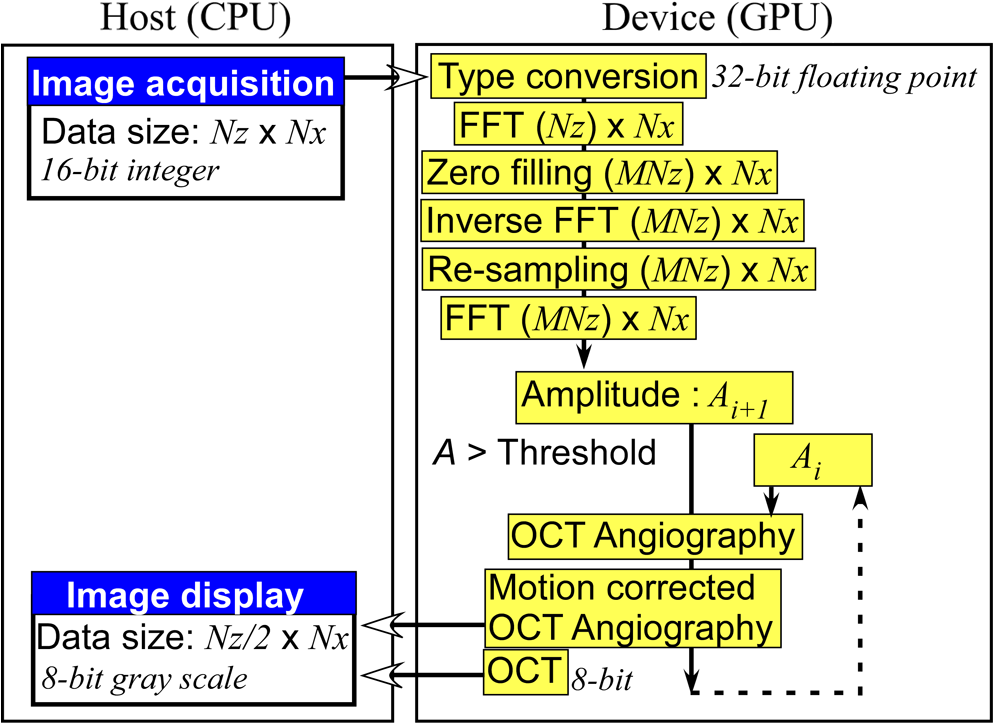
1.IntroductionOptical coherence tomography (OCT) is a noncontact, noninvasive imaging modality that can provide high-resolution, depth-resolved imaging of internal microstructures within the tissue.1 The development of Fourier domain optical coherence tomography, which provides markedly increased imaging speeds and high sensitivity,2,3 has enabled in vivo imaging of blood flow. Recent technological advances in OCT-based flow imaging techniques can be grouped into two categories: Doppler OCT and OCT angiography. Phase-resolved Doppler OCT uses the phase difference between adjacent A-lines to extract the Doppler frequency shift and quantitative information, such as blood flow speed and direction.4–8 The power of Doppler shift images and phase variance images can be used to construct OCT angiograms for vasculature visualization.9,10 For bulk-tissue-motion (BTM) on the order of a wavelength, which is much smaller than the axial resolution, the effect of motion appears as a phase shift. A number of methods for bulk-phase correction have been proposed.7,10 Intensity-based (IB) methods of imaging blood vessels have been proposed.11–17 These methods are insensitive to bulk-phase changes, and therefore, do not require bulk-motion phase correction.14 Interframe (IF) flow-imaging techniques have been used to detect microvasculature.12,13,15–17 IF speckle variance images were calculated across three structural OCT images of nude mice.12 The vasculature network in human skin was imaged using a four-frame IF-IB Doppler variance (DV) method.16 As the number of frames increases, the signal-to-noise ratio (SNR) improves; however, this approach also increases the sensitivity of these methods to bulk motion (on the order of a pixel). Therefore, IF methods are suitable for imaging fixed samples, or for use with higher frame rates; otherwise, the method requires BTM correction on the order of a pixel. Real-time display of tissue structure and flow information is always desirable for clinical applications that require immediate diagnosis for screening or biopsy/surgery. Our group and others have demonstrated real-time processes and the display of structural OCT images using a graphics processing unit (GPU).18–23 The GPU has many processors that provide highly parallel computing at a low cost, with the advantage of simple programming on a host computer. GPU processing is capable of displaying both structural OCT and Doppler OCT images in real time (e.g., Doppler OCT using the Kasai autocorrelation algorithm,24 speckle variance with BTM correction,25 and phase-resolved four-dimensional Doppler OCT26). In this paper, we demonstrated GPU-accelerated IB-OCT angiography, using two sequential frames with a simple BTM correction. The squared difference between two sequential amplitudes of the OCT images was used to minimize motion artifacts. We chose the BTM-corrected image that minimized the sum of the pixel values, from a total of 25 calculated OCT angiographic images, using axial- and lateral-pixel–shifted structural OCT images. A GPU processing rate of more than exceeded the line rate of the camera (46.9 kHz). Thus, our OCT system could display structural OCT images and BTM-corrected OCT angiography in real time. 2.Experimental SetupFigure 1 shows a schematic diagram of our FD-OCT system. A superluminescent diode (central wavelength: 1330 nm; spectral bandwidth: 58 nm) was used to illuminate the system. A polarization-independent fiber isolator was placed immediately after the light source to avoid light reflection into the source. The light was split into sample and reference beams, with the latter being terminated by a mirror using a fiber coupler. Achromatic lenses () were inserted into both beam trajectories to compensate for the dispersion mismatch. Light returning from the reference mirror and sample were recombined in the fiber coupler. The output interference spectra were detected by a custom-built spectrometer, comprising a 35-mm focal-length achromatic collimating lens, a 1145-lines/mm transmission grating (Wasatch Photonics, Logan, Utah), and a 100-mm focal-length achromatic lens. The spectra were focused onto a line-scan InGaAs camera (Goodrich-Sensors Unlimited, 1024 pixels, 14-bit resolution) operated at 46.9 kHz. The camera output was fed to a personal computer (PC) via a low-cost camera-link board (National Instruments, Austin, Texas, PCI-1426, 16-bit resolution). Fig. 1Schematic of spectral domain optical coherence tomography. SLD, superluminescent diode; OI, optical isolator; L, achromatic lens; ND filter, neutral density filter; PC, polarization controller; DG, diffraction grating.  Signal processing was performed using a graphics card (NVidia, Santa Clara, California, GeForce GTX680, 1006-MHz processor clock, 1536 stream processors, and 2048 Mbytes GDDR5 memory). This graphics card was connected to the host computer via a PCI-Express interface, which had twice the data transfer rate compared with the previous work.20 We used NVidia’s compute unified device architecture (CUDA) Version 4.2,27 which could be programmed in C language to exploit the processing power of the GPUs. We developed software that included image acquisition, GPU programming, and a graphical user interface environment in the Microsoft Visual C++2008 Express Edition. 3.OCT Angiography Using a GPUMultiple frames–based OCT angiography is susceptible to BTM and requires an increase in the number of acquired frames to improve the SNR. To minimize motion artifacts, we used two sequential frames and averaged the amplitudes in both the lateral and depth directions. The algorithm that we developed for this purpose is given below by Eq. (1): where is the amplitude of the OCT image and , , and are indices for the frame, transverse, and depth pixels, respectively. is the number of averaged depth pixels and is the number of averaged A-lines. Pixel-shifted images were used to correct for BTM. This correction is accounted for in the modified version of Eq. (1), given below in Eq. (2): where and are the pixel translations of the lateral and depth directions, respectively. Because we could not predict the direction of tissue motion, we calculated the squared difference of two OCT images by changing and , to find the shift values that minimized the sum of the pixel values. Generally, larger and values for the averaging will increase image SNR; however, it also increases the computation time and results in a “blurring” and loss of smaller vessels. The larger and values for the image registration will increase the computation time. To display BTM-corrected OCT angiographic images in real time, the averaging procedure used and ; the parameters for image registration were and in this work.Figure 2 shows the flow chart for the GPU programming process. On the host PC, the captured spectral interference image (: : lateral points, 16 bit) was transferred to the memory on the GPU. The data transfer rate between the host PC and the GPU device was increased using GPU paged memory. On the GPU, the data type of the spectral interference signal was first converted from a 16-bit integer to a 32-bit complex floating-point and then the spectrum was subtracted by the averaged spectrum. Next, zero-filling interpolation was performed with a forward Fourier transform, zero padded to increase the data-array length 2-fold ().19 The data were then inverse Fourier transformed back to the spectral domain and linear interpolated into -space. Here, only the constant values of linear interpolation were transferred to the GPU memory. The real and imaginary parts of the complex data were set to the processed data and zero, respectively. Next, the -point FFT was executed for lateral points. An amplitude image with pixels was obtained. If this amplitude was larger than the threshold value that is 1 dB above the OCT intensity noise floor, then OCT angiography processing was performed using the previous amplitude of the OCT image. Because and were used for the BTM correction, a total of 25 OCT angiographic images were processed. The BTM-corrected OCT angiographic image had the smallest total of pixel values. This image and the log-scaled OCT image were transferred to the host computer memory and displayed on the monitor. To save data transfer time, the data were then converted from 32-bit floating-point numbers to an 8-bit gray scale. The amplitude OCT image used was then copied to the GPU memory for the next processing cycle. 4.Results and Discussion4.1.GPU Processing RateWe measured the 100 times average GPU time, which included data transfers to and from the GPU memory for a given number of -lines. The GPU processing line rates were then calculated using the number of -lines divided by the measured processing time, as shown in Fig. 3. Here, the processing of OCT angiography was carried out on only a 25% portion of the amplitude OCT image by a threshold. A GPU processing rate of exceeded the line rate of the camera used. Therefore, structural OCT and OCT angiography can be obtained in real time. Because the processing time on the GPU had a wide margin in terms of the frame interval time in our OCT system, it is possible to perform BTM correction with subpixel structural image registration. Fig. 3GPU processing rates of intensity-based OCT angiography using two frames with bulk-tissue-motion correction. 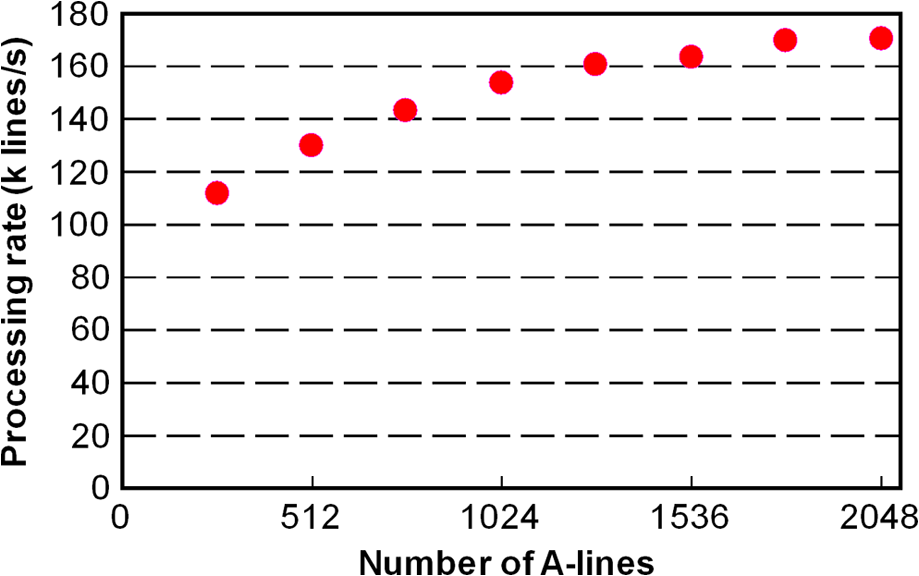 Figure 4 shows the processing time and data transfer time for input data of 1024 -lines, using a CUDA visual profiler.27 The sum of the data transfer time and the processing time associated with OCT angiography was 3.8 ms, which accounted for 73% of the total processing time (5.2 ms). Lee et. al. performed image registration using a partial region () of a structural OCT image ().25 If the position of the sample is known in the image, then the GPU processing time can be reduced by calculating the partial image registration and then the angiographic image in all regions. The data transfer time of one processed image (, 8 bit) was 42 μs, and accounted for only 1.9% of the frame acquisition time ( -lines). Recent developments in GPU-connected PCI-Express 3.0 interface technology allowed several images to be displayed in real time for multifunctional OCT techniques.28 Fig. 4Each processing time and data transfer time for input data of 1024 spectral size×1024 A-lines. memcpyHtoD and memcpyDtoH are data transfer to and from the GPU, respectively. OCTA is the processing of OCT angiography using Eq. (2). Min_kernel performs the selection of the image having the smallest total of pixel values. Copy_kernel is the copy procedure of the amplitude OCT image to use the next processing cycle.  4.2.In vivo imagingFirst, we obtained the OCT angiographic images without the BTM correction using two frames and multiple frames to clarify the influences of the BTM. As one of the multiple frames–based OCT angiography algorithms, we chose the IF-IBDV method16 in this work. It would be similar in results to other algorithms such as speckle variance. We measured the nail-fold region of a human finger in vivo at the same location using a scanning galvano mirror at 44 Hz. Figure 5(a) shows the resulting structural OCT images (). Here, the imaging range was . We calculated OCT angiographic images without BTM correction using Eq. (1), as shown in Fig. 5(b), 5(d), and 5(f). For comparison, Fig. 5(c), 5(e), and 5(g) show IF-IBDV images using four frames.16 When the sample was stable, both algorithms could be used to view the blood vessels [Fig. 5(b) and 5(c)]. When the sample moved, both images had high pixel values in the stationary tissue region [Fig. 5(d) and 5(e)]. Although the influence of this motion appeared in subsequent IF-IBDV images [Fig. 5(g)] because of frame averaging, we were able to minimize this motion in our OCT angiographic images [Fig. 5(e)]. Fig. 5(a) OCT images of a human finger nail-fold region. The imaging range was (). (b), (d), and (f) OCT angiography using two OCT images without BTM correction (c), (e), and (g) IF-IBDV image. NR, nail root; BV, blood vessel. 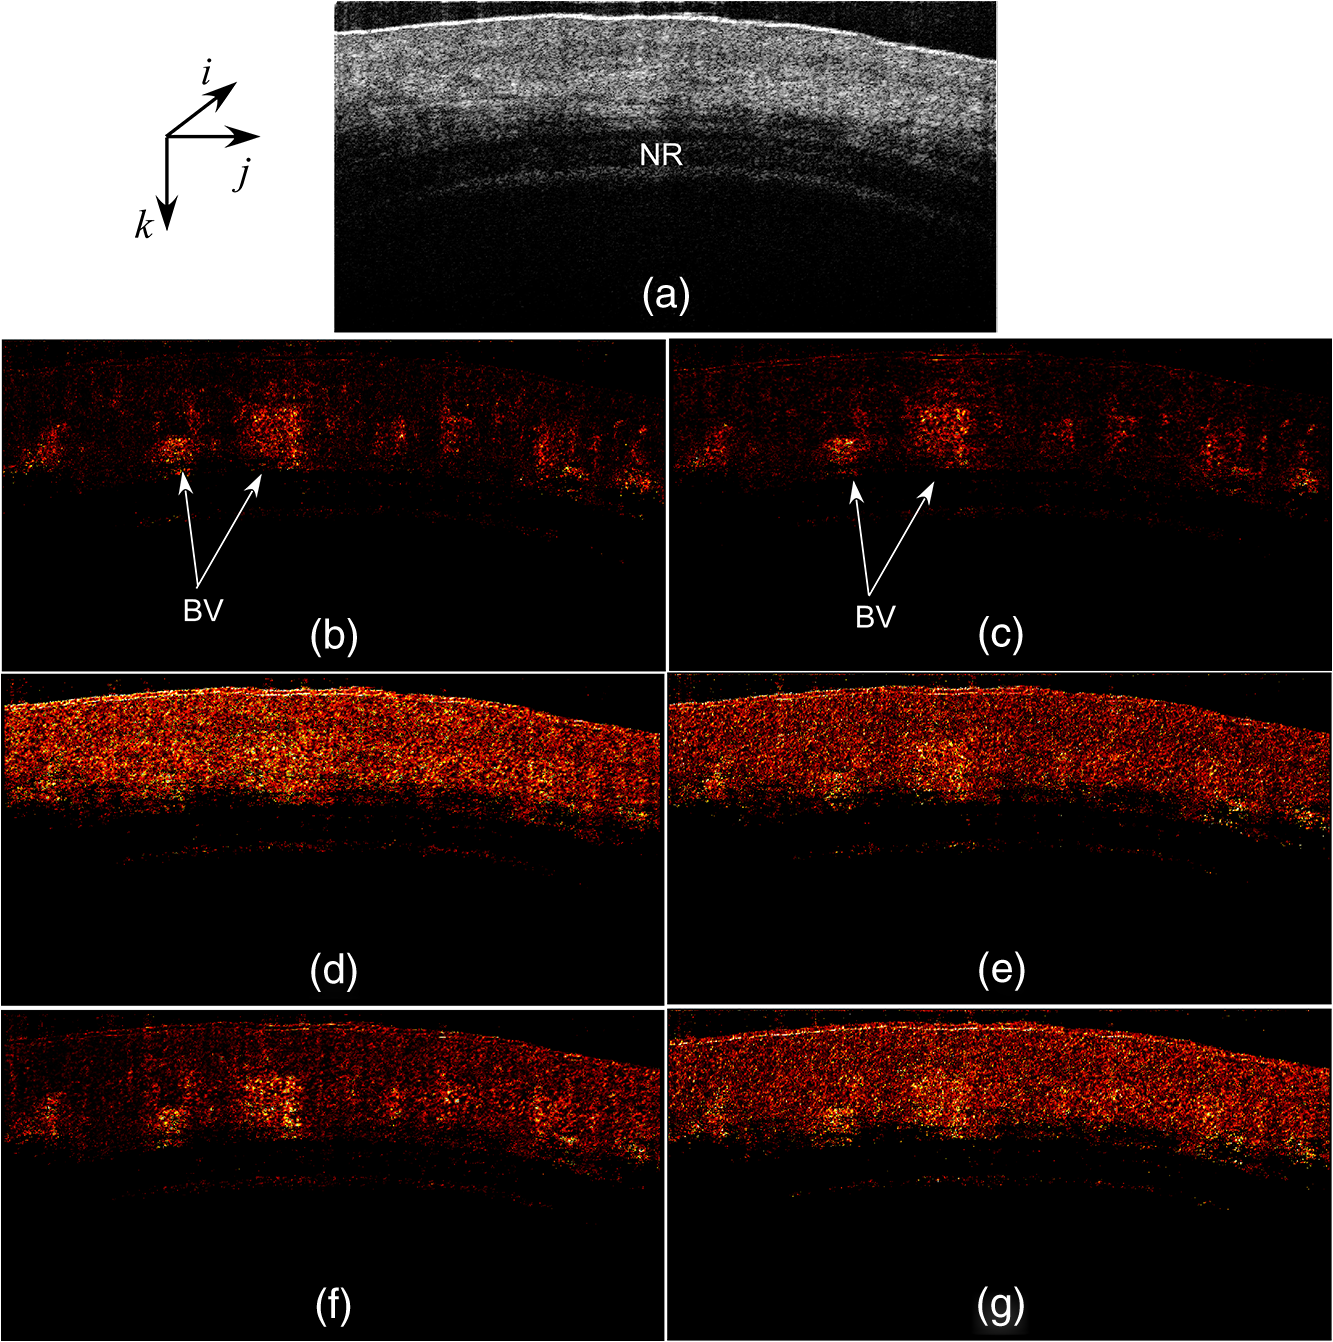 Next, we performed the correction on the order of a pixel to compensate the BTM. Figure 6 and Video 1 show the processed 25 OCT angiographic images from Eq. (2) to clarify the availability of the BTM correction. The solid square in Fig. 6 corresponds to the OCT angiogram in Fig. 5(d). When the lateral and depth pixel shifts were and , respectively, the total pixel values were minimized, and the blood vessels were identified (see the dashed square in Fig. 6). Therefore, the squared difference between two frames with BTM correction (on the order of a pixel) is effective for IF-OCT angiography. The video data (Video 1), which consist of 50 images, were shown at the display rate of 44 fps. In real-time processing mode, only the image having the smallest total of pixel values is transferred to the host computer memory. Fig. 6Processed 25 OCT angiographic images for BTM correction. Solid square corresponds to the OCT angiogram in Fig. 5(d). Dash square indicates BTM-corrected OCT angiography The video data, which consists of 50 images, was shown at the display rate of 44 fps (Video 1, QuickTime, 6.4 MB) [URL: http://dx.doi.org/10.1117/1.JBO.19.2.021105.1]..  Finally, we estimated three-dimensional (3-D) OCT angiographic images using two frames and multiple frames. We measured the 3-D OCT data set of a human nail-fold region by adding slow scanning. This volume of data consists of 1000 frames with 512 A-lines/frame, and approximately 11 s was required to capture the entire 3D-OCT data volume. The frame interval was 1.6 μm and the corresponding sampling density level was 13.125. Figure 7(a) and 7(b) show the structural OCT image and OCT angiographic image, respectively. The image size was (). Figure 7(c) and Video 2 show the maximum intensity projection (MIP) view and en face images of the 3D-OCT angiographic data set, respectively. The vasculature network can be clearly seen. Figure 7(d) shows the MIP image obtained from 3-D IF-IBDV images.16 The small blood vessels could not be identified due to frame averaging. To perform OCT angiography using multiple frames, the 3-D data set must be obtained by driving the slow-axis scanner with a multiple-step function, which allows several OCT images to be averaged at the same position.17 Moreover, all the frames required BTM correction on the order of a pixel. The speckle variance OCT angiography with a different BTM correction method using a different GPU has already been demonstrated.25 In our next work, we are planning to compare various IB-OCT angiography algorithms and BTM correction methods on a GPU. Fig. 7(a) OCT images of a human finger nail-fold region. The image size was . (b) OCT angiography, (c) MIP view and Video 2 en face images (QuickTime, 3.6 MB) [URL: http://dx.doi.org/10.1117/1.JBO.19.2.021105.2]. (d) MIP view from 3D IF-IBDV volume. NR, nail root; E, eponychium.  5.ConclusionWe demonstrated GPU-accelerated IB-OCT angiography by calculating the squared difference between two sequential frames with the simple BTM correction on the order of a pixel. Although the influence of a motion appeared in subsequent OCT angiographic images using multiple frames because of frame averaging, the two frames–based OCT angiography can reduce this influence. Our correction was performed by minimizing the sum of the pixel values using axial- and lateral-pixel–shifted structural OCT images. The BTM-corrected image was extracted from a total of 25 calculated OCT angiographic images. A GPU processing rate of more than was achieved, which exceeded the line rate of the camera (46.9 kHz). We demonstrated that our OCT system was capable of displaying structural OCT images and BTM-corrected OCT angiography in real time. ReferencesD. Huanget al.,
“Optical coherence tomography,”
Science, 254
(5035), 1178
–1181
(1991). http://dx.doi.org/10.1126/science.1957169 SCIEAS 0036-8075 Google Scholar
J. F. de Boeret al.,
“Improved signal-to-noise ratio in spectral-domain compared with time-domain optical coherence tomography,”
Opt. Lett., 28
(21), 2067
–2069
(2003). http://dx.doi.org/10.1364/OL.28.002067 OPLEDP 0146-9592 Google Scholar
R. A. LeitgebC. K. HitzenbergerA. F. Fercher,
“Performance of Fourier domain vs. time domain optical coherence tomography,”
Opt. Express, 11
(8), 889
–894
(2003). http://dx.doi.org/10.1364/OE.11.000889 OPEXFF 1094-4087 Google Scholar
Y. Zhaoet al.,
“Phase resolved optical coherence tomography and optical Doppler tomography for imaging blood flow in human skin with fast scanning speed and high velocity sensitivity,”
Opt. Lett., 25
(2), 114
–116
(2000). http://dx.doi.org/10.1364/OL.25.000114 OPLEDP 0146-9592 Google Scholar
V. X. D. Yanget al.,
“Improved phase-resolved optical Doppler tomography using the Kasai velocity estimator and histogram segmentation,”
Opt. Commun., 208
(4), 209
–214
(2002). http://dx.doi.org/10.1016/S0030-4018(02)01501-8 OPCOB8 0030-4018 Google Scholar
R. A. Leitgebet al.,
“Real-time assessment of retinal blood flow with ultrafast acquisition by color Doppler Fourier domain optical coherence tomography,”
Opt. Express, 11
(23), 3116
–3121
(2003). http://dx.doi.org/10.1364/OE.11.003116 OPEXFF 1094-4087 Google Scholar
B. R. Whiteet al.,
“In vivo dynamic human retinal blood flow imaging using ultra-high-speed spectral domain optical coherence tomography,”
Opt. Express, 11
(25), 3490
–3497
(2003). http://dx.doi.org/10.1364/OE.11.003490 OPEXFF 1094-4087 Google Scholar
B. Vakocet al.,
“Phase-resolved optical frequency domain imaging,”
Opt. Express, 13
(14), 5483
–5493
(2005). http://dx.doi.org/10.1364/OPEX.13.005483 OPEXFF 1094-4087 Google Scholar
Y. Zhaoet al.,
“Doppler standard deviation imaging for clinical monitoring of in vivo human skin blood flow,”
Opt. Lett., 25
(18), 1358
–1360
(2000). http://dx.doi.org/10.1364/OL.25.001358 OPLEDP 0146-9592 Google Scholar
S. Makitaet al.,
“Optical coherence angiography,”
Opt. Express, 14
(17), 7821
–7840
(2006). http://dx.doi.org/10.1364/OE.14.007821 OPEXFF 1094-4087 Google Scholar
R. K. Wanget al.,
“Three dimensional optical angiography,”
Opt. Express, 15
(7), 4083
–4097
(2007). http://dx.doi.org/10.1364/OE.15.004083 OPEXFF 1094-4087 Google Scholar
A. Mariampillaiet al.,
“Speckle variance detection of microvasculature using swept-source optical coherence tomography,”
Opt. Lett., 33
(13), 1530
–1532
(2008). http://dx.doi.org/10.1364/OL.33.001530 OPLEDP 0146-9592 Google Scholar
L. AnJ. QinR. K. Wang,
“Ultrahigh sensitive optical microangiography for in vivo imaging of microcirculations within human skin tissue beds,”
Opt. Express, 18
(8), 8220
–8228
(2010). http://dx.doi.org/10.1364/OE.18.008220 OPEXFF 1094-4087 Google Scholar
G. Liuet al.,
“Real-time bulk-motion-correction free Doppler variance optical coherence tomography for choroidal capillary vasculature imaging,”
Opt. Express, 19
(4), 3657
–3666
(2011). http://dx.doi.org/10.1364/OE.19.003657 OPEXFF 1094-4087 Google Scholar
E. JonathanJ. EnfieldM. J. Leahy,
“Correlation mapping method for generating microcirculation morphology from optical coherence tomography (OCT) intensity images,”
J. Biophoton., 4
(9), 583
–587
(2011). http://dx.doi.org/10.1002/jbio.201000103 JBOIBX 1864-063X Google Scholar
G. Liuet al.,
“High-resolution imaging of microvasculature in human skin in vivo with optical coherence tomography,”
Opt. Express, 20
(7), 7694
–7705
(2012). http://dx.doi.org/10.1364/OE.20.007694 OPEXFF 1094-4087 Google Scholar
C. Blatteret al.,
“Ultrahigh-speed non-invasive wide field angiography,”
J. Biomed. Opt., 17
(7), 070505
(2012). http://dx.doi.org/10.1117/1.JBO.17.7.070505 JBOPFO 1083-3668 Google Scholar
Y. WatanabeT. Itagaki,
“Real-time display on Fourier domain optical coherence tomography system using a graphics processing unit,”
J. Biomed. Opt., 14
(6), 060506
(2009). http://dx.doi.org/10.1117/1.3275463 JBOPFO 1083-3668 Google Scholar
Y. Watanabe,
“Real-time processing for full-range Fourier domain optical-coherence tomography with zero-filling interpolation using multiple graphic processing units,”
Appl. Opt., 49
(25), 4756
–4762
(2010). http://dx.doi.org/10.1364/AO.49.004756 APOPAI 0003-6935 Google Scholar
Y. Watanabe,
“Real time processing of Fourier domain optical coherence tomography with fixed-pattern noise removal by partial median subtraction using a graphics processing unit,”
J. Biomed. Opt., 17
(5), 050503
(2012). http://dx.doi.org/10.1117/1.JBO.17.5.050503 JBOPFO 1083-3668 Google Scholar
S. Van der JeughtA. BraduA. G. Podoleanu,
“Real-time resampling in Fourier domain optical coherence tomography using a graphics processing unit,”
J. Biomed. Opt., 15
(3), 030511
(2010). http://dx.doi.org/10.1117/1.3437078 JBOPFO 1083-3668 Google Scholar
K. ZhangJ. U. Kang,
“Real-time 4D signal processing and visualization using graphics processing unit on a regular nonlinear-k Fourier-domain OCT system,”
Opt. Express, 18
(11), 11772
–11784
(2010). http://dx.doi.org/10.1364/OE.18.011772 OPEXFF 1094-4087 Google Scholar
K. ZhangJ. U. Kang,
“Real-time intraoperative 4D full-range FD-OCT based on the dual graphics processing units architecture for microsurgery guidance,”
Biomed. Opt. Express, 2
(4), 764
–770
(2011). http://dx.doi.org/10.1364/BOE.2.000764 BOEICL 2156-7085 Google Scholar
H. Jeonget al.,
“Ultra-fast displaying spectral domain optical Doppler tomography system using a graphics processing unit,”
Sensors, 12
(12), 6920
–6929
(2012). http://dx.doi.org/10.3390/s120606920 SNSRES 0746-9462 Google Scholar
K. K. C. Leeet al.,
“Real-time speckle variance swept-source optical coherence tomography using a graphics processing unit,”
Biomed. Opt. Express, 3
(7), 1557
–1564
(2012). http://dx.doi.org/10.1364/BOE.3.001557 BOEICL 2156-7085 Google Scholar
Y. HuangX. LiuJ. U. Kang,
“Real-time 3D and 4D Fourier domain Doppler optical coherence tomography based on dual graphics processing units,”
Biomed. Opt. Express, 3
(9), 2162
–2174
(2012). http://dx.doi.org/10.1364/BOE.3.002162 BOEICL 2156-7085 Google Scholar
Y. Wanget al.,
“GPU accelerated real-time multi-functional spectral-domain optical coherence tomography system at 1300nm,”
Opt. Express, 20
(14), 14797
–14813
(2012). http://dx.doi.org/10.1364/OE.20.014797 OPEXFF 1094-4087 Google Scholar
|