|
|
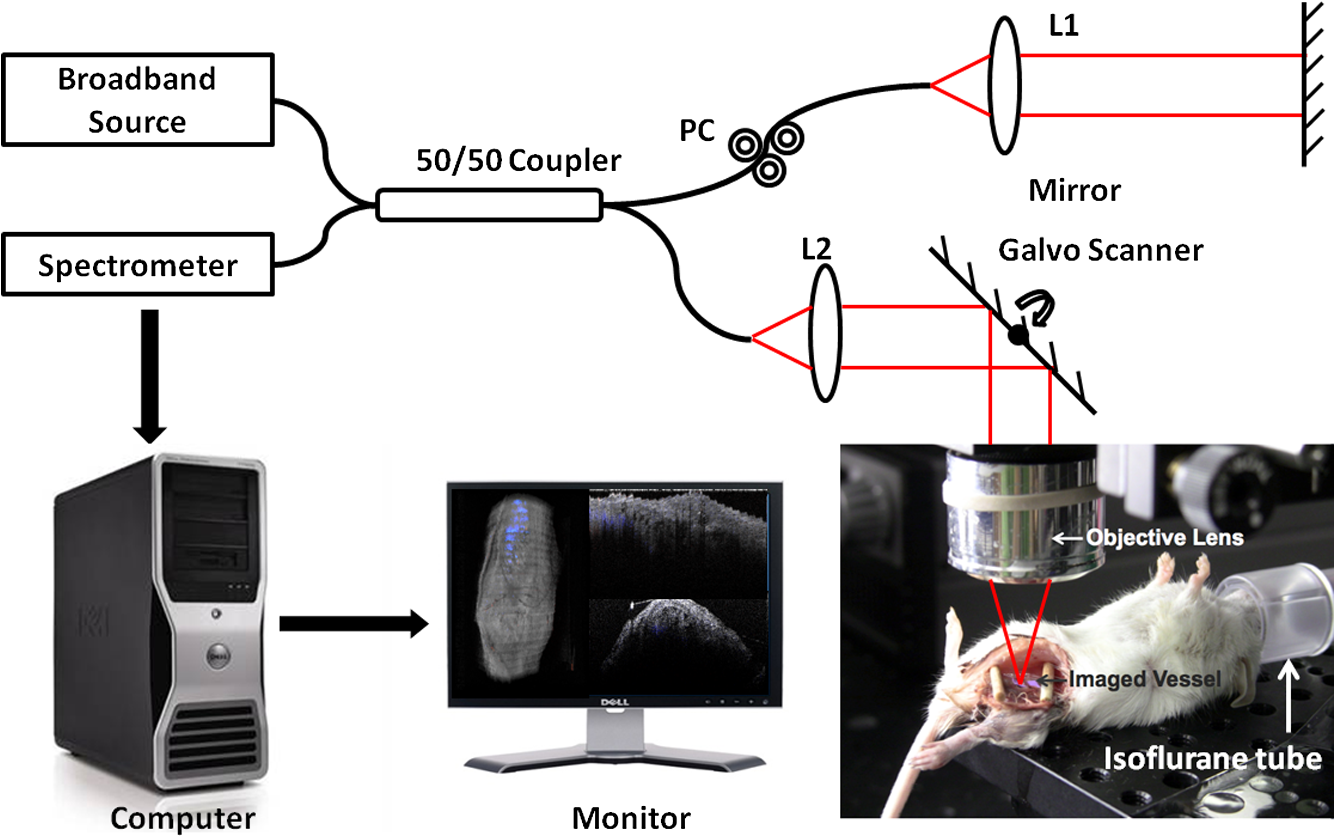
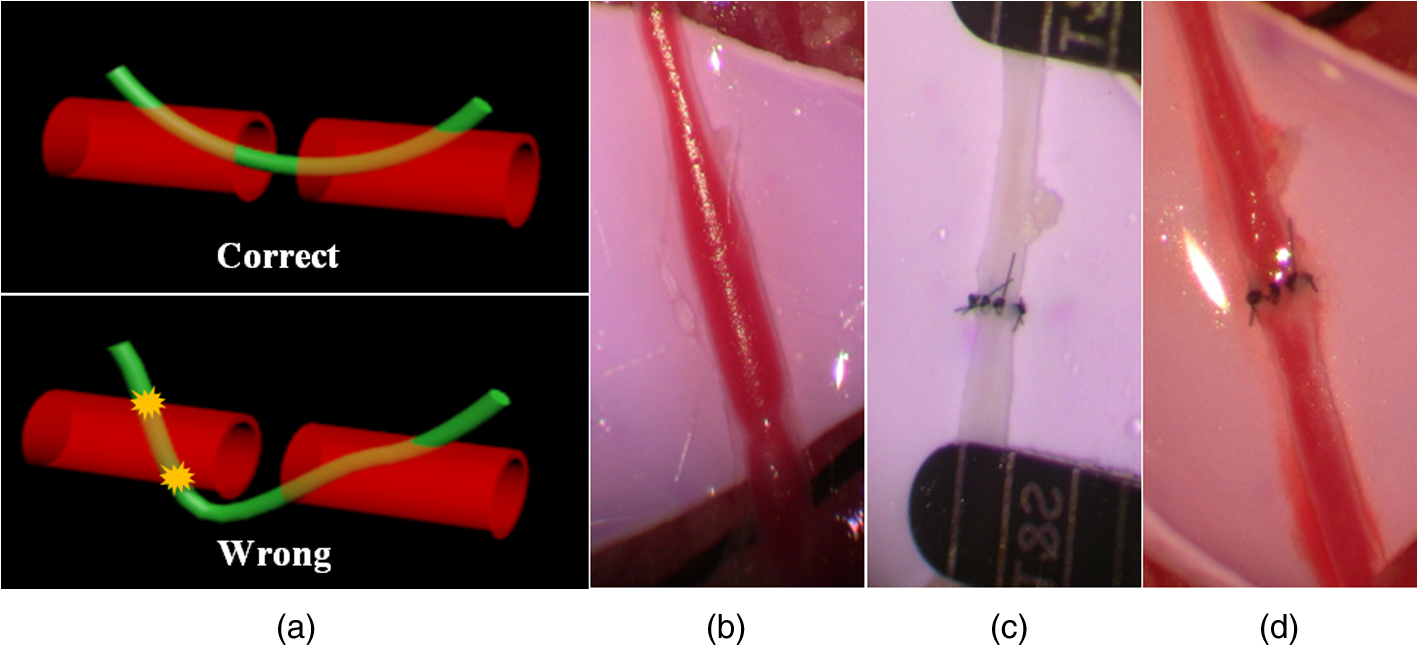
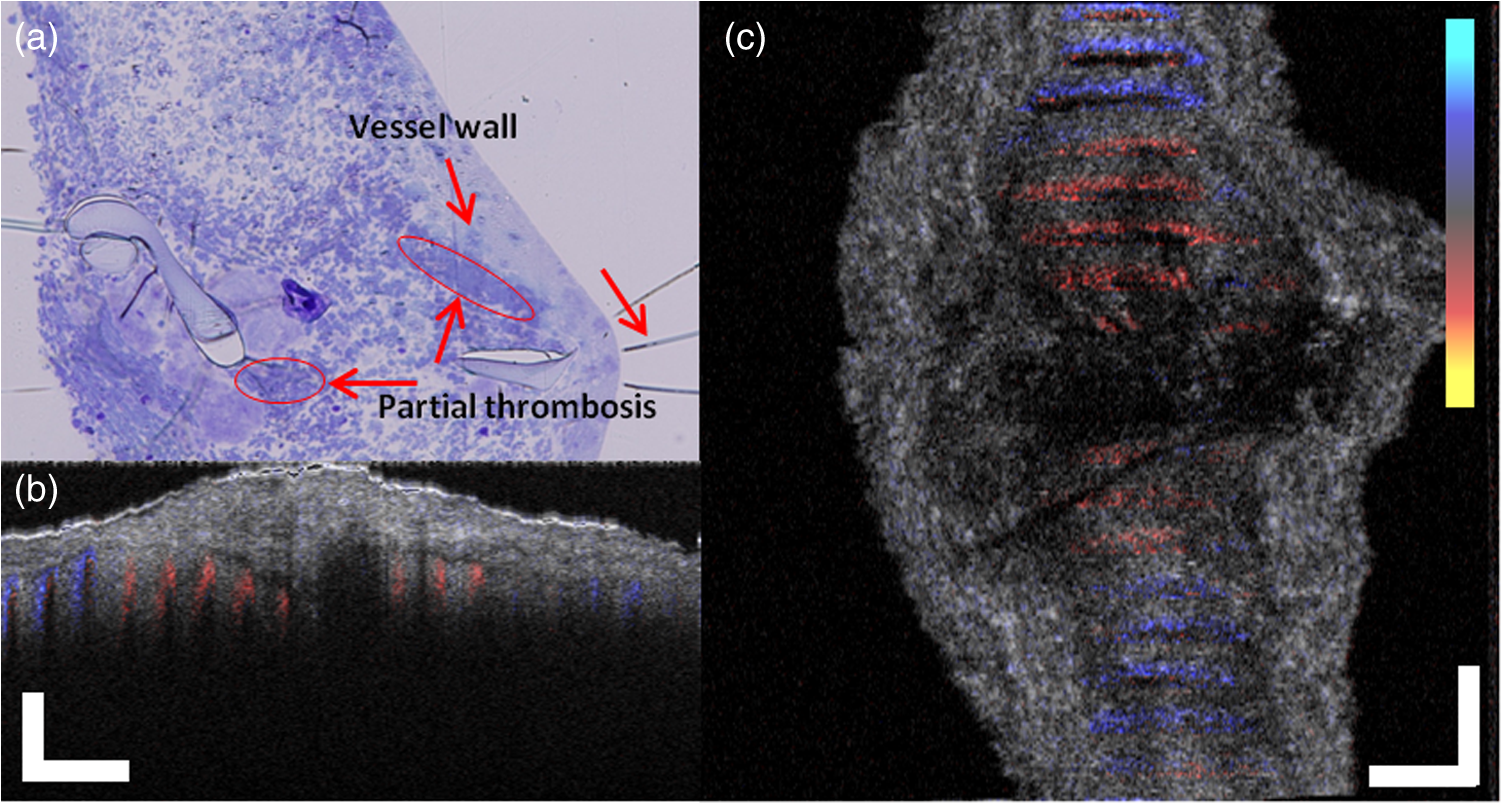
1.IntroductionVascular and microvascular anastomosis is considered to be the foundation of plastic and reconstructive surgery. In 1912 Alexis Carrel was awarded the Nobel Prize for describing a suture technique utilizing precise placement of sutures to connect the two ends of vessels together.1 This procedure has since remained a challenge for surgeons to master for nearly 100 years.2 Even in the era of high-quality, binocular surgical microscopes equipped with optics providing highly magnified images, this technique still requires the highest level of skill and surgical expertise—especially for small vessels (). Advancements in microvascular surgery have revolutionized the approach to reconstructive microsurgery.3 In the last two decades, innovative techniques such as vascular coupling devices,4 thermo-reversible poloxamers,2 and sutureless cuff techniques that can provide rapid vascular anastomosis5 have been introduced. However, no notable innovations in the field of surgical imaging have been developed that can provide real-time in-depth view, three-dimensional (3-D) guidance, and postoperative evaluation for microvascular surgery. Computed tomography (CT) angiograms, magnetic resonance (MR) angiograms, and ultrasound Doppler are three main postoperative diagnostic imaging modalities that surgeons resort to for vascular anastomosis.2 When it comes to microvascular surgery for vessel diameters and supermicrosurgery for vessel diameters , however, drawbacks of these imaging modalities—low spatial resolution, slow imaging speed, poor temporal resolution—inhibit their application.6 Attaching an implantable Doppler probe to the anastomosis site is a nonimaging method to detect thrombosis by listening to the flowing sound in the vessel. Although it can tell whether the flow continues, it cannot provide the surgeon with further thrombosis morphology detail.7 None of the above-mentioned methods is capable of performing real-time surgical guidance or assistance. Optical coherence tomography (OCT) is a well-established, noninvasive optical imaging technology that can provide high-speed, high-resolution, 3-D images of biological samples.8 Pioneer work by Boppart and colleagues in 1998 used OCT to perform intraoperative assessment of microsurgery.9 In this work, the 3-D OCT reconstructions depicted the structure within an arterial anastomosis and helped identify sites of lumen obstruction.9 Since then OCT has evolved from a time-domain system to the much faster Fourier-domain system. Functional OCT such as phase-resolved Doppler OCT (PRDOCT), developed two decades ago, has enabled high-resolution tissue structure and blood flow imaging.10 Furthermore, ultra-high-speed OCT data processing and image rendering based on graphics processing units enabled real-time four-dimensional OCT imaging.11–13 Previously, our pilot study with real-time 3-D OCT video intraoperative guidance14 was aimed at enabling depth perception, facilitating microsurgical education and improving surgical outcome through prompt diagnosis of potential intraoperative complications. Only one suture tie was made in that study. In this study real-time PRDOCT with simultaneous 3-D structure and flow imaging was introduced to microvascular anastomosis for mainly two purposes: intraoperative assistance to surgeons in avoiding detrimental technical errors and postoperative evaluation of surgical outcome in terms of detecting the flow status, lumen patency, and thrombus formation in the anastomosed vessels. Compared to previous video volume rate imaging speed (10 volumes per second), we reduced the speed to 0.27 volumes per second with increased image lateral resolution to better serve the need for accurate guidance of the suture. This imaging speed was also fast enough not to hinder the surgeon’s operation. We demonstrated the PRDOCT-assisted whole microvascular anastomosis procedure and postoperative evaluation case-by-case in a rodent model. 2.MethodsThe OCT imaging system configuration details, shown in Fig. 1, were the same as we described in our previous study.12 We used a line-scan camera (EM4, e2v, USA) with 12-bit depth and 2048 pixels as the spectrometer detector. We used a superluminescent diode light source with an output power of 10 mW and an effective bandwidth of 105 nm centered at 845 nm. The system ran at a 70-kHz line rate with an axial resolution of 3.0 μm in air and transversal resolution of . The detectable range of the velocity of flowing target projected to the parallel direction of the scanning beam was . Each B-scan image consisted of 1000 A-scans, and each C-scan consisted of 250 B-scans. The physical lateral image scanning range can be varied depending on the surgical site, which was usually limited within an area of 1.5 by . Simultaneous structure and flow volume rendering images were presented immediately after the acquisition. A separate Carl Zeiss surgical microscope with maximum optical power of was put aside and close to the OCT system, so that the rat could be easily transferred back and forth under two different systems. OCT systems can potentially be combined with the surgical microscope, which has already been demonstrated.15 Six- to eight-week-old inbred Lewis rats (Harlan) were anesthetized using isoflurane-based anesthesia system. Femoral (ID: 0.8 to 1 mm) and popliteal (ID: 0.4 to 0.6 mm) arteries were exposed through an anteromedial skin incision. After dissection using standard optical microscope, framed approximator clamps (S&T, Neuhausen, Switzerland) were applied. Vessel was divided with a microscissor and then shifted to the OCT platform. The anastomosis was performed using conventional interrupted 10-0 Nylon 6-8 sutures. In our preliminary experiments, the platform was rotated from optical microscope to OCT system after each suture placement. After revascularization, vessels were evaluated with PRDOCT for qualitative flow analysis and thrombus formation. Animal body temperature was maintained using a heating pad. Room temperature was kept between 70°F and 75°F in the operating room. A heating pad, however, was not used on the OCT platform but can be included in future studies. The animal study was conducted in accordance with the Johns Hopkins University Animal Care and Use Committee Guidelines. Either the left or right femoral artery of the limb was exposed through a surgical procedure, as shown in Fig. 2(b). A tiny plastic rubber sheet was placed underneath the vessel to isolate the vessel from surrounding soft tissue for better surgical operation and imaging. The microvascular anastomosis was performed on the same vessel after both the distal and proximal end of the anastomosed site were clamped and cut into two half ends. Sutures were placed in the collapsed vessel from adventitia through intima on one end, followed by suture placement from intima to adventitia on the other vessel end. Sutures were laid down flat and tightened, which approximated the intima, while the lumen was opened to allow placement of sutures. Sutures were then applied circumferentially for the anastomosis, making a complete seal to prevent leakage, as shown in Fig. 2(c). Finally, the clamp was removed and blood went through the vessel without leakage or thrombus within the vessel if the procedure succeeded, as shown in Fig. 2(d). Among all the circumferential sutures, usually from six to eight sutures should avoid accidentally going through both walls of one vessel, as shown in Fig. 2(a). Otherwise, following the suture-tying procedure will close the vessel lumen, which will cause direct failure of the surgery. 3.Results and DiscussionThe transparent nature of extremely thin vessels, as shown in Fig. 3(a), poses a challenge to the surgeon viewing the anterior and posterior vessel walls through an optical microscope, and the surgeon relies mainly on tactile stimuli. Hence, from a technical viewpoint, the risk of error increases toward the end of the procedure, when the maneuverability is limited due to the already-tied sutures. The risk can be proportionately higher in beginners with less experience. Figure 3 depicts the wrong suture placement during the procedure. For the first two sutures, the surgeon was confident about the correct placement; however, when it came to the third, fourth, and additional sutures, OCT imaging was introduced to check and confirm the precise suture position relative to the vessel walls before tying knots. The total OCT imaging time for all the sutures cost around 8 min due to the real-time image acquisition and processing, which added a marginal burden to the overall average time of 47 min without OCT imaging.2 As most of the 8 min was spent on transferring the animal back and forth and focusing on the area of interest, we would expect a much-reduced time cost when a future OCT system is integrated with a surgical microscope. Fig. 3(a) Surgical microscope view of the surgical site. (b) Top view volume rendering of the three-dimensional optical coherence tomography (OCT) image data corresponding to the red box in (a). (c) Selected numbered B-mode frames in the direction of the arrow in (b) out of the video (Video 1, sutures were marked in yellow circles on the image, scale bar: 200 μm, MOV, 520 KB) [URL: http://dx.doi.org/10.1117/1.JBO.18.11.111404.1]. 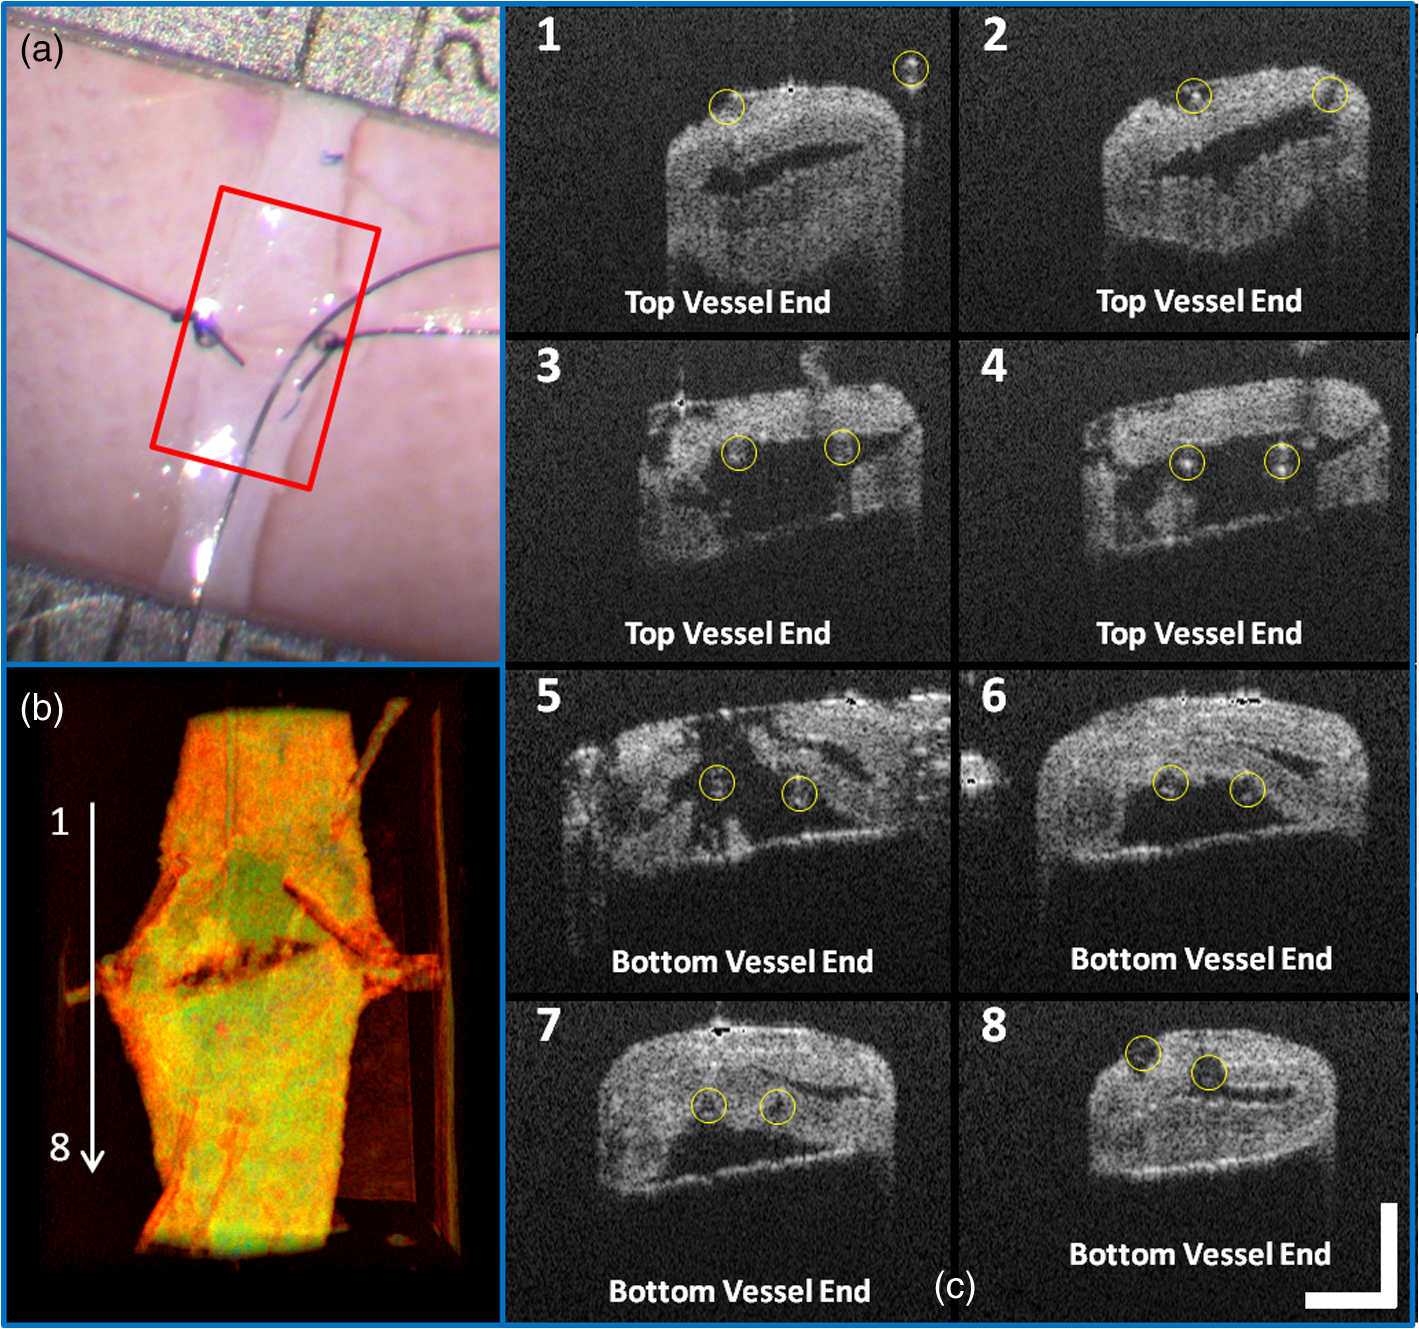 Figure 3(a) shows the surgical microscope view of a transparent vessel with two sutures tied and one suture going through both ends. After placing four sutures through both the proximal and distal cut ends, we imaged the red rectangular area marked in Fig. 3(a) using OCT. Figure 3(b) is the corresponding top-view volume rendering of the surgical site. We can clearly see the whole surgical site. First and second threads were intraluminal at the cut end. However, third and fourth sutures went through both anterior and posterior walls of the distal cut end of the vessel. It offered the surgeon a general scene of the surgical site. Figure 3(c) consists of eight cross-sectional B-mode frames marked in the direction of the white arrow in Fig. 3(b) selected from Video 1. Sutures were marked with yellow circles in Fig. 3(c). It demonstrates an example of technical error where an accidental back wall suture occludes the vessel lumen. We presented eight slices over the imaging volume to trace the sutures through both vessel walls. Slices 1 to 4 assure that sutures 3 and 4 went through the proximal vessel end accurately. However error was found when the sutures went through the distal cut-end of the vessel. Slice 5 demonstrates that the sutures went through the posterior vessel wall. Slice 6 depicts both sutures entering the posterior vessel wall while slice 7 indicates the moment that both sutures were inside the posterior wall. Finally, slice 8 shows both sutures were inside the anterior wall. These four slices assured the surgeon that the lumen would be occluded. The suture was lying within the adventitia of the posterior wall and could not be visualized through the optical microscope. This error was successfully detected by the OCT image and allowed the surgeon to redo the third and fourth sutures to successfully perform the anastomosis. Figure 4 (Video 2) represents accurate suture placement relative to the vessel walls. After confirming by the OCT imaging that there was no error, the surgeon continued to perform the rest of the sutures. Fig. 4Selected OCT sequential images showing the correct suture position relative to vessel walls (Video 2, sutures were marked by yellow circles on the image, scale bar: 200 μm, MOV, 724 KB) [URL: http://dx.doi.org/10.1117/1.JBO.18.11.111404.2].  The key parameter to determine the surgical outcome is whether the blood flow could be restored. Because the vessels are so delicate, endothelial injury, mal-positioned or partial thickness sutures can induce turbulence or thrombosis. If the thrombosis occludes the vessel lumen with no flow distally, all the previous steps have to be redone. But sometimes the thrombus formation is not immediate or the thrombus is not large enough to completely occlude the vessel. In such a situation, visual input from an optical microscope can deceivingly show flow restoration. Structure and Doppler flow information from the PRDOCT can help the surgeon evaluate the quality of flow restoration and early thrombus formation. We validated the thrombosis detection capability of our system through comparison with gold standard histology analysis. The thrombosis was induced using the solution model.16 Figure 5 shows the result. In naive group we can see clean and smooth inner lumen from the structure image and well-distributed Doppler signal inside the lumen. However, in partial thrombosis group, OCT image found structural irregularities along the inner vessel wall. Doppler signal also demonstrated flow alterations not coinciding with the luminal flow pattern of naive intact vessel. Finally in the full thrombosis group, Doppler signal completely disappeared. Besides Doppler signal, liquid blood can also be differentiated from solid thrombosis based on speckle size.17 Fig. 5Naive, partial, and full thrombosis imaging (left to right) correlation between histology (top row) and OCT (bottom row), scale bar: 200 μm.  We report two cases here. In the first case, the blood flow was not restored. The result is shown in Fig. 6. Figure 6(a) was a camera image of the vessel under microscope. Figure 6(b) was the structural and flow overlaid top-view volume rendering of the black box marked area in Fig. 6(a). There was no Doppler signal indicating blood flow. This tells the surgeon that the whole procedure needs to be re-done; however, with Fig. 6(a) only, it is really hard for the surgeon to know whether there is flow. Fig. 6(a) Surgical microscope view of the connected vessel with clamp removed. (b) Structural and flow overlaid top-view volume rendering of the area marked with black box in (a).  The second case was a successful microvascular anastomosis followed by a long-term study. For each subsequent analysis, skin incisions were reopened and closed using 4-0 Nylon interrupted sutures. Figure 7 shows the time-elapsed OCT imaging of the surgical site. From the naive state we can clearly visualize the normal healthy pulsation effect of the blood flow in the artery. The inner vessel lumen diameter measured from OCT images stays at the same level , except for day 2 when the vessel inner lumen diameter went up to 0.5 mm, which we suspect might be due to vasodilation. The junction area of two connected vessel ends immediately after the surgery was marked by day 0. Compared to Fig. 6, there was an obvious blood flow signal in all the Doppler images. At the junction area, densely distributed suture ties and connective tissue may limit the OCT image penetration depth into the vessel; thus, blood flow information was weak in the junction area. However, general flow distribution from the proximal to distal end of the anastomosed vessel could be viewed. From the flow image of day 0, we can see that the flow tunnel in the junction area was curved instead of being straight. This might not be a well-sutured vessel tunnel intuitively. However, no previous work has ever been able to resolve the anastomosed vessel flow distribution at such a high-resolution 3-D level. Detailed study will be performed in the future to study the effect of vessel tunnel shape and connectivity on the survival rate of microvascular anastomosis. The complicated and irregular inner lumen at the junction area will produce flow turbulence and make the flow change directions instead of being unidirectional, which explains the unusual red blood flow signal in the junction area; however, we do observe blood flow signal in the distal end, though weak compared to the proximal end. The blood flow was qualitatively better in the flow image on day 2 as the rat recovered gradually. Day 4 flow image shows that there was a partial thrombosis in the junction area and nearby, as there was still some evidence of flow. A week later the thrombus disappeared as seen in the flow image of day 11. The blood flow was comparable to a naive state, though there was still some narrowing and turbulence in the middle of the junction area. Figure 8, imaged on day 4, confirmed that the thrombosis was partial. Figure 8(a) through 8(c) were three orthogonal plane image slices showing the area of interest of the anastomosed vessel. We overlaid the Doppler signal with the structure information together. There was little blood flow at the left side of Fig. 8(a), at the bottom of Fig. 8(b), or at the top of Fig. 8(c). The porous structure that attached to the inner vessel lumen was the thrombosis based on our experimental thrombosis imaging studies. Due to the limited image penetration depth of 900-nm band light in the blood, which is usually around 230 μm,18 we cannot see through the vessel wall all the way to the bottom; however, there was obvious blood flow beneath the thrombosis. Figure 8(d) was the distal artery imaging away from the connected junction. It confirmed that there was still blood flow in the artery and that the thrombosis at the junction area was partial. The vessel lumen was not fully occluded. Being able to detect the thrombosis offers the surgeon an opportunity to salvage the free flap or composite tissue through reanastomosis or pharmacologic thrombosis. No therapeutic procedure was performed in this case. The day 11 image clearly shows that the thrombus had resolved over time. Fig. 8Structure and Doppler flow overlaid images at day 4 of the surgical junction site: (a) sagittal-plane slice, (b) cross-sectional plane slice, (c) depth -slice, and (d) phase-resolved Doppler OCT (PRDOCT) imaging of the distal end of the anastomosed vessel (scale bar: 200 μm). 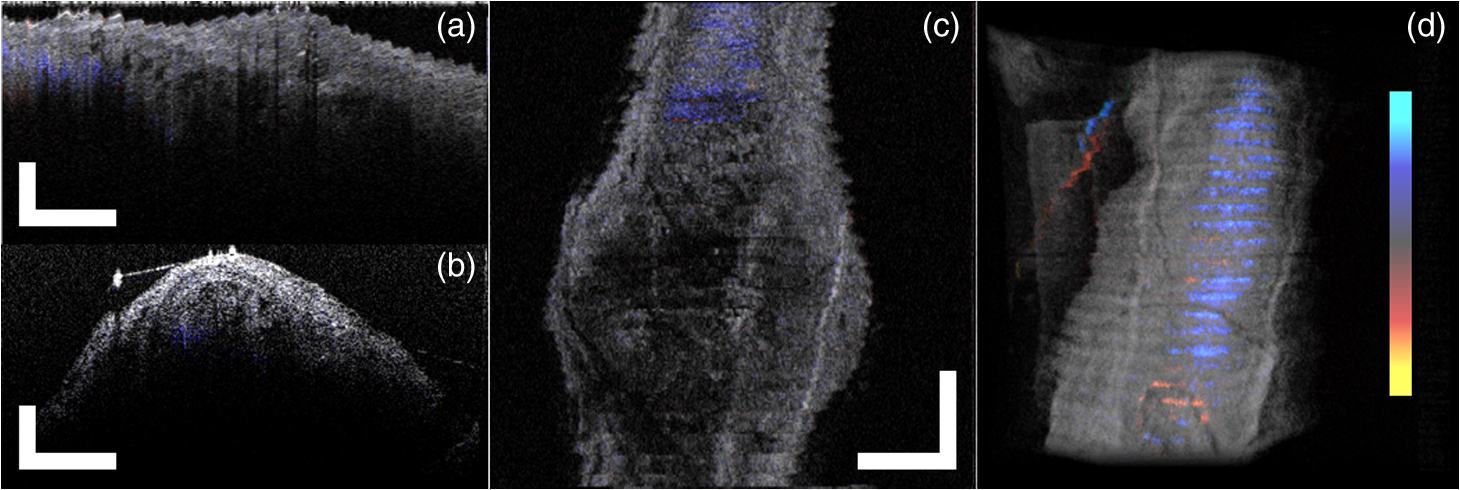 On day 11 the rat was sacrificed for histology analysis. OCT slices imaging was compared to the standard histology image in Fig. 9. Figure 9(a) was a histology slice image along the long axis of the vessel. Features were marked out in the image. From Fig. 9(a), we can see the anastomotic narrowing due to indentation of vessel wall. There was still a small thrombus near the junction area, which was not significant enough to occlude the vessel wall. It is particularly important to have some degree of thrombosis at the anastomotic site to prevent blood from leaking out of the vessel immediately after revascularization. The morphology of the thrombosis became dense instead of being porous in the day 4 OCT image. Figure 9(b) was one OCT -slice image with structure and flow information overlaid. We can clearly visualize the turbulence phenomenon and the narrowing and bending of the blood tunnel at the junction area, as shown by the histology result. A small amount of dense thrombus attached to the inner lumen wall at the junction area thickened the inner wall. Figure 9(c) explains the cause of turbulence, i.e., indented vessel wall forcing the blood flow to change the direction from moving upward to downward. 4.ConclusionWe demonstrated that real-time PRDOCT imaging can guide microvascular anastomosis, reduce the risk of technical failure, and provide immediate evaluation of the surgical outcome. Furthermore, this imaging modality can promptly diagnose early thrombus formation and potentially predict its progression. It can be used to provide rapid feedback for self-training as well as instructor-led training. In addition, OCT can be of great importance as an interventional and diagnostic tool. In our future research directions, we will combine this technique with a conventional surgical microscope to further optimize and improve surgical outcomes. A clinical environment with a user-friendly miniature handheld probe will also be another direction to proceed with. This innovative imaging modality has great potential to broaden the scope of reconstructive microsurgery through improved surgical precision and better surgical outcomes for extremely small vessels (diameter ). AcknowledgmentsThis work is supported by National Institutes of Health/National Eye Institute 1R01EY021540-01A1. Yong Huang is partially supported by the China Scholarship Council. ReferencesA. Rothwell,
“Alexis Carrel: innovator extraordinaire,”
J. Perioper. Pract., 21
(2), 73
–76
(2011). Google Scholar
E. I. Changet al.,
“Vascular anastomosis using controlled phase transitions in poloxamer gels,”
Nat. Med., 17
(9), 1147
–1152
(2011). http://dx.doi.org/10.1038/nm.2424 1078-8956 Google Scholar
L. S. LevinD. Erdman,
“Primary and secondary microvascular reconstruction of the upper extremity,”
Hand Clin., 17
(3), 447
–455
(2001). Google Scholar
C. Y. Ahnet al.,
“Clinical experience with the 3M microvascular coupling anastomotic device in 100 free-tissue transfers,”
Plast. Reconstr. Surg., 93
(7), 1481
–1484
(1994). http://dx.doi.org/10.1097/00006534-199406000-00022 PRSUAS 0032-1052 Google Scholar
R. Sucheret al.,
“Mouse hind limb transplantation: a new composite tissue allotransplantation model using nonsuture supermicrosurgery,”
Transplantation, 90
(12), 1374
–1380
(2010). http://dx.doi.org/10.1097/TP.0b013e3181ff4fc3 TRPLAU 0041-1337 Google Scholar
J. J. Chenet al.,
“CT angiography of the cardiac valves: normal, diseased, and postoperative appearances,”
RadioGraphics, 29
(5), 1393
–1413
(2009). http://dx.doi.org/10.1148/rg.295095002 0271-5333 Google Scholar
W. M. SwartzR. IzuierdoM. J. Miller,
“Implantable venous Doppler microvascular monitoring: laboratory investigation and clinical results,”
Plast. Reconstr. Surg., 93
(1), 152
–163
(1994). http://dx.doi.org/10.1097/00006534-199401000-00024 PRSUAS 0032-1052 Google Scholar
W. DrexlerJ. G. Fujimoto, Optical Coherence Tomography: Technology and Applications, Springer-Verlag, New York
(2008). Google Scholar
S. A. Boppartet al.,
“Intraoperative assessment of microsurgery with three-dimensional optical coherence tomography,”
Radiology, 208
(1), 81
–86
(1998). RADLAX 0033-8419 Google Scholar
Z. P. Chenet al.,
“Noninvasive imaging of in vivo blood flow velocity using optical Doppler tomography,”
Opt. Lett., 22
(14), 1119
–1121
(1997). http://dx.doi.org/10.1364/OL.22.001119 OPLEDP 0146-9592 Google Scholar
K. ZhangJ. U. Kang,
“Real-time 4D signal processing and visualization using graphics processing unit on a regular nonlinear- Fourier-domain OCT system,”
Opt. Express, 18
(11), 11772
–11784
(2010). http://dx.doi.org/10.1364/OE.18.011772 OPEXFF 1094-4087 Google Scholar
Y. HuangX. LiuJ. U. Kang,
“Real-time 3D and 4D Fourier domain Doppler optical coherence tomography based on dual graphics processing units,”
Biomed. Opt. Express, 3
(9), 2162
–2174
(2012). http://dx.doi.org/10.1364/BOE.3.002162 BOEICL 2156-7085 Google Scholar
M. Sylwestrzaket al.,
“Four-dimensional structural and Doppler optical coherence tomography imaging on graphics processing units,”
J. Biomed. Opt., 17
(10), 100502
(2012). http://dx.doi.org/10.1117/1.JBO.17.10.100502 JBOPFO 1083-3668 Google Scholar
J. U. Kanget al.,
“Real-time three-dimensional optical coherence tomography video image guided microsurgeries,”
J. Biomed. Opt., 17
(8), 081403
(2012). http://dx.doi.org/10.1117/1.JBO.17.8.081403 JBOPFO 1083-3668 Google Scholar
J. P. Ehlerset al.,
“Integration of a spectral domain optical coherence tomography system into a surgical microscope for intraoperative imaging,”
Invest. Ophthalmol. Vis. Sci., 52
(6), 3153
–3159
(2011). http://dx.doi.org/10.1167/iovs.10-6720 IOVSDA 0146-0404 Google Scholar
A. Ecklyet al.,
“Mechanisms underlying FeCl3-induced arterial thrombosis,”
J. Thromb Haemost., 9
(4), 779
–789
(2011). http://dx.doi.org/10.1111/jth.2011.9.issue-4 JTHOA5 1538-7933 Google Scholar
X. Liuet al.,
“Quantitative transverse flow measurement using optical coherence tomography speckle decorrelation analysis,”
Opt. Lett., 38
(5), 805
–807
(2013). http://dx.doi.org/10.1364/OL.38.000805 OPLEDP 0146-9592 Google Scholar
O. ZhernovayaV. V. TuchinM. J. Leahy,
“ Blood optical clearing studied by optical coherence tomography,”
J. Biomed. Opt., 18
(2), 026014
(2013). http://dx.doi.org/10.1117/1.JBO.18.2.026014 JBOPFO 1083-3668 Google Scholar
|