
|
|
1.IntroductionThe survivors of almost 500,000 burn injuries that receive medical treatment each year in the U.S. face immense social and economic costs during their recovery and reintegration period.1,2 Characterization of burn injuries during the early postinjury assessment period is a critical decision point in determining the management course, healing process, and ultimate outcome, since the treatment of a given burn differs considerably depending upon the results of the initial assessment. Burns are usually classified according to the depth of the damaged skin in three clinically useful categories: first-, second-, and third-degree.2 In a full-thickness or third-degree burn, the entire depth of the skin, through the stratum corneum, epidermis, and dermis layers, is destroyed. In a partial-thickness (second-degree) burn, the extent of the damage is contained within the dermis layer. Finally, first-degree or superficial burns only involve the epidermis layer of the skin and usually heal without any scars or need for medical care. The clinical course of treatment is substantially different for burns of greater severity. Third-degree injuries cannot heal without surgical and skin grafting procedures, whereas for second-degree wounds, the recovery progress consists of careful monitoring and infection prevention over a 2- to 3-week period after the burn.2,3 During this period, a subgroup of the second-degree burns will spontaneously heal, while others will develop to a full-thickness state and will require surgical intervention.2 The complex nature of partial-thickness burns is due to the extent of irreversible thermal damage to the microvasculature and the new epithelium generation sites. If an insufficient number of microvascular and epithelium generation structures survive after the injuries, the remaining viable parts of the dermis layer will slowly desiccate and eventually reach the third-degree injury level.2,4 Therefore, in order to investigate the utility of a diagnosis technique for differentiating second-degree burns from third-degree ones, in vivo animal models should be employed, as opposed to ex vivo studies, due to the complex dynamics of wound healing after thermal injury. 1.1.State of the Art in Assessment of Burn InjuriesThe accuracy rate of current clinical assessment technique to differentiate between burn grades, based mainly on visual inspection by experienced surgeons, is only about 65% to 70%.2,5 Highly accurate differentiation and delineation of burn wounds can potentially alter management, reduce length of hospital stay, and improve overall recovery for the burn patient. For instance, a noninvasive clinical diagnostic modality that could guide the treatment plan by predicting the healing outcome of second-degree burns and guide surgical delineation to minimize the scar formation would be of significant value. This idea has motivated the development of a wide variety of invasive and noninvasive diagnostic tools,2 which are usually benchmarked against histology as the gold standard. These techniques include, for example, indocyanine green dye fluorescence imaging,3,6 nuclear magnetic resonance imaging,7 ultrasonography,8 contact dielectric measurement at radio frequencies,9 multispectral optical reflection imaging,5 laser Doppler imaging,10 polarization-sensitive optical coherence tomography,11 and near-infrared spectroscopy.12,13 Although some of these techniques have shown promising results, they still have not been able to achieve sufficient specificity and sensitivity, as compared with histological assessment of wound biopsies. Moreover, significant problems have limited the implementation of such modalities in clinical environments, including cost effectiveness and compatibility to routine patient care.2 1.2.Terahertz Modality for Characterization of Burn WoundsThe terahertz part of the electromagnetic spectrum, known as the so-called “THz gap,” is usually defined by the frequencies between 100 GHz and 10 THz (wavelengths from 3 mm to 30 μm).14 The high absorption of terahertz radiation by both bound and free water molecules provides a sensitive signal contrast for imaging applications.15 Difference in the water content of the tissue has been recently proposed as the main basis for many biomedical and biological applications of terahertz radiation.16–18 Pickwell et al. furthermore showed that a double Debye dielectric relaxation model can be used to describe the terahertz response of healthy human skin,19,20 which is very similar to the model often used for polar liquids.21 Pulsed-terahertz emissions have also been used to image and delineate basal cell carcinoma22–24 and human breast cancer tumor margins,25,26 based on the differences in the water content of the cancerous tumor versus healthy tissue.27 Terahertz reflectometry and imaging has recently been proposed for the diagnosis of burn injuries ex vivo28–30 and in vivo.31–33 We have previously shown that the double Debye model, proposed by Pickwell et al.,19 can be extended to explain the higher terahertz reflectivity of moderate burn samples immediately postinjury.30 In accordance with the general burn literature,2 an increase in the water content of the burned tissue, due to formation of interstitial edema, has been experimentally observed using THz spectroscopy.30–33 Furthermore, we proposed that the sensitivity of THz waves to the postburn reduction in the number and size of discrete normal skin structures, such as microvasculature, sweat glands, and hair follicles can be used as a source of signal contrast in THz burn imaging.30,33 In this paper, we formulate a hypothesis for a burn diagnosis criterion based on in vivo terahertz reflection spectroscopy results obtained from second- and third-degree burns over a 72-hour period after injury. In order to do so, we first introduce an image processing approach to objectively quantify the density of skin structures (DOS) in histological sections of tissue samples. We then show that a strong statistical correlation exists between the THz observations and the DOS metric. 2.Materials and MethodsThe experimental animal model and burn protocol used in this study was approved by the Institutional Animal Care and Use Committee at the University of Washington. Male Sprague–Dawley rats (), weighing between 300 and 400 g, were divided into two groups. After the animal was anesthetized with isoflurane (4% for induction, 2% for maintenance, with flow rate of ), its back was shaved and epilated with hair remover lotion (Nair, Church & Dwight Co, Princeton, New Jersey). Two posterior sites corresponding approximately to the 12th thoracic vertebra were marked 3 cm laterally from the midline on both sides of the rats, one to create a burn and the other as the control tissue. Each group of rats received either a second-degree burn (), 100°C for 3 s, or third-degree burn (), 100°C for 30 s, while being maintained under analgesics for the duration of the experiments. A 313 g brass rod, with a 1 cm diameter cylindrical protrusion, was heated in a water bath maintained at 100°C. The cylindrical protrusion was then held against the marked site for the specified time using only the weight of the rod. Terahertz time-domain spectroscopy (THz-TDS) was used to measure the reflectivity of both control and burned tissue at a near normal incidence angle () immediately and at 72 h postburn. After the conclusion of the terahertz experiments on the third day, and after euthanasia by an overdose of pentobarbital (), biopsy samples were collected using a 3 mm punch. Hematoxylin and Eosin (H&E)-stained histology of all samples confirmed the consistent formation of second- and the third-degree burns using this protocol. 2.1.THz-TDS TechniqueThe THz-TDS setup used in this study was custom-made and consisted of an 800 nm 50 fs Ti:Saphire laser (Micra, Coherent Inc., Santa Clara, California), which by impinging upon a biased photoconductive antenna (Zomega Terahertz Corporation, East Greenbush, New York), built with 100 μm gap on low-temperature GaAs, generated the terahertz waves. Terahertz radiation was first collimated and then focused, using a pair of off-axis parabolic gold mirrors, on the samples placed on a fused-silica imaging window. Upon reflection from the burned and normal skin samples, the terahertz waves were detected via the electro-optic sampling method in a 1 mm thick ZnTe crystal. The entire THz-TDS system was enclosed in a box and purged with dry to eliminate the absorption features of ambient humidity from the experimental results. 2.2.Self-Calibration and Signal ProcessingBefore employing the fast Fourier transform (FFT) to investigate the spectral dependence of normal and burned skin samples, a split cosine taper was multiplied by the first and the last 20 to 25 points of the time series, and additional zeros were padded to both ends. The FFT amplitudes of the samples were normalized by the FFT of the differential reference to eliminate the effect of the intrinsic system response function. Moreover, to account for a typical terahertz signal amplitude drift in between measurements, the signal peak from the first interface of the slab, between air and fused silica, was used to self-calibrate each measurement with that of the references.30 3.Results and DiscussionFigure 1 shows microscope images of H&E-stained biopsy samples for several groups of second- and third-degree burns created with this protocol. Biopsy samples were blindly studied by histopathologists, confirming the existence of second- and third-degree burns, as appropriate, in every sample generated by this protocol. Nonetheless, these images show that even when the same physical protocol is used to create burns, a wide range of damage can result. This variation is mostly due to the random fluctuation of the number and size of normal skin constituents such as hair follicles, sweat glands, capillaries, etc. Most notably, we have observed three groups of skin burns, as represented in the columns of Fig. 1, based on the skin structures present after generation of second- and third-degree injuries. In the first column, a deeply coagulated layer of the burned tissue can be seen with few superficial cracks, while in the second column, a number of hair follicles and sweat ducts was identified in the burned regions of the dermis. The tissue samples in the third group exhibit a large density of various discrete skin structures. Fig. 1Hematoxylin and Eosin (H&E)-stained microscope images from a representative group of the second- (a–c) and third-degree burns (d–f) obtained on day 3 postinjury. Three subgroups based on the nature and density of discrete structures within the skin layers were observed: (a) and (d) show a deep coagulation of the burned tissue with minor superficial skin cracks, (b) and (e) reveal the existence of hair follicles in the burned regions of dermis, and (c) and (f) show a large density of various discrete skin structures. Scale bars represent 500 µm. 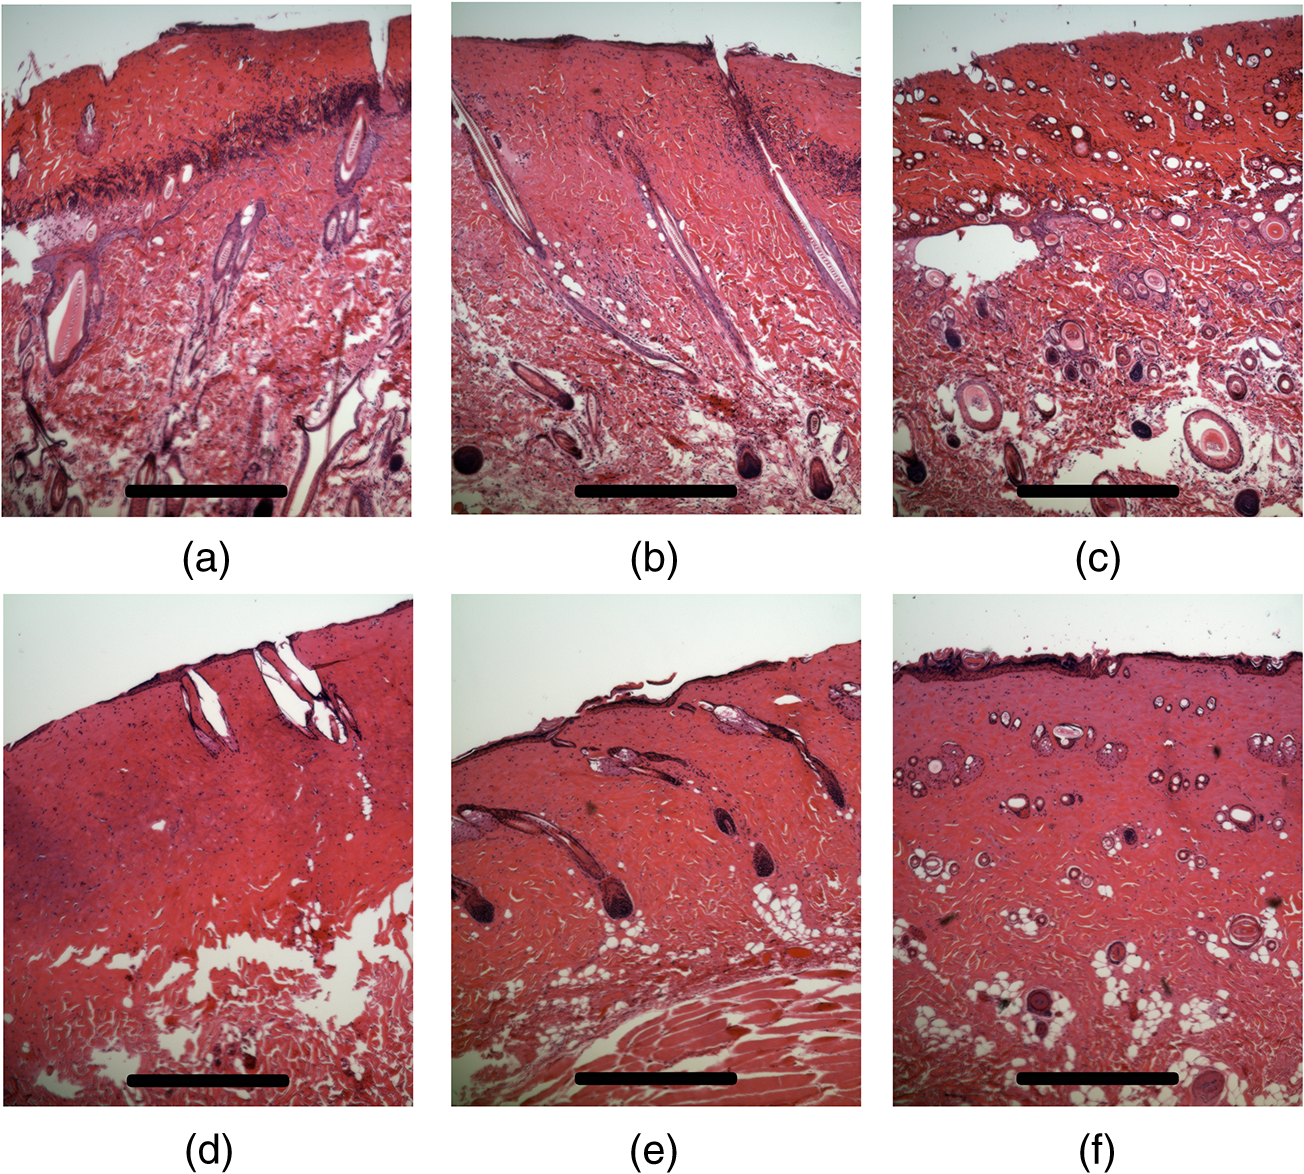 THz-TDS measurements of burned and healthy (control) tissue were obtained using a self-calibrating technique through a fused-silica imaging window. The reflection measurements were obtained immediately and at 72 h postburn at an angle of incidence close to normal (). The 72-hour juncture was chosen based on the well-established peak of the standard inflammatory response of the tissue to thermal damage by the formation of interstitial edema.2,9,34 Due to the inhomogeneity of skin tissue, and especially because the size of normal skin structures are comparable to the terahertz wavelength, for each skin sample the average reflectivity over several (3 to 5) spatially disjoint terahertz realizations was obtained. Moreover, the spot size of the beam was approximately 2 mm in diameter at the focal point. Figure 2(a) and 2(b) shows the normalized excess terahertz reflectivity of burns, induced with either 100°C for 3 s or 100°C for 30 s protocol, immediately and at 72 h postinjury. The error bars show the full range of the data obtained over different rats used in the study. The progression of the burn injuries can be seen by the comparison between the acute and the 72-hour characterization of the wounds. It is evident that the large degree of variability between samples renders the simple use of the percentage change in the THz reflectivity relative to healthy (control) tissue too ineffectual for the discrimination of burn severity. Fig. 2(a) Normalized change in terahertz reflectivity of the second-degree burns compared with normal skin (control experiment), measured immediately postburn and on day 3, (b) same quantity for the third-degree burns. The bars indicate full range of the experimental data obtained in our animal study.  This observation is in part because burn wounds are not static in their physiological nature.2,9,35 For example, as explained earlier, some of the second-degree injuries can reach a full-thickness depth (third degree) within a few days, due to the extent of thermal damage to the microvasculature and epithelium generation sites. This dynamic nature of the wound further complicates burn triage at the time of patient presentation. 3.1.Density of Skin StructuresHistopathological study of wound biopsies remains the gold standard of the burn depth assessment despite its invasive and time-consuming nature. Even though there still does not exist any universally accepted benchmark for inference of burn depth from histological sections,36 the accuracy of all other technological aids are usually measured against this method. The complexity of the dynamic molecular and cellular level changes, which skin constituents experience postburn, gives rise to most of the discrepancies in this field. For instance, while some studies indicate that the patency of microvasculature at the burn sites is the most critical factor in recovery,36 other methods emphasize cellular and epithelial intactness as the main predictor for wound healing.2 The presence of discrete skin structures, which are also known to be determinants of the healing likelihood of the burned skin,11–12,34,36 can potentially give rise to scattering of electromagnetic waves as they propagate through skin layers. In this section, we introduce a simple image processing method to objectively quantify the DOS in an attempt to relate our histopathological findings to the THz observations. Figure 3(a) shows a flowchart diagram of the steps involved in the image processing of the histology sections to count each pixel associated with the discrete structures in the burned and normal skin samples. The algorithm first identifies the skin edge, and subsequently defines a search area approximately 400 μm deep in the tissue. It then recognizes tissue structures such as microvascular capillaries, hair follicles, sweat glands, and their skin duct based on the ratio of the red and blue components of the acquired image in comparison to the two detection thresholds, and . To determine these threshold values, we used two groups of the histological sections as learning subsets: (1) deeply coagulated tissue with only minor superficial skin cracks (usually of lighter colors) and (2) burned tissue including only dark-colored hair follicles and shafts. Each group included two skin biopsy samples and four cross section images per biopsy. We varied the values of and within the search domain for the learning subsets until all pixels associated with white skin cracks or dark hair structures were correctly identified by the algorithm. The determined threshold values were then used for all remaining histological images that presented a more complex collection of skin structures. Finally, the program calculates the total areal density of such structures within the search area. This density value is the largest ( to 30%) for healthy skin, and the more severely the tissue is damaged, the smaller the DOS will be. Figure 3(b) and 3(c) shows typical outcomes of the image processing routine for a full-thickness and partial-thickness burn sample, respectively. Fig. 3(a) Cross-functional flowchart of the image processing and density of skin structures (DOS) calculation routine. (b, c) Typical pseudo-colored figures of the burned skin cross-sections show the thresholds and used in detection of skin structures for a representative third- and second-degree burn, corresponding to Fig. 1(e) and 1(c), respectively. The edge of the skin is previously detected in the image processing algorithm, and therefore pixels outside the tissue margins are not considered.  Figure 4 maps out our experimental results in the form of a scatter plot, where the -axis shows the average reflectivity of skin samples between 0.2 and 1 THz, while the -axis shows the spectral slope or rate of change in reflectivity with respect to frequency at 72 h postinjury. The color code is determined by averaging the DOS metric from the image processing analysis of up to four histological sections of each tissue biopsy. Individual symbol types correspond to individual rats. The dotted lines, which are vertically offset for clarity, are drawn here as a visual aid. It can be seen that while all normal samples are aggregated in the lower left quadrant of the figure, the burned tissue data are spread out according to the degree of deviation of the THz reflectivity from their respective normal controls. In this plot, the excess reflectivity along the -axis is generally attributed to the formation of interstitial edema at the burned sites.30–33 However, the change in the spectral slope of the THz reflectivity (THz color of the burns), which is shown in the -axis, is not well understood. One possible explanation suggests that a potential change in the dispersive properties of normal skin as a result of the thermal insult as well as absorption by the water content of the tissue may be responsible for this observation. It may also be consistent with a reduction in electromagnetic scattering of terahertz waves due to a decrease in the density of discrete scatterers, i.e., the DOS value, as we observe here. Specifically, in all normal tissue samples, where the DOS is the largest, the normalized THz reflectivity showed a steep roll-off with higher frequencies, resulting in negative slope values along the -axis for the blue symbols in Fig. 4. However, the burned samples demonstrated near-zero or positive spectral slopes, suggesting reduced scattering levels as the DOS value decreases. Fig. 4The severity of burn injuries can be mapped out based on the mean and spectral slope of their THz reflectivity at 72 h postinjury. The more severe burns (lower DOS values) are further apart from their normal (control) tissue (blue). The dotted lines () are guide to the eye and color denotes DOS.  From this map, we infer that some of the second-degree injuries were severe enough to reach DOS values comparable to third-degree burns within 72 hours. For example in Fig. 4, the burn sample marked with was created with a second-degree protocol, but in both THz spectroscopy response and DOS, it has reached values corresponding to a full-thickness burn. We can also confirm from histological sections that other samples showed signs of healing within the same period. For instance, the second-degree burn with DOS estimated at 15%, placed very closely to its normal (control) tissue on the scatter plot, illustrates this effect. Of the nine rats in our survival studies, we found only one outlier to this general trend (a nominally second-degree burn with DOS value of 7.7%). These results suggest that while discrimination of burn severity cannot be ascertained solely based on the absolute value of the terahertz reflectivity, a combined measure of reflectivity () and spectral slope () can differentiate among them based on the DOS metric. We define this combined measure, , with a linear combination of and , as given in Eq. (1), where and are two arbitrary coefficients that can be optimized to achieve maximum specificity in for the differentiation of burn grades. The results of our optimization search over all experimental results reveal that all contours satisfy such a condition. Alternatively, and can be optimized to reach other objectives, such as maximum linear correlation between DOS and , maximum square distance between healthy and burned tissue, etc. The linear transformation of and into under this optimized condition () simply rotates the Cartesian coordinates in Fig. 4 perpendicular to the dashed lines. It should also be noted that limiting the range of variables and does not constrain the possible linear combinations of THz reflectivity and spectral slope, when and are varied simultaneously and therefore their ratio can be quite large. Figure 5 summarizes our hypothesis for a new burn diagnosis criterion using this combined measure, , when . Specifically, we hypothesize that the anticorrelation relation between DOS and , as shown in Fig. 5, can be used to infer the severity of burn injuries, and therefore their likelihood for spontaneous healing, when THz radiation is used to interrogate the intactness of skin structures.Fig. 5The anticorrelation between the DOS and metrics ( and coefficients are optimized for maximum specificity, resulting in ) are shown. The green-colored data point refers to the partial-thickness sample that exhibited signs of healing within 72 h postinjury.  Large scale experimental studies, complete with statistical models, are necessary before the usefulness of the -value criterion in predicting the healing outcome of partial-thickness burns can be verified. In order to develop such statistical models, the progress of different burn grades should be monitored over a 2- to 3-week period to determine which values of DOS and correspond to the samples that naturally heal, while others require surgical intervention. 4.ConclusionWe have presented experimental results from in vivo THz-TDS of second- and third-degree burns in a survival study over the 72-hour period postinjury. We showed examples of the wide range of histopathological manifestation of burned tissue that must be characterized during triage for successful treatment of burns. We then introduced an image processing approach to objectively quantify the severity of these injuries based on the DOS metric. We showed that the terahertz response of different burn grades is not only consistent with the presumed overall water content in the tissue, but also correlates with the density of discrete scattering structures within the skin layers. These observations suggest, in turn, a new diagnosis criterion for clinical discrimination of burn injuries based on the THz response of the tissue. AcknowledgmentsM. Hassan Arbab is grateful to Dr. Eric Thorsos for reviewing the manuscript and for helpful suggestions. This work was partially supported by the Washington Research Foundation. ReferencesP. Corsoet al.,
“Incidence and lifetime costs of injuries in the United States,”
Inj. Prev., 12
(4), 212
–218
(2006). http://dx.doi.org/10.1136/ip.2005.010983 Google Scholar
B. S. AtiyehS. W. GunnS. N. Hayek,
“State of the art in burn treatment,”
World J. Surg., 29
(2), 131
–148
(2005). http://dx.doi.org/10.1007/s00268-004-1082-2 WJSUDI 0364-2313 Google Scholar
J. M. Stillet al.,
“Diagnosis of burn depth using laser-induced indocyanine green fluorescence: a preliminary clinical trial,”
Burns, 27
(4), 364
–371
(2001). http://dx.doi.org/10.1016/S0305-4179(00)00140-6 BURND8 0305-4179 Google Scholar
P. Shakespeare,
“Burn wound healing and skin substitutes,”
Burns, 27
(5), 517
–522
(2001). http://dx.doi.org/10.1016/S0305-4179(01)00017-1 BURND8 0305-4179 Google Scholar
M. A. Afromowitzet al.,
“Multispectral imaging of burn wounds: a new clinical instrument for evaluating burn depth,”
IEEE Trans. Biomed. Eng., 35
(10), 842
–850
(1988). http://dx.doi.org/10.1109/10.7291 IEBEAX 0018-9294 Google Scholar
H. A. Greenet al.,
“Burn depth estimation using indocyanine green fluorescence,”
Arch. Dermatol., 128
(1), 43
–49
(1992). http://dx.doi.org/10.1001/archderm.1992.01680110053005 ARDEAC 0003-987X Google Scholar
M. J. Korudaet al.,
“Assessing burn wound depth using in vitro nuclear magnetic resonance (NMR),”
J. Surg. Res., 40
(5), 475
–481
(1986). http://dx.doi.org/10.1016/0022-4804(86)90218-0 JSGRA2 0022-4804 Google Scholar
S. Iranihaet al.,
“Determination of burn depth with noncontact ultrasonography,”
J. Burn Care Res., 21
(4), 333
–338
(2000). http://dx.doi.org/10.1097/00004630-200021040-00008 1559-047X Google Scholar
A. Pappet al.,
“Dielectric measurement in experimental burns: a new tool for burn depth determination?,”
Plast. Reconstr. Surg., 117
(3), 889
–898
(2006). http://dx.doi.org/10.1097/01.prs.0000197213.12989.03 PRSUAS 0032-1052 Google Scholar
A. D. Jaskilleet al.,
“Critical review of burn depth assessment techniques: part II. Review of laser Doppler technology,”
J. Burn Care Res., 31
(1), 151
–157
(2010). http://dx.doi.org/10.1097/BCR.0b013e3181c7ed60 1559-047X Google Scholar
S. M. Srinivaset al.,
“Determination of burn depth by polarization-sensitive optical coherence tomography,”
J. Biomed. Opt., 9
(1), 207
–212
(2004). http://dx.doi.org/10.1117/1.1629680 JBOPFO 1083-3668 Google Scholar
M. G. Sowaet al.,
“Classification of burn injuries using near-infrared spectroscopy,”
J. Biomed. Opt., 11
(5), 054002
(2006). http://dx.doi.org/10.1117/1.2362722 JBOPFO 1083-3668 Google Scholar
K. M. Crosset al.,
“Clinical utilization of near-infrared spectroscopy devices for burn depth assessment,”
Wound Repair Regen., 15
(3), 332
–340
(2007). http://dx.doi.org/10.1111/j.1524-475X.2007.00235.x Google Scholar
P. H. Siegel,
“Terahertz technology in biology and medicine,”
IEEE Trans. Microw. Theory Tech., 52
(10), 2438
–2447
(2004). http://dx.doi.org/10.1109/TMTT.2004.835916 IETMAB 0018-9480 Google Scholar
E. PickwellV. P. Wallace,
“Biomedical applications of terahertz technology,”
J. Phys. D Appl. Phys., 39
(17), R301
(2006). http://dx.doi.org/10.1088/0022-3727/39/17/R01 JPAPBE 0022-3727 Google Scholar
D. B. Bennettet al.,
“Terahertz sensing in corneal tissues,”
J. Biomed. Opt., 16
(5), 057003
(2011). http://dx.doi.org/10.1117/1.3575168 JBOPFO 1083-3668 Google Scholar
Z. D. Tayloret al.,
“THz medical imaging: in vivo hydration sensing,”
IEEE Trans. Terahertz Sci. Technol., 1
(1), 201
–219
(2011). http://dx.doi.org/10.1109/tthz.2011.2159551 Google Scholar
J. Federici,
“Review of moisture and liquid detection and mapping using terahertz imaging,”
J. Infrared Milli. Terahertz. Waves, 33
(2), 97
–126
(2012). http://dx.doi.org/10.1007/s10762-011-9865-7 1866-6892 Google Scholar
E. Pickwellet al.,
“Simulation of terahertz pulse propagation in biological systems,”
Appl. Phys. Lett., 84
(12), 2190
–2192
(2004). http://dx.doi.org/10.1063/1.1688448 APPLAB 0003-6951 Google Scholar
E. Pickwellet al.,
“In vivo study of human skin using pulsed terahertz radiation,”
Phys. Med. Biol., 49
(9), 1595
(2004). http://dx.doi.org/10.1088/0031-9155/49/9/001 PHMBA7 0031-9155 Google Scholar
J. T. KindtC. A. Schmuttenmaer,
“Far-infrared dielectric properties of polar liquids probed by femtosecond terahertz pulse spectroscopy,”
J. Phys. Chem., 100
(24), 10373
–10379
(1996). http://dx.doi.org/10.1021/jp960141g JPCHAX 0022-3654 Google Scholar
R. M. Woodwardet al.,
“Terahertz pulse imaging of ex vivo basal cell carcinoma,”
J. Investig. Dermatol., 120
(1), 72
–78
(2003). http://dx.doi.org/10.1046/j.1523-1747.2003.12013.x JIDEAE 0022-202X Google Scholar
V. P. Wallaceet al.,
“Terahertz pulsed imaging of basal cell carcinoma ex vivo and in vivo,”
Br. J. Dermatol., 151
(2), 424
–432
(2004). http://dx.doi.org/10.1111/bjd.2004.151.issue-2 BJDEAZ 0007-0963 Google Scholar
R. M. Woodwardet al.,
“Terahertz pulse imaging in reflection geometry of human skin cancer and skin tissue,”
Phys. Med. Biol., 47
(21), 38533863
(2002). http://dx.doi.org/10.1088/0031-9155/47/21/325 PHMBA7 0031-9155 Google Scholar
A. J. Fitzgeraldet al.,
“Terahertz pulsed imaging of human breast tumors,”
Radiology, 239
(2), 533
–540
(2006). http://dx.doi.org/10.1148/radiol.2392041315 RADLAX 0033-8419 Google Scholar
P. C. Ashworthet al.,
“Terahertz pulsed spectroscopy of freshly excised human breast cancer,”
Opt. Express, 17
(15), 12444
–12454
(2009). http://dx.doi.org/10.1364/OE.17.012444 OPEXFF 1094-4087 Google Scholar
V. P. Wallaceet al.,
“Terahertz pulsed spectroscopy of human basal cell carcinoma,”
Appl. Spectrosc., 60
(10), 1127
–1133
(2006). http://dx.doi.org/10.1366/000370206778664635 APSPA4 0003-7028 Google Scholar
D. M. Mittlemanet al.,
“Recent advances in terahertz imaging,”
Appl. Phys. B, 68
(6), 1085
–1094
(1999). http://dx.doi.org/10.1007/s003400050750 APBOEM 0946-2171 Google Scholar
Z. D. Tayloret al.,
“Reflective terahertz imaging of porcine skin burns,”
Opt. Lett., 33
(11), 1258
–1260
(2008). http://dx.doi.org/10.1364/OL.33.001258 OPLEDP 0146-9592 Google Scholar
M. H. Arbabet al.,
“Terahertz reflectometry of burn wounds in a rat model,”
Biomed. Opt. Express, 2
(8), 2339
–2347
(2011). http://dx.doi.org/10.1364/BOE.2.002339 BOEICL 2156-7085 Google Scholar
P. Tewariet al.,
“Advances in biomedical imaging using THz technology with applications to burn-wound assessment,”
Proc. SPIE, 8261 82610T
(2012). http://dx.doi.org/10.1117/12.915987 PSISDG 0277-786X Google Scholar
P. Tewariet al.,
“In vivo terahertz imaging of rat skin burns,”
J. Biomed. Opt., 17
(4), 040503
(2012). http://dx.doi.org/10.1117/1.JBO.17.4.040503 JBOPFO 1083-3668 Google Scholar
M. H. Arbabet al.,
“Characterization of burn injuries using terahertz time-domain spectroscopy,”
Proc. SPIE, 7890 78900Q
(2011). http://dx.doi.org/10.1117/12.876229 PSISDG 0277-786X Google Scholar
T. W. PankeC. G. McLeold, Pathology of Thermal Injury: a Practical Approach, Grune & Stratton, Orlando, FL
(1985). Google Scholar
D. J. McGillet al.,
“Assessment of burn depth: a prospective, blinded comparison of laser Doppler imaging and videomicroscopy,”
Burns, 33
(7), 833
–842
(2007). http://dx.doi.org/10.1016/j.burns.2006.10.404 BURND8 0305-4179 Google Scholar
A. M. I. Wattset al.,
“Burn depth and its histological measurement,”
Burns, 27
(2), 154
–160
(2001). http://dx.doi.org/10.1016/S0305-4179(00)00079-6 BURND8 0305-4179 Google Scholar
|


