
|
|
1.IntroductionNanotechnology utilizes nanoscale-size materials that offer new attractive properties not available in bulk form and is positioned to revolutionize cancer medicine. In a plethora of existing organic and inorganic nanoparticles (NPs), gold NPs (Au NPs) enjoy an unprecedented growth in popularity. For cancer applications, the use of Au NPs has advanced along several major fronts covering both diagnostic and therapeutic aspects: (1) interstitial NP-mediated laser thermal therapy,1,2 (2) cancer diagnostics via delineation of cancer affected areas with NPs conjugated to monoclonal antibodies,3–5 (3) enhanced radiation sensitivity and toxicity in cancer cells containing Au NPs,6 (4) drug delivery vectors.7–9 Such functional diversity even prompted coining a special term, the theranostic NP meaning that a NP combines both therapeutic and diagnostic properties and this duality enables simultaneous or sequential applications of imaging and therapeutic modalities. Immunogold labeling reported by Faulk and Taylor10 in 1971 can be considered one of the first applications of Au NPs in biomedical imaging. Nowadays, a number of imaging techniques have benefited from the use of Au NPs. In particular, with Au NPs serving as contrast agents computed tomography (CT) was shown to demonstrate molecular specificity toward certain types of cancer.4,11,12 Since X-ray photons do not scatter as much as optical photons, CT delivers good image quality thus allowing excellent deep tissue imaging capabilities. While providing obvious benefits for nonoptical imaging modalities, Au NPs can be regarded as a disruptive technology because none of the existing clinical medical imaging modalities are light-based13 and thus, cannot explore the primary strengths and benefits of Au NPs. As opposed to nonoptical imaging modalities, optical techniques exploit unique optical properties of Au NPs (plasmon enhanced scattering and absorption cross-sections leading to an enhanced optical contrast14) which differentiate Au NPs from other chromophores used as contrast agents. In addition, optical diagnostics may offer a number of advantages compared to traditional medical modalities: it uses nonionizing radiation, provides biochemical information via spectroscopic identification, allows the control of light penetration depth in tissues via wavelength selection and offers more portable and less expensive technical solutions. While there has been significant progress in using optical microscopy for cellular-level imaging by labeling cancer cells with Au NPs3,15 deep tissue optical imaging and cancer diagnostics using Au NPs for delineating malignant regions do not share the same degree of success. It is mainly due to the detrimental impact of multiple scattering of photons on the image quality that results in a loss of resolution and image blurring16 making deep tissue imaging a formidable task. In some cases, optical diagnostics can be performed in a noninvasive way by confining both illumination and detection to superficial layers [as in a diffuse optical tomography (DOT)].16,17 However, even with a few cm of penetration depth some regions in a human body are difficult to reach (e.g., prostate) and one has to resort to interstitial illumination and detection while still attempting to minimize the degree of invasiveness. Regardless of the applications, an ability to identify, locate, and quantify fixed loads of Au NPs in the prostate gland via noninvasive or minimally invasive methods would be highly beneficial.18 For prostate cancers, typical applications of Au NPs include interstitial NP-mediated laser thermal therapy,19 enhanced radiation sensitivity and toxicity in prostate cancer cells containing Au NPs,20 and brachytherapy implants of radioactive NPs placed into a prostate gland to deliver the radiopharmaceutical dose directly to the tumor site.21 In addition to the therapeutic applications listed above, Au NPs can be used for prostate cancer diagnostics or imaging purposes. To achieve it, either active targeting of Au NPs conjugated to monoclonal antibodies or passive targeting by relying on the enhanced permeability and retention effect can be employed. Both procedures will lead to the accumulation of Au NPs in tumor-affected areas inside the prostate gland. Rather than battling optical scattering and employing multiple source–detector configurations (as in DOT) to detect Au NPs-based inclusions, we have pursued a different approach. By employing a single light source and a directional detector (based on optical radiance), we relied on optical scattering to deliver information on localized inclusions of Au NPs deeply embedded in tissues to the detector. Using the optical radiance method,22 we detected localized inclusions of Au NPs, identified their spectroscopic signatures, and localized them in the angular domain, presenting information in a compact form of spectro-angular maps.23,24 The approach has been tested extensively on Intralipid-based liquid phantoms that have scattering properties similar to biological tissues. However, actual biological tissues demonstrate various degrees of heterogeneity (as opposed to homogenous Intralipid-based phantoms) that may affect the detection procedure. In this work, we have applied, for the first time, the developed approach to actual biological tissues aiming to detect interstitially Au NPs deeply embedded in tissues in a prostate-relevant geometry for a porcine-based phantom. 2.Material and MethodsOptical radiance defines a variation in the angular density of photons impinging on a selected point in tissue from various directions. To obtain radiance data, a specially constructed optical probe with a well-defined angular detection window must be rotated along its axis. A schematic of the experimental setup is shown in Fig. 1(a). A tungsten halogen white light source (20 W) provided uniform tissue illumination through a fiber with a 2-mm spherical diffuser at the end. The total power output from the spherical diffuser was estimated to be . Detection was performed with a 600-μm side-firing fiber (the radiance detector). The side-firing fiber (Pioneer Optics) was produced by polishing a fiber tip at angle that provides a total internal reflection at the glass/air interface. When coupled to a light source, this fiber would emit light sideways at an angle close to 90 deg within a well-defined angular aperture of in water [Fig. 1(b)]. The fiber can also be used for side light collection as in the current work. To prevent any secondary rays that do not undergo the total internal reflection to couple back to the fiber from other directions, a cap from a heat-shrink white polymer tube with a hole aligned to the entrance window was placed at the end of the side-firing fiber. Both illuminating and detecting fibers were threaded through 15-gauge needles for mechanical stability. The side-firing fiber was mounted on a computer-controlled rotation stage (Thorlabs). Radiance data were acquired by rotating the side-firing fiber over a 360-deg range with a 2-deg step. The side firing fiber was connected to a computer-controlled USB 4000 spectrometer (Ocean Optics) that collected spectra at every angular step. Depending on the number of averages, it took between 4 and 8 min to acquire a complete single angular profile. Fig. 1(a) Schematic of experimental setup for optical radiance measurements. (b) A light cone coming from the side-firing fiber.  The porcine phantom was prepared by cutting a prostate-size piece ( diameter, thick) from pork (loin) with some representative images shown in Fig. 2. The phantom was placed into a black wall plastic holder to keep the cylindrical shape and provide absorptive type boundaries [as seen in Fig. 2(a)]. Prior to inserting the illuminating and detecting fibers and the capillary with Au NPs solution, holes were made in the desired locations in the phantom [Fig. 2(b)]. Fig. 2(a) Porcine phantom in a plastic holder, (b) porcine phantom with holes prepared for inserting the fibers and the capillary tube, (c) porcine phantom in the experimental setup with the detecting fiber (in the middle), the illuminating fiber (in the metal holder) and the capillary tube with Au NRs at angle, and (d) porcine phantom during measurements. 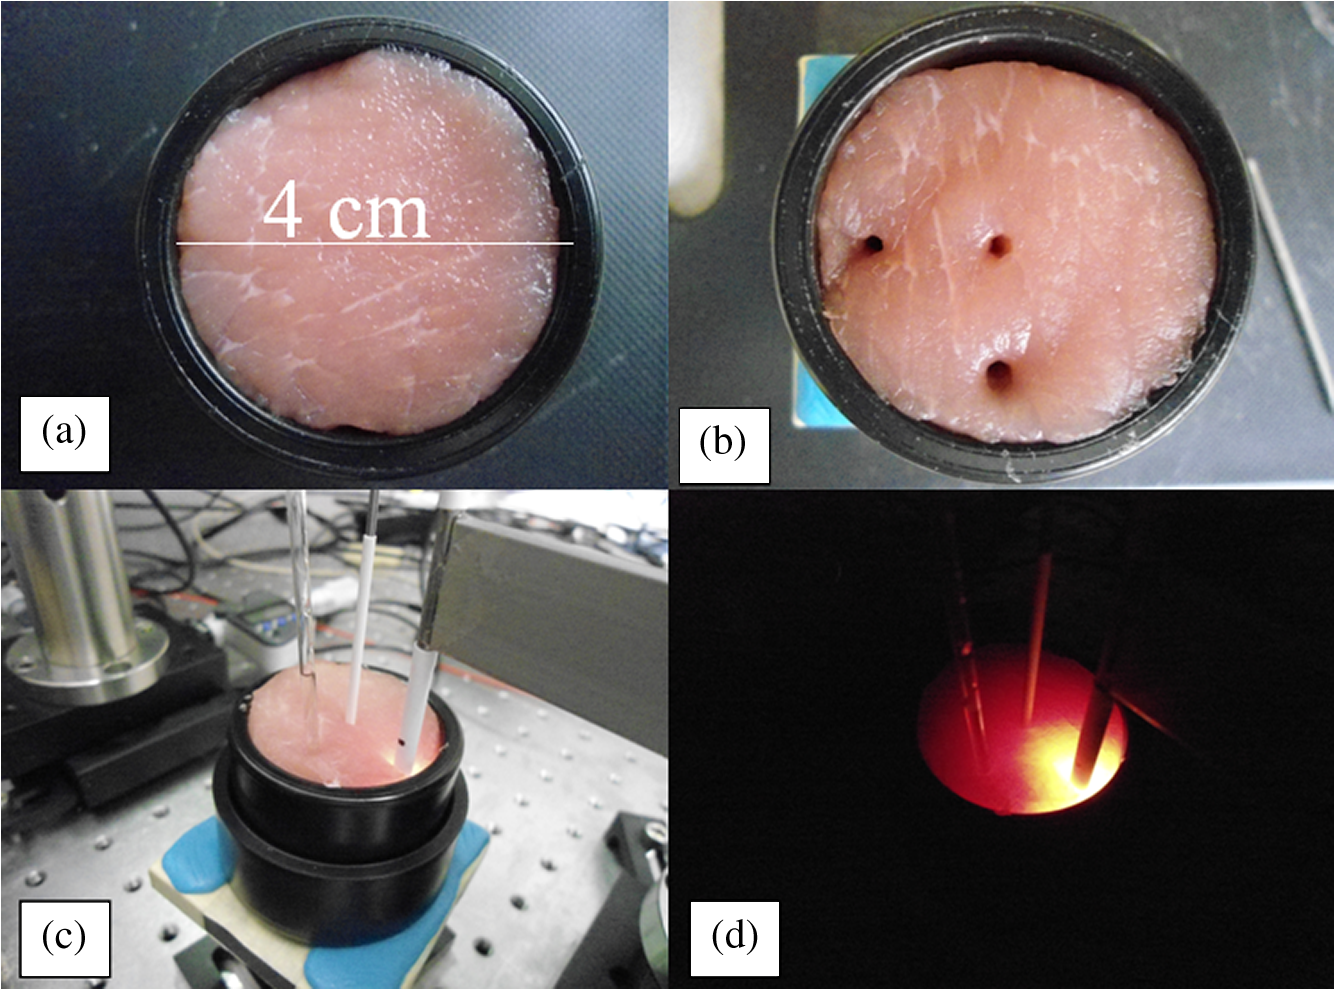 In most experiments, a localized inclusion was formed by filling a 2-mm diameter quartz capillary with of unconjugated Au nanorods water solution (Nanopartz). On a single occasion indicated in the text, the inclusion was formed by syringe injection of 0.1 mL of the solution halfway into the tissue. Two types of Au nanorods were used: (i) 12 nm diameter, 35 nm length, , , 700 nm plasmon resonance wavelength [Fig. 3(a)] and (ii) 12 nm diameter, 48 nm length, , , 756 nm plasmon resonance wavelength [Fig. 3(b)]. The molar absorption and scattering coefficients (at the wavelength of plasmon resonance) were as follows: (absorption) and (scattering) for 700-nm Au NPs; (absorption) and (scattering) for 756-nm Au NPs. Thus, all particles can be considered as dominant absorbers. The tube was inserted at the full depth into the phantom at a selected location as can be seen in Fig. 2(c). Measurements were performed in the dark [Fig. 2(d)]. Fig. 3(a) Absorption spectrum of Au nanorods (35 nm length) with a plasmon resonance at 700 nm. (b) Absorption spectrum of Au nanorods (45 nm length) with a plasmon resonance at 756 nm. 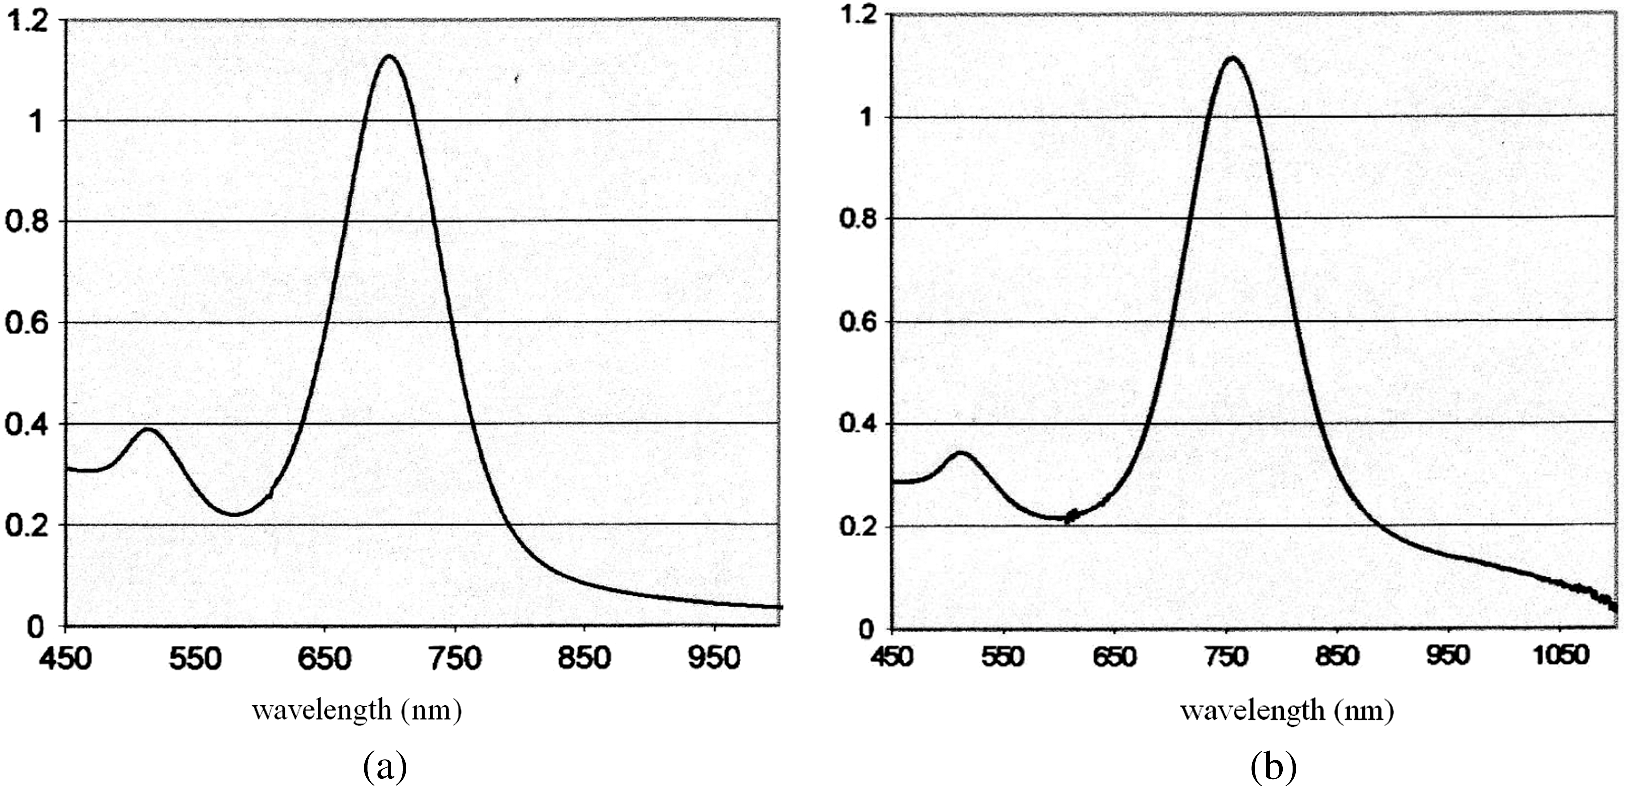 For an average prostate with a diameter of 4 to 5 cm, illuminating through the rectal wall and detecting with a urethra-placed fiber will ensure that the prostate is probed in a minimally invasive way. Figure 4 shows a top-view cross-section of the porcine phantom with positions of the detecting fiber, illuminating fiber and Au NPs-based inclusion (i.e., the target) along with a superimposed contour of a virtual prostate. The selected location of the Au NPs target at corresponds to the most distant probing of the prostate when the targeted area is located on the periphery of the prostate. Detecting Au NPs in this location was of primary goal in the current work. One can see that for a relevant prostate geometry, source–detector and detector–target separations usually do not exceed . These considerations determined the geometry for measurements in the phantom with the Au NPs target. Since the distance between the rectum and urethra is fixed and puncturing the prostate is highly undesirable in a minimally invasive detection, we fixed the separation between the source and the detector at 15 mm. With the fixed concentration of Au NPs in the target, the target was incrementally moved along direction away from the detector toward the periphery until the measured signature of the target was lost. Hence, our aim was to detect the Au NPs based inclusion of the fixed concentration as close as possible to 2-cm separation as in Fig. 4. 3.Results3.1.Spectro-Angular Mapping of Light Distribution in the Bare Porcine PhantomTo test the limits of light transmission in the porcine phantom and get its spectral characteristics, the source and the detecting fibers were inserted along the diameter of the phantom and each was 5 mm away from the outer boundaries. Such geometry resulted in the largest possible source–detector separation (i.e., 30 mm) and allowed testing illumination conditions for the most distant regions of the phantom. Detection of Au NPs based inclusions depends greatly on the ability to provide adequate illumination in the inclusion’s location which could be anywhere in the phantom. Prior to introducing the localized inclusion, it is desirable to know if the entire phantom is accessible to illumination. Extending the distance between the source and the detector almost to the size of the phantom corresponds to the extreme possible separation and provides the necessary geometry for obtaining the answer. Due to physical limitations, it was not possible to position both fibers directly at the circumference of the phantom which would give a 40-mm source–detector separation. Radiance () is a function of the source–detector separation (), the angle between the direction of propagation and direction of scattering () and the wavelength of light (). Individual spectral profiles of radiance, measured every 2 deg over 360 deg, were combined into the phantom spectro-angular matrix with columns corresponding to wavelengths from 650 to 900 nm and rows corresponding to angles from to 178 deg. In a similar way, the water matrix was assembled in which the same spectrum of radiance measured at 0 deg in water was replicated for all rows (i.e., angles) with the subscript “0” emphasizing it. Constructing a ratio of these two matrices eliminates spectral responses from the white light source, illuminating and detecting fibers in addition to referencing phantom measurements to those in water. This procedure is similar to referencing to a blank in spectroscopic measurements. The ratio of focuses on transmission properties of the porcine phantom, has a clear physical definition and corresponds to relative radiance that can be converted to the absolute value with a proper normalization coefficient.24 The ratio is presented as a contour plot in Fig. 5(a) and demonstrates light distribution in the porcine phantom measured in the location most distant from the light source. The maximum transmission of light is marked with red and occurs in the forward scattering direction (i.e., along 0 deg when the detector is facing the light source). The relatively strong signal indicates that the combination of the white light source and the spherical diffuser provides adequate tissue illumination as far as 30 mm away from the source. The highest transmission is observed for wavelengths around 810 nm. In the angular domain, light remains relatively well localized such that photon density drops down to of the total density in the backscattered direction (i.e., 178 deg). This is drastically different from the spectro-angular map of Intralipid-1% measured for the same 30-mm source–detector separation where the intensity dropped down to only of the total value.24 The origin of better angular confinement of light is due to the presence of additional chromophores in the porcine phantom that increase absorption for long-travelled photons in the backscattering direction. Fig. 5(a) Spectro-angular plot of () for 30-mm source–detector separation in the porcine phantom. (b) Transmission through 30 mm of the porcine phantom [black, corresponds to the spectrum at 0 deg from (a)], oxygenated (blue) and de-oxygenated (red) hemoglobin from Ref. 25.  Spatial distribution of light inside turbid media is a wavelength-dependent quantity based on absorption and scattering of individual chromophores. While the presence of particular chromophores depends on the nature of biological tissue, the most significant chromophores in biological tissues (including porcine phantoms) are oxygenated and de-oxygenated hemoglobin, water, and lipids. A combination of absorption spectra of chromophores as well as scattering defines the most usable optical range (the biomedical transparency window) where light can propagate the most. To understand the nature of the spectral changes from Fig. 5(a), the spectrum corresponding to 0 deg was plotted in Fig. 5(b) along with reciprocal molar extinction coefficients () for oxygenated (blue) and de-oxygenated (red) hemoglobin.25 In the absence of knowledge of concentration values for individual chromophores, the overlap of blue and red curves from Fig. 5(b) agrees qualitatively with experimentally measured radiance along 0 deg which gives the transmission spectrum of the porcine phantom. The maximum transmission occurs close to the isosbestic point around 800 nm while the dip at 760 nm is brought by the feature from Hb curve. The steep drop toward long wavelengths can be explained by increasing water absorption (absent in the plot). The relative radiance curve indicates that the optimal optical transmission window for the porcine sample would be between and . However, it should be noted that for in vivo tissues blood circulation may change the ratio between oxygenated and de-oxygenated hemoglobin thus shifting the most optimal wavelength toward 690 nm. 3.2.Spectro-Angular Mapping of Au NPs Inclusion in the Porcine PhantomInserting the Au NPs localized inclusion into the porcine phantom perturbs the original light distribution. It was shown earlier22 that out of two qualities offered by plasmon NPs (increased absorption and/or increased scattering), distant measurements in turbid media can detect only a decrease in a signal due to locally increased absorption thus excluding NPs with mostly scattering properties from a list of possible contrast agents. This is distinctly different from very thin slices of tissues used in optical microscopy and OCT measurements (up to few mms) where reduced light scattering can support the use of both absorption- and scattering-based contrast agents. Radiance can localize the Au NPs based inclusion via the extinction ratio approach that effectively cancels the contribution from the turbid medium and ensures that any signal constructed from the ratio comes from the presence of the Au NPs only.22–24,26 The extinction ratio approach relies on obtaining two data sets, for the phantom with the inclusion (or target) and for the phantom without the inclusion, . Then, the radiance extinction ratio (RER) is defined as . This ratio emphasizes attenuation of light in the phantom with the inclusion such that values of map regions of the increased extinction (relative to the bare phantom) in the spectral and angular domains. In all experiments with localized inclusions in the phantom, the source–detector separation was kept at 15 mm to be consistent with a typical urethra-rectum distance in the human prostate. Initially, the inclusion was placed at a 5-mm distance from the detector at angle according to geometry shown in Fig. 4. The spectro-angular map of RER(5, , ) for the inclusion formed with 756-nm plasmon resonance Au NPs solution is shown in Fig. 6(a). Regions of high extinction are marked by red color and low extinction by the blue. The maximum of RER in the angular domain occurs around [dotted line in Fig. 6(a)] and points to the direction of the actual position of the inclusion, i.e., . Considering positioning accuracy, the agreement between the values is good. (High values of RER observed for for almost all wavelengths and marked by red color is an artifact caused by the fiber dragging the tissue while rotating.) In the spectral domain, the maximum of RER occurs near 750 nm. The spectrum taken along the dotted line is plotted in Fig. 6(b). The plasmon resonance around 750 nm allows for a clear identification of the Au NPs absorption spectrum that is presented in Fig. 3(b). Fig. 6(a) Contour plot of the spectro-angular map of the RER of capillary formed Au NPs target with 756-nm plasmon resonance in the porcine phantom. (b) The spectrum corresponding to angle. Source–detector separation 15 mm, detector–target separation 5 mm, target angle .  Due to the perturbative nature, the inclusion produces locally increased absorption in the background medium causing an increase in RER values. Introducing the localized absorber decreases the density of photons that originate from the source, pass through the inclusion’s location (in the absence of the inclusion), and get collected by the detector. Thus, the inclusion essentially allows to tag the photons that would have normally been collected by the detector but are removed by the interaction with the inclusion. Due to multiple scattering, the absorptive inclusion removes photons from the area that is larger than physical dimensions of the inclusion. It corresponds to angular broadening when detection is performed in the angular domain. However, the maximum of interaction between the absorber and photons occurs in the physical area occupied by the inclusion. Hence, the inclusion can be localized in the angular domain by identifying the angle that corresponds to highest values of RER in spectro-angular maps. When the phantom was measured with 700-nm Au NPs based inclusion, a pattern shown in Fig. 7(a) was obtained. (Note that two different phantoms were used for testing the two types of Au NPs.) The spectrum taken along the angle corresponding to the inclusion’s direction is shown in Fig. 7(b). The position of the peak matches the one from Fig. 3(a) for the 700-nm Au NPs absorption spectrum. However, some new features can be seen in Fig. 7(a). In addition to the main peak in RER observed at , two more peaks of smaller intensity are delineated by the contour lines: one at and the other at . Since this experimental setup was shown earlier to produce single RER peaks when applied for detection of localized inclusions in homogeneous Intralipid phantoms, appearance of multiple RER peaks in the porcine phantom might be due to well-pronounced heterogeneity of the phantom. Indeed, Fig. 2(a) and 2(b) shows distinct regions of white-colored structures incorporated between porcine muscle fibers. These structures represent fat. Scattering on these structures would change the angular distribution of photons especially when photons encounter them on the way from the inclusion’s location to the detector. As a result, anisotropic scattering by local heterogeneities would occur at some preferential angles that appear in spectro-angular maps as secondary or satellite peaks. Since every piece of phantom has its own degree of heterogeneity and local organization, the presence and angular positions of such secondary peaks may differ from phantom to phantom. Fig. 7(a) Contour plot of the spectro-angular map of the RER of capillary formed Au NPs target with 700-nm plasmon resonance in the porcine phantom. (b) The spectrum corresponding to angle. Source–detector separation 15 mm, detector–target separation 5 mm, target angle .  Next, using the fresh phantom the inclusion was placed at 10 mm distance from the detector keeping all other parameters the same, and the measurements were repeated for both types of Au NPs solutions. For this distance, the same phantom was used for measurements of both types of Au NPs (756 and 700 nm) with the capillary tubes inserted to the same location. The spectro-angular map along with the spectrum measured along the angle of the maximum extinction is presented in Fig. 8(a) and 8(b) for 756-nm Au NPs and in Fig. 9(a) and 9(b) for 700-nm Au NPs. The spectro-angular map for the 756-nm Au NPs inclusion [Fig. 8(a)] shows two peaks: the main peak of high intensity around pointing to the physical location of the inclusion (dotted line) and the secondary peak of lower intensity around 60 deg that can be linked to local heterogeneities present in the sample. The spectrum taken along the angle corresponding to maximum extinction [Fig. 8(b)] shows the characteristic plasmon peak around 750 nm and allows identification of the inclusion although with reduced values of the RER and increased level of noise. Fig. 8(a) Contour plot of the spectro-angular map of the RER of capillary formed Au NPs target with 756-nm plasmon resonance in the porcine phantom. (b) The spectrum corresponding to angle. Source–detector separation 15 mm, detector–target separation 10 mm, target angle .  Fig. 9(a) Contour plot of the spectro-angular map of the RER of capillary formed Au NPs target with 700-nm plasmon resonance in the porcine phantom. (b) The spectrum corresponding to angle. Source–detector separation 15 mm, detector–target separation 10 mm, target angle .  Replacing 756-nm Au NPs inclusion with 700-nm Au NPs inclusion resulted in expected changes in the spectral signature of the inclusion by shifting the maximum of RER from to [Fig. 9(a) and 9(b)]. However, the angular pattern remained virtually the same as in Fig. 8(a) demonstrating the highest peak around and the smaller peak around 60 deg. It confirms the previously made assumption that observed secondary peaks are phantom specific and are preserved for the same phantom. To mimic the effect of actual in vivo distribution of Au NPs in biological tissues, we injected Au NPs directly into the porcine tissue with a syringe. Such injections are known to produce irregular diffused distributions which depend on the tissue morphology as well as injection procedure.27 The volume of injection was kept the same as the volume of the localized inclusion in the capillary tube. The spectro-angular plot for the 756-nm Au NPs based inclusion obtained by a direct injection to the phantom at and 10 mm distance from the detector is shown in Fig. 10(a). Figure 10(b) contains the spectrum taken along the angle corresponding to the maximum value of RER. Figure 10(a) demonstrates that in addition to the absolute maximum of RER observed around a few satellite peaks can be seen for RER at , , , and 125 deg. While the location of the main maximum at agrees well with the injection point [shown with the dotted line in Fig. 10(a)], all other maxima produce satellite signatures of the inclusion in some other directions. The spectrum taken along the direction of the main maximum () demonstrates a noticeable spectral broadening and a possible red shift in the position of the plasmon resonance (from to ). The spectra (not shown) taken along the directions of the satellite peaks produce similar spectral signatures but with reduced RER values. Spectral broadening and a red shift indicate a possible aggregation of NPs and the change of the dielectric environment around them, correspondingly. We believe that the origin of satellite peaks observed in this measurement can be linked not only to local heterogeneities as discussed earlier but to the uneven spatial distribution of Au NPs. Since it is known27 that diffusion of the injected material (Au NPs in our case) produces dendritic-like 3-D structures, such structures may contribute to the multiangular signatures observed in the current work. Fig. 10(a) Contour plot of the spectro-angular map of the RER of syringe injection formed Au NPs target with 756-nm plasmon resonance in the porcine phantom. (b) The spectrum corresponding to angle. Source–detector separation 15 mm, detector–target separation 10 mm, target angle .  Once the position of the inclusion was moved to a 15-mm distance from the detector, no signature of plasmon resonances in spectro-angular maps could be detected indicating that the ability to detect the presence and localize the inclusion in the angular domain was lost. We also checked all other angles in the entire 360-deg interval around the detector, and detection capabilities with some differences were found to be similar to the reported values. 4.DiscussionGiven nearly the same concentration of both types of Au NPs in all experiments ( or ) the detection level of in a volume located 10 mm from the radiance detector was demonstrated in the porcine phantom. These numbers have very important implications for diagnostic imaging with Au NPs as contrast agents. With functionalization by proper surface ligands, Au NPs have been reported to be used as contrast agents in CT to detect cancer in cell cultures and soft tissues.4,11,12 In CT imaging contrast medium increases X-ray absorption resulting in the enhancement of anatomical structures due to higher attenuation. The concentration of Au NPs in the tumor area should be high enough to produce a noticeable difference in attenuation between normal and malignant tissues. In fact, to produce an easily measured contrast () in soft tissues, a very high density of Au NPs () was required.4 In another article, the loaded density of Au resulted in 190 HU contrast for the tumor while the actual density of Au was not reported.11 In micro-CT microlocalization studies,12 produced 159 HU in the whole tumor area while tumor periphery exhibited with 310 HU. We added all these data to the calibration plot from Hainfeld et al.12 and presented the resulting plot in Fig. 11. Since sometimes it is informative to present a concentration of Au NPs rather than a density of Au used, we also added the additional dual-scaled axis on the right for the plot in Fig. 11. Two different scales converted the density of Au () from the axis on the left to the concentration () of 15-nm spherical Au NPs (used in Ref. 12) and Au nanorods (used in Ref. 4 and the current work). The concentration of Au NPs used in our experiments () was lower by a factor of than used in CT measurements4 and could not be detected using clinical CT. To confirm it, the porcine phantom with the inserted 3 mm capillary tube filled with Au NPs solution was imaged with CT (GE Discovery STE 16). Images were acquired using scanning parameters of 120 kVp, 250 mAs, and a reconstructed slice thickness of 1.3 mm. Fig. 11Calibration plot adapted from Hainfeld et al.12 with added dual-scale axis on the right and superimposed with data from other authors and current work. Dual scale on the right corresponds to 15-nm diameter Au spheres (labeled as “spheres”) and Au nanorods (labeled as “rods”). The size of nanorods from Popovtzer et al.4 was nearly identical to the one used in calculation.  The measured attenuation of the porcine tissue (68 HU) was very close to that of human prostate (40 to 60 HU).28 The attenuation of the capillary with Au NPs solution was 3 HU, which corresponds to the water range (). According to the calibration plot in Fig. 11, should give 3 HU which agrees well with our value presented as a red circle. While not confirmed experimentally, it was estimated by Hainfeld et al.12 that minimum of Au NPs was required to produce the minimally detected contrast of 8 HU in soft tissues, which can be detected on a typical CT scanner. This value is still higher by a factor of than the density used in our optical experiments. Thus, our results indicate that the presented radiance-based approach can detect much smaller concentrations of Au NPs in soft tissues meaning that with the same labeling efficiency and the number of overexpressed receptors on the cellular surface much fewer cells can be detected. Simple estimations provide the supporting numbers as follows. The most abundant cancer-associated cell surface targets, such as prostate-specific membrane antigen (PSMA) are expressed at approximately sites per cell.29 Considering a broad typical range of uptake values of to Au NPs per cell, detecting Au NPs as in the current work would correspond to detecting about to malignant cells in the prostate. These numbers are very close to the ideal target of malignant cells that corresponds to a transition from diffusion-limited nutrition to neovascularization labeled as angiogenic switch.13 Hence, the technique may offer a promising potential in early cancer detection in the human prostate with Au NPs serving as cancer-specific molecular contrast agents. To extend the distance at which Au NP based inclusion is detected, several steps can be implemented. First, to take full advantage of the knowledge of the biomedical transparency window for a specific tissue (porcine, in the current study), the plasmon resonance of Au NPs can be fine-tuned to the most optimal wavelength ( for the porcine phantom) as can be seen from Fig. 5(b). Second, the photon budget in the tissue can be increased by employing more powerful broadband near-infrared light sources. For prostate application, the initial step would be to take the reference measurement of the bare prostate before introducing Au NPs into the body of a patient. This measurement would be done in a minimally invasive way by placing the radiance based endoscope into the urethra and the illuminating fiber based endoscope into the rectum. This is clinically feasible since this step would be very similar to standard intraurethral cystoscopy and transrectal ultrasound-guided prostate biopsy (TRUS-PB) procedures commonly performed in the urological office under local anesthesia (lidocaine) or without any anesthesia.30,31 It would take about 10 min or less to perform the complete radiance measurement which does not exceed typical times for performing cystoscopy. After administering Au NPs, it may take up 6 h to see the accumulation in the targeted organ depending on the delivery method, Au NPs surface preparation, and the targeted organ.32 Hence, we envision that measurements of the tissue with Au NPs can be performed after the selected time interval (i.e., 6 h) after the administration. Such time intervals are not uncommon for clinical diagnostic procedures such as the radioactive iodine uptake test—RAIU (test is from 6 to 24 h after uptake of radioactive iodine) or bone scan (test is from 3 to 4 h after uptake of radioactive technetium). Also, in the treatment of most cancers with the photodynamic therapy (PDT) the interval between drug and light administration can be of the order of 24 to 72 h.33 While the current study demonstrates the 2-D map information, the proposed technique can be extended for 3-D applications. For this purpose, the spherical diffuser in the light source has to be replaced by a cylindrical diffuser to ensure a uniform illumination of the entire phantom (or prostate). Then, incrementally translating the detecting fiber in a vertical direction and collecting the spectro-angular map at every new position would generate a stack of 2-D maps assigned to a certain depth inside the phantom. Such extension would provide additional information about inclusion’s localization in a vertical direction but will add extra time to the overall procedure. Finally, we would like to add that in order achieve a complete characterization of the Au NPs based inclusion, spectral identification and the angular coordinate must be complemented with the radial coordinate and a value of Au NP density. It is attractive to relate the measured values of RER to optical properties of the localized inclusion in a similar way as was suggested for nonscattering inclusions (voids) in turbid media.26 Linking RER to the absorption coefficient of Au NPs would allow extracting data on the concentration of Au NPs using theoretical values of the absorption cross-section for a plasmon nanoparticle of known geometry. In order to obtain the precise relation between RER and optical properties of the localized inclusion further developments in the perturbation approach34,35 for radiance are required. Alternatively, one can construct some empirical or semi-empirical relation between the concentration and RER but it would require a priori knowledge of inclusion’s location relative to the source and the detector. Indeed, the measured values of RER depend not only on the concentration of Au NPs but corresponding distances i.e., the detector–target separation and the source–target separation. Varying the source–target separation would expose the same concentration of Au NPs to different illumination levels. Keeping the same source–target separation and varying the detector–target separation would affect the collection efficiency of the detector. We are currently working on developing approaches to extract the distance-related information from radiance measurements. Once the distance to the target is known, we will concentrate on constructing an empirical relation between the measured parameters and the concentration of Au NPs. 5.ConclusionsThese proof of principle experiments demonstrated that a radiance-based approach can identify, through spectro-angular mapping, the presence of Au NPs deeply embedded into porcine tissues (15 mm source–detector separation, 10 mm detector–target separation). The detection level of particles in volume corresponds to or , that is lower by a factor of 60 than the concentration of Au NPs required to produce a significant contrast () relative to the typical soft tissue background level (20 to 70 HU) in CT images. The proposed method can be employed for in vivo early diagnostics of prostate cancer when functionalized Au NPs bind specifically to cancer tissues thus delineating cancer lesions. ReferencesL. R. Hirschet al.,
“Nanoshell-mediated near-infrared thermal therapy of tumors under magnetic resonance guidance,”
Proc. NATL Acad. Sci. U.S.A., 100
(23), 13549
–13554
(2003). http://dx.doi.org/10.1073/pnas.2232479100 PNASA6 0027-8424 Google Scholar
E. B. Dickersonet al.,
“Gold nanorod assisted near-infrared plasmonic photothermal therapy (PPTT) of squamous cell carcinoma in mice,”
Cancer Lett., 269
(1), 57
–66
(2008). http://dx.doi.org/10.1016/j.canlet.2008.04.026 CALEDQ 0304-3835 Google Scholar
K. Sokolovet al.,
“Real-time vital optical imaging of precancer using anti-epidermal growth factor receptor antibodies conjugated to gold nanoparticles,”
Cancer Res., 63
(9), 1999
–2004
(2003). CNREA8 0008-5472 Google Scholar
R. Popovtzeret al.,
“Targeted gold nanoparticles enable molecular CT imaging of cancer,”
Nano Lett., 8
(12), 4593
–4596
(2008). http://dx.doi.org/10.1021/nl8029114 NALEFD 1530-6984 Google Scholar
X. H. Huanget al.,
“Cancer cell imaging and photothermal therapy in the near-infrared region by using gold nanorods,”
J. Amer. Chem. Soc., 128
(6), 2115
–2120
(2006). http://dx.doi.org/10.1021/ja057254a JACSAT 0002-7863 Google Scholar
D. B. Chithraniet al.,
“Gold nanoparticles as radiation sensitizers in cancer therapy,”
Radiat. Res., 173
(6), 719
–728
(2010). http://dx.doi.org/10.1667/RR1984.1 RAREAE 0033-7587 Google Scholar
G. HanP. GhoshV. M. Rotello,
“Functionalized gold nanoparticles for drug delivery,”
Nanomedicine, 2
(1), 113
–123
(2007). http://dx.doi.org/10.2217/17435889.2.1.113 1743-5889 Google Scholar
S. D. Brownet al.,
“Gold nanoparticles for the improved anticancer drug delivery of the active component of oxaliplatin,”
J. Am. Chem. Soc., 132
(13), 4678
–4684
(2010). http://dx.doi.org/10.1021/ja908117a JACSAT 0002-7863 Google Scholar
D. PissuwanT. NiidomeM. B. Cortie,
“The forthcoming applications of gold nanoparticles in drug and gene delivery systems,”
J. Controll. Rel., 149
(1), 65
–71
(2011). http://dx.doi.org/10.1016/j.jconrel.2009.12.006 JCREEC 0168-3659 Google Scholar
W. P. FaulkG. M. Taylor,
“Immunocolloid method for electron microscope,”
Immunochemistry, 8
(11), 1081
(1971). http://dx.doi.org/10.1016/0019-2791(71)90496-4 IMCHAZ 0019-2791 Google Scholar
T. Reuveniet al.,
“Targeted gold nanoparticles enable molecular CT imaging of cancer: an in vivo study,”
Int. J. Nanomed., 6 2859
–2864
(2011). IJNNHQ 1178-2013 Google Scholar
J. F. Hainfeldet al.,
“Micro-CT enables microlocalisation and quantification of Her2-targeted gold nanoparticles within tumour regions,”
Br. J. Radiol., 84
(1002), 526
–533
(2011). http://dx.doi.org/10.1259/bjr/42612922 BJRAAP 0007-1285 Google Scholar
J. V. Frangioni,
“New technologies for human cancer imaging,”
J. Clin. Oncol., 26
(24), 4012
–4021
(2008). http://dx.doi.org/10.1200/JCO.2007.14.3065 JCONDN 0732-183X Google Scholar
P. K. Jainet al.,
“Calculated absorption and scattering properties of gold nanoparticles of different size, shape, and composition: applications in biological imaging and biomedicine,”
J. Phys. Chem. B, 110
(14), 7238
–7248
(2006). http://dx.doi.org/10.1021/jp057170o JPCBFK 1520-6106 Google Scholar
W. Qianet al.,
“Dark-field light scattering imaging of living cancer cell component from birth through division using bioconjugated gold nanoprobes,”
J. Biomed. Opt., 15
(4), 046025
(2010). http://dx.doi.org/10.1117/1.3477179 JBOPFO 1083-3668 Google Scholar
S. R. Arridge,
“Optical tomography in medical imaging,”
Inverse Problems, 15
(2), R41
–R93
(1999). http://dx.doi.org/10.1088/0266-5611/15/2/022 INPEEY 0266-5611 Google Scholar
T. Durduranet al.,
“Diffuse optics for tissue monitoring and tomography,”
Rep. Prog. Phys., 73
(7), 76701
–76743
(2010). http://dx.doi.org/10.1088/0034-4885/73/7/076701 RPPHAG 0034-4885 Google Scholar
S. KrishnanP. DiagaradjaneS. H. Cho,
“Nanoparticle-mediated thermal therapy: evolving strategies for prostate cancer therapy,”
Int. J. Hyperthermia, 26
(8), 775
–789
(2010). http://dx.doi.org/10.3109/02656736.2010.485593 IJHYEQ 0265-6736 Google Scholar
J. A. Schwartzet al.,
“Selective nanoparticle-directed ablation of the canine prostate,”
Lasers Surg. Med., 43
(3), 213
–220
(2011). http://dx.doi.org/10.1002/lsm.21039 LSMEDI 0196-8092 Google Scholar
X. J. Zhanget al.,
“Enhanced radiation sensitivity in prostate cancer by gold-nanoparticles,”
Clin. Invest. Med., 31
(3), E160
–E167
(2008). CNVMDL 0147-958X Google Scholar
N. Chandaet al.,
“Radioactive gold nanoparticles in cancer therapy: therapeutic efficacy studies of GA-(198)AuNP nanoconstruct in prostate tumor-bearing mice,”
Nanomed.– Nanotechnol. Biol. Med., 6
(2), 201
–209
(2010). http://dx.doi.org/10.1016/j.nano.2009.11.001 1549-9634 Google Scholar
S. GrabtchakT. J. PalmerW. M. Whelan,
“Detection of localized inclusions of gold nanoparticles in Intralipid-1% by point-radiance spectroscopy,”
J. Biomed. Opt., 16
(7), 077003
(2011). http://dx.doi.org/10.1117/1.3597624 JBOPFO 1083-3668 Google Scholar
S. GrabtchakT. J. PalmerW. Whelan,
“Radiance spectroscopy tool box for characterizing Au nanoparticles in tissue mimicking phantoms as applied to prostate,”
J. Cancer Sci. Ther., S1 008
(2011). JCSTGU 1948-5956 Google Scholar
S. Grabtchaket al.,
“Experimental spectro-angular mapping of light distribution in Intalipid-1%,”
J. Biomed. Opt., 17
(6), 067007
(2012). http://dx.doi.org/10.1117/1.JBO.17.6.067007 JBOPFO 1083-3668 Google Scholar
S. Prahl,
“Tabulated Molar Extinction Coefficient for Hemoglobin in Water,”
(1998). http://omlc.ogi.edu/spectra/hemoglobin/ Google Scholar
S. Grabtchaket al.,
“Radiance detection of non-scattering inclusions in turbid media,”
Biomed. Opt. Express, 3
(11), 3001
–3011
(2012). http://dx.doi.org/10.1364/BOE.3.003001 BOEICL 2156-7085 Google Scholar
S. L. Chowninget al.,
“A preliminary analysis and model of prostate injection distributions,”
Prostate, 66
(4), 344
–357
(2006). http://dx.doi.org/10.1002/(ISSN)1097-0045 PRSTDS 1097-0045 Google Scholar
J. Gossner,
“Computed tomography of the prostate—a review,”
Intern. J. Radiol., 14
(1),
(2012). Google Scholar
P. M. Smith-Joneset al.,
“In vitro characterization of radiolabeled monoclonal antibodies specific for the extracellular domain of prostate-specific membrane antigen,”
Cancer Res., 60
(18), 5237
–5243
(2000). CNREA8 0008-5472 Google Scholar
G. N. Collinset al.,
“The effect of digital rectal examination, flexible cystoscopy and prostatic biopsy on free and total prostate specific antigen, and the free-to-total prostate specific antigen ration in clinical practice,”
J. Urol., 157
(5), 1744
–1747
(1997). http://dx.doi.org/10.1016/S0022-5347(01)64849-3 JOURDD 0248-0018 Google Scholar
S. F. Matinet al.,
“Office cystoscopy and transrectal ultrasound-guided prostate biopsies pose minimal risk: prospective evaluation of 921 procedures,”
Urology, 73
(6), 1175
–1178
(2009). http://dx.doi.org/10.1016/j.urology.2008.12.068 0090-4295 Google Scholar
G. F. Paciottiet al.,
“Colloidal gold: a novel nanoparticle vector for tumor directed drug delivery,”
Drug Deliv., 11
(3), 169
–183
(2004). http://dx.doi.org/10.1080/10717540490433895 DDELEB 1521-0464 Google Scholar
D. DolmansD. FukumuraR. K. Jain,
“Photodynamic therapy for cancer,”
Nat. Rev. Cancer, 3
(5), 380
–387
(2003). http://dx.doi.org/10.1038/nrc1071 NRCAC4 1474-175X Google Scholar
S. C. FengF. A. ZengB. Chance,
“Photon migration in the presence of a single defect—a perturbation analysis,”
Appl. Opt., 34
(19), 3826
–3837
(1995). http://dx.doi.org/10.1364/AO.34.003826 APOPAI 0003-6935 Google Scholar
S. B. Colaket al.,
“Tomographic image reconstruction from optical projections in light-diffusing media,”
Appl. Opt., 36
(1), 180
–213
(1997). http://dx.doi.org/10.1364/AO.36.000180 APOPAI 0003-6935 Google Scholar
|


