|
|
1.IntroductionIn clinical dental practice, adhesive defects between tooth substance and composite (Composite: type of synthetic resins which is used in dentistry as adhesives.) restorations [interfacial (Interface: boundary between adjacent substances or phases.) defects], which adversely affect restoration quality, cannot be avoided due to polymerization shrinkage, different thermal expansion of tooth substance and composite, and composite degradation.1 A longitudinal assessment of this interface would therefore be beneficial for revealing degradation effects in the bonding interface over time. During mastication, saliva and other liquids may enter the gaps under pressure, resulting in detachment of the adhesive interface, or deformation of restoration margins.2 This in turn may allow further penetration of saliva and microorganisms into the tooth—composite interface, bringing discoloration, hypersensitivity, plaque accumulation, and may potentially lead to the development of a caries lesion, which is the main reason for composite restorations to be replaced.3 However, this costly procedure can be delayed as long as possible with early detection and monitoring of gap or defect progression adjacent to restorations. The detection and assessment of interfacial gaps together with longitudinal monitoring of gap progression are therefore of great clinical significance. However, it is difficult to visually detect or assess gaps at the tooth—composite interface before large defects occur. Another important focus of assessment is to differentiate between merely discolored gaps4 on the one hand and defects with additional active carious damage on the other. Radiography is the most frequently used supplementary diagnostic technique, but it offers limited information about marginal discrepancies or gaps in adhesively luted composite restorations. It has been reported that the radiographic marginal gap detection frequently results in false positive or false negative results,5 which can lead to unnecessary intervention or undertreatment. Micro-computer tomography addresses these issues in vitro, as it has the disadvantage of exposing the specimen to high radiation hazards and therefore, is far from ready for clinical application. New noninvasive imaging methods enabling surface and subsurface assessment of composite restorations are therefore desirable. Optical coherence tomography (OCT) is an imaging method using low coherence interferometry. The principle upon which it is based has already been described in numerous publications.6–9 Light is split into two arms—a sample arm (at the end of which lies the observed object) and a reference arm. The interference of scattered/reflected light from the sample arm and reference arm gives rise to an interference pattern.6,10 This tomographic method allows contact-free nondestructive real time imaging with high, micron-scale resolution by analyzing the echo time delay, and intensity of light backscattered by internal microstructures in objects. In addition, the method generates data sets for three-dimensional volumetric images without high-risk radiation, making it suitable for in vivo applications. The aim of this study was to evaluate the suitability of swept source OCT (SS-OCT) at a 1325-nm center wavelength to nondestructively assess interfacial adhesive defects in terms of size and frequency and to characterize defective structures in composite restorations. The study prepared specimens with an adhesive defect at the tooth—composite interface as validation objects, and hypothesizes that SS-OCT is suitable for detecting and assessing adhesive defects at the composite—tooth interface and for imaging morphological details inside composite restorations up to a depth of 3.0 mm. 2.Materials and Methods2.1.Preparation of SpecimensTen intact, extracted caries-free human molars were selected and immersed in 0.5% chloramine solution at 4°C immediately after extraction. The teeth were cleaned mechanically. Standardized, box-shaped class V cavities (Class V cavities: cavities on the junction of the crown and root.) with dimensions of 3 mm coronal-apically, 4 mm mesio-distally, and 1.5 mm in depth in average were prepared with a rounded cylindrical diamond bur (107 μm, 836 KR 314014, Komet®/Gebr. Brasseler, Lemgo, Germany) (Fig. 1). The cavities were placed at the vestibular cement–enamel junction in order to provide an equally extended cavity margin at crown (enamel) and root (dentine). The cavity margins in crowns were 0.5 mm beveled, whereas the cavity margins in root were left as a butt joint. Indirect composite inlays (Grandio, Voco GmbH, Cuxhaven, Germany) were inserted without the use of an adhesive. Additionally, the inner surfaces of the inlays were polished to produce a gap between restoration and tooth [Fig. 2(a)]. The intention was to make validation reliable, as it was known that the specimens had a gap along with the entire internal interface. Three regions of interest were marked with small dots in each restoration to define reference planes through the inlays. Fig. 1General overview of specimen showing position and extent of class V cavity. (a) Frontal view and (b) cross sectional view. Class V cavity marked in blue. Class V cavity was prepared at the junction between crown and root (dotted line) measuring (1.5 mm in depth). Also shown are tooth cardinal directions: “apical”—the direction toward the root tip of a tooth; “coronal”—the direction toward the crown of a tooth; “distal”—the direction toward the last tooth in each quadrant of a dental arch; and “mesial”—the direction toward the frontal midline in a dental arch. EDJ: enamel–dentin junction. 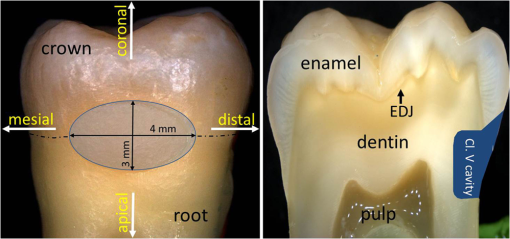 Fig. 2Schematic depiction of the experiment. (a) Preparation of class V cavity and indirect composite inlay, polishing of the inner surface of inlay, insertion of inlay without the use of adhesive. (b) Acquisition of OCT B-scans of inlay. (c) A total of 512 B-scans in coronal-apically aligned planes (dotted blue lines) through the composite inlay were acquired. (d) Embedding of specimen and preparation of cross sections. (e) Histological analysis using light microscopy. 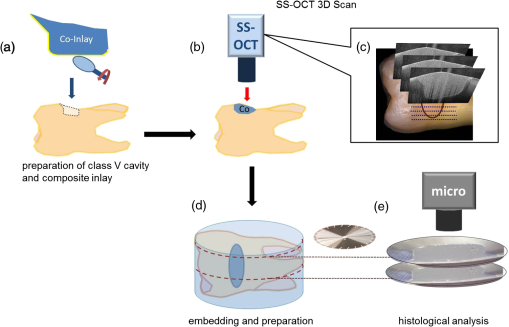 2.2.SS-OCT ImagingThe restorations were imaged by SS-OCT (OCS1300SS, Thorlabs Inc., New Jersey, USA, Thorlabs GmbH Dachau, Germany) [Fig. 2(b) and 2(c)]. Table 1 summarizes the specifications of the equipment. SS-OCT is a variant of Fourier domain OCT. This technique uses a tunable light source with a narrow wavelength spectrum. The axial resolution is achieved by tuning/sweeping this small spectral bandwidth through the full tunable spectral range of the light source. The detector measures the intensities of the different narrow wavelength packages sequentially as a function of time to acquire the full interference spectrum. By executing a Fourier-transform operation of the acquired signal, the determined frequencies and amplitudes give the depth information of the sample at one point. In the given approach, SS-OCT provided the combination of high imaging depth, moderate speed, and moderate resolution. Table 1Technical specification of the used SS-OCT.
2.3.Preparation of Specimen for Histological InvestigationThe specimens were embedded in Stycast® compound (Emerson & Cuming, Westerlo, Belgium) and sectioned along with the reference planes using a microtome (thickness: 200 μm, Leitz 1600 sawing-microtome, Ernst Leitz Wetzlar GmbH, Wetzlar, Germany). Histological sections were then imaged with a light microscope (Stemi 2000-C, Carl Zeiss Microscopy GmbH, Germany) to compare with the OCT B-scans with regard to morphological properties of teeth and composite inlays [Fig. 2(d) and 2(e)]. 2.4.Analysis of OCT and Histological ImagesThe images obtained by OCT were analyzed using ImageJ v1.45s (open source image processing and analysis in Java, Wayne Rasband, National Institutes of Health, Bethesda, Maryland, USA). A meaningful OCT signal was defined as a higher signal intensity compared to the surrounding area at the interface between tooth and composite inlay. This is in accordance with the findings of Makishi et al. who confirmed that the presence of gaps caused sharp signal growth due to reflected light at the phase boundaries of media of highly different refractive indices (i.e., air and composite).11 This determination was performed visually by expert judgment as is common practice with in vivo imaging-based diagnostic techniques (e.g., interpretation of x-ray or ultrasound images). The OCT signal lengths were measured at the enamel-composite interfaces at the bevel and at the cavity floor-composite interfaces at dentin by means of three mesio-distally oriented B-scans per tooth. The cavity walls parallel to the laser beam were excluded from the evaluation due to there being no phase boundary in the path of the laser beam, and thus OCT producing no or unreliable signals of the gap. We defined the cavity floor—composite interfaces as being between both line angles (Line angle: junction of two surfaces of a tooth or of two walls of a tooth cavity.) of the cavity. The lengths of the gap-induced signals at the enamel margins and at the cavity floor were placed in relation to the total length of these interfaces and expressed as a percentage of total enamel margin- or floor-length, respectively (Fig. 3). Weighted average values of gap-induced signals (length, %) at enamel and dentin, respectively, were determined from 30 OCT B-scans. To determine the reproducibility of the measurement, this was repeated four consecutive times by the main observer with a minimum break of 1 week between the sessions (intra-observer analysis). Mean value as well as standard deviation and standard error of the mean (SEM) were determined. Fig. 3OCT B-scans showing a cross section at the regions of interest. Bright lines indicate the signals for interfacial gaps. (a) The beveled enamel lies between the two red arrows while the cavity floor is between the yellow arrows. The dashed white lines indicate the extended cavity walls and floor axes. An imaginative line (dashed red lines) running from the junction of the extended axes, perpendicular to the cavity floor/wall (blue curves) defines the floor end (yellow arrows). (b) White triangles indicate the walls of the cavity which exhibit no clear signal/bright line due to their parallel orientation to the laser beam. The dotted lines indicate lengths of gap-induced OCT signals at the enamel margin (red) and at the cavity floor (yellow). Air entrapments between composite layers (asterisk), E: enamel, D: dentin, and C: composite inlay. 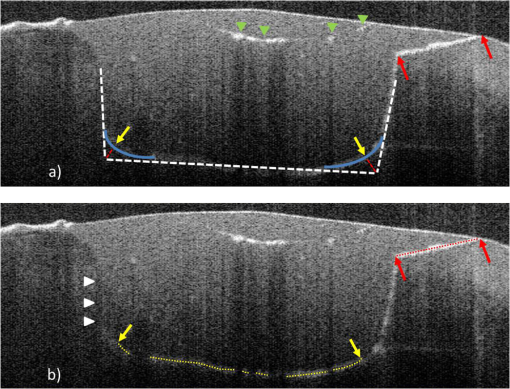 The objectivity of the measurement was achieved by an inter-observer analysis and reproducibility was analyzed. The main observer plus three other observers (two personnel with OCT experience, one person with no prior experience in image-based diagnostics) reassessed 15 OCT B-scans randomly selected from the original set of 30 B-scans. Analogous to the intra-observer analysis, weighted average values of gap-induced signal lengths were determined by each observer. Measurements were repeated two consecutive times by each observer and mean value as well as standard deviation and standard error of the mean were determined. Characteristics of further deficiencies in the composite restorations, such as air entrapments/large porosities or incomplete adaptation between composite increments, were also noted. 3.ResultsSS-OCT B-scan images with the corresponding histological images are shown in Fig. 4. The -axis represents the width of the scan field (512 pixels, 7 mm) and the -axis represents the penetration depth of the OCT signals, which is dependent on the refractive index of the materials (512 pixels, up to 2.5 mm). On the OCT B-scans, the interfacial gaps between inlay and tooth showed as single or double lines with increased brightness/signal intensity. About (SEM: 0.79) of the total gap length was detected at the enamel interface and (SEM: 0.17) at the dentin interface. Inter-observer measurement errors of weighted means were 6.21% and 4.25% at enamel and dentin, respectively. Double lines in OCT images corresponded to gap widths of approximately 60 μm in light microscopy, whereas gap width in general ranged from 30 to 270 μm in this experimental setup. Fig. 4OCT B-scans (d, e, and f) and light microscopic images of the corresponding cross sections (a, b, and c). Single or double line signals with high brightness indicate gaps at the composite—tooth interface (white arrows). (a and d) Yellow arrows indicate marginal gaps. (b and e) Enlargement of a section at cavity floor with structures and corresponding signals. (c and f) Enlargement of a restoration margin with excess of composite material (red arrows) and air entrapment between composite layers (blue arrows). E: enamel, D: dentin, and C: composite inlay. 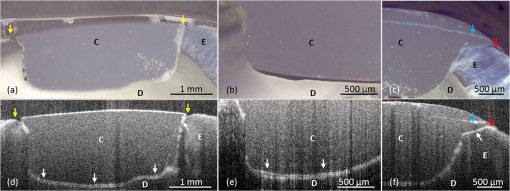 OCT was able to show the enamel–dentin junction in 25 of 30 specimens [Fig. 5(a) and 5(b)]. Air entrapments or large porosities in the composite were shown as dark areas with bright outlines [Fig. 5(a) and 5(b)]. Micro-cracks in enamel and increment borders in composite layers were visible as lines of increased signal intensity [Fig. 5(c) and 5(d)]. Fig. 5OCT B-scans (c and d) with corresponding optical microscopic images (a and b). Air entrapments (red arrows), enamel–dentin junction (blue arrows), micro-cracks in enamel (yellow arrows), increment borders of the composite layers (white arrows), excess of composite material (green arrows). E: enamel, D: dentin, and C: composite inlay. 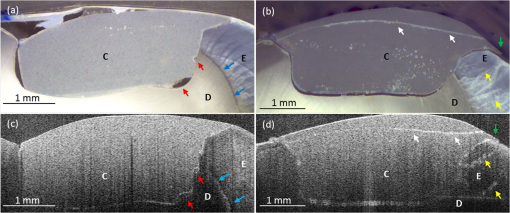 4.DiscussionIn recent years, it has been reported that OCT can be used for imaging dental tissues and dental diseases.12–14 These studies highlighted the potential of OCT for clinical dental application, including the diagnosis of periodontal disease and detection of carious lesions.12,13 It has subsequently been used in vitro to assess progression of carious lesions.14 Additionally, OCT has been tested as a method for investigating the integrity of dental sealants15 and tested for its ability to evaluate the adaptation of composite restorations.11,16 In latter studies, interfacial gaps along with the cavity were detected with great accuracy by OCT, showing the potential of the method for detecting gaps around tooth–composite restorations.11,16 The suitability of OCT for gap detection is based on the large differences in refractive indices inherent to the gap area (). A gap at dental composite restorations is characterized by a composite to air ( versus )17 and an air to enamel ()18 or air to dentin ()18 interface. This gives rise to increased light scattering and reflection and OCT signals at the gap interfaces. Our results well confirmed this by showing a probability of detection of 0.80 for interfacial defects at enamel and 0.71 at dentin. On OCT B-scans, gaps showed as single or double lines depending on gap width. Based on the manufacturer’s specification which states an axial resolution of 12 μm, gaps down to 24 to 36 μm (accounting for discretization) should ideally be resolved as double lines. We found that double lines on OCT B-scans represented adhesive defects with a gap width measuring . We could demonstrate this reproducibly using light microscopy. Comparing these results with the value of 0.69 for gap detection at enamel and dentin as reported by Makishi et al. [SS-OCT data validated with confocal laser scanning microscopy (CLSM)],11 it is assumed that their lower value in the comparable case without contrast agent could be due to their definition of gaps being more stringent (any interfacial spaces in width, as observed in CLSM images) and clearly below the expected resolution of OCT, thus lowering sensitivity. Moreover, artificial interfacial defects probably introduced during specimen preparation was a differentiating factor to our studies probably having led to greater gap lengths observed by CLSM. It is noted, although, that with our approach we were not able to determine the rate of false positive diagnoses due to the absence of gap-free interfaces. This will have to be determined in subsequent studies before OCT’s ability to reliably detect gaps can be conclusively proven. To our knowledge, no other nondestructive diagnostic methods suited for gap detection and assessment along with the cavity walls and cavity floors have been systematically assessed. Therefore, we cannot directly compare our findings with other data. For a general comparison, sensitivities of established dental methods for other areas of caries detection are presented for informational purposes:19
Compared to these techniques, the detection rate of OCT in our study is on a high level. We noted that air entrapments/large porosities in the composite layers caused significant OCT signal loss, impairing the probability to detect interfacial gaps underneath (Fig. 3). However, we predict more reliable detection of gaps when beaming direction is varied during imaging to circumvent shading effects. Moreover the detection of air entrapments, porosities, and composite increment borders could be of additional benefit, because these defects are currently not clinical detectable and are potential weak spots of restorations. Thus, OCT will help assuring quality of restorative procedures and results both during and after placement. Other limitations of OCT that we encountered during our study were that structures located parallel to the laser beam were not visible. This problem can also again be overcome by varying the projection axis of the laser beam. Another phenomenon noted was that the image scale in the vertical-/depth direction of OCT images varies depending on the refractive index of the different materials. The equipment used enabled us to confirm that SS-OCT has an average penetration depth of up to 2.5 mm in dental hard tooth tissues. With an enamel thickness of up to 2.5 mm, this is generally sufficient to display the EDJ and adjacent dentin structures. It is assumed that in clinical practice, penetration depth and resolution will also be influenced by additional factors such as plaque, stain or calculus on the tooth surface, and hydration. These phenomena represent additional face boundaries, therefore cleaning and air drying of the tooth surface is expected to be necessary to achieve best performance. The results of this study demonstrate the potential of OCT imaging to nondestructively and noninvasively detect and assess defects between hard tooth tissues and composite restorations, and to discover imperfections within the layered composite. Our results indicate that OCT could provide additional diagnostic information in single and longitudinal assessments of composite restoration. This technique offers the potential to longitudinally assess these restorations chair-side and to estimate whether detected defects are stable or changing. AcknowledgmentsThorlabs GmbH, Dachau, Germany for provision of the OCT equipment, Timothy Jones (IALT, University of Leipzig, Germany) for editorial assistance and Ms. Rueger for the professional technical assistance. ReferencesF. LutzI. KrejciF. Barbakow,
“Quality and durability of marginal adaptation in bonded composite restorations,”
Dent. Mater., 7
(2), 107
–113
(1991). http://dx.doi.org/10.1016/0109-5641(91)90055-4 DEMAEP 0109-5641 Google Scholar
N. J. OpdamF. J. RoetersE. H. Verdonschot,
“Adaptation and radiographic evaluation of four adhesive systems,”
J. Dent., 25
(5), 391
–397
(1997). http://dx.doi.org/10.1016/S0300-5712(96)00048-6 JDENAB 0300-5712 Google Scholar
I. A. Mjör,
“The reasons for replacement and the age of failed restorations in general dental practice,”
Acta Odontol. Scand., 55
(1), 58
–63
(1997). http://dx.doi.org/10.3109/00016359709091943 AOSCAQ 0001-6357 Google Scholar
E. A. Kidd,
“Caries diagnosis within restored teeth,”
Adv. Dent. Res., 4
(1), 10
–13
(1990). 0895-9374 Google Scholar
R. Haaket al.,
“Detection of marginal defects of composite restorations with conventional and digital radiographs,”
Eur. J. Oral Sci., 110
(4), 282
–286
(2002). http://dx.doi.org/10.1034/j.1600-0722.2002.21271.x EJOSFY 0909-8836 Google Scholar
D. Huanget al.,
“Optical coherence tomography,”
Science, 254
(5035), 1178
–1181
(1991). http://dx.doi.org/10.1126/science.1957169 SCIEAS 0036-8075 Google Scholar
A. G. Podoleanu,
“Optical coherence tomography,”
Br. J. Radiol., 78
(935), 976
–988
(2005). http://dx.doi.org/10.1259/bjr/55735832 BJRAAP 0007-1285 Google Scholar
B. LiuM. E. Brezinski,
“Theoretical and practical considerations on detection performance of time domain, Fourier domain, and swept source optical coherence tomography,”
J. Biomed. Opt., 12
(4), 044007
(2007). http://dx.doi.org/10.1117/1.2753410 JBOPFO 1083-3668 Google Scholar
A. F. Fercher,
“Optical coherence tomography—development, principles, applications,”
Z. Med. Phys., 20
(4), 251
–276
(2010). Google Scholar
J. G. Fujimotoet al.,
“Optical coherence tomography: an emerging technology for biomedical imaging and optical biopsy,”
Neoplasia, 2
(1–2), 9
–25
(2000). http://dx.doi.org/10.1038/sj.neo.7900071 1522-8002 Google Scholar
P. Makishiet al.,
“Non-destructive 3D imaging of composite restorations using optical coherence tomography: marginal adaptation of self-etch adhesives,”
J. Dent., 39
(4), 316
–325
(2011). http://dx.doi.org/10.1016/j.jdent.2011.01.011 JDENAB 0300-5712 Google Scholar
B. Colstonet al.,
“Dental OCT,”
Opt. Express, 3
(6), 230
–238
(1998). http://dx.doi.org/10.1364/OE.3.000230 OPEXFF 1094-4087 Google Scholar
D. P. Popescuet al.,
“Assessment of early demineralization in teeth using the signal attenuation in optical coherence tomography images,”
J. Biomed. Opt., 13
(5), 054053
(2008). http://dx.doi.org/10.1117/1.2992129 JBOPFO 1083-3668 Google Scholar
D. Friedet al.,
“Imaging caries lesions and lesion progression with polarization sensitive optical coherence tomography,”
J. Biomed. Opt., 7
(4), 618
–627
(2002). http://dx.doi.org/10.1117/1.1509752 JBOPFO 1083-3668 Google Scholar
A. K. BrazC. M. AguiarA. S. Gomes,
“Evaluation of the integrity of dental sealants by optical coherence tomography,”
Dent. Mater., 27
(4), e60
–e64
(2011). http://dx.doi.org/10.1016/j.dental.2010.11.010 DEMAEP 0109-5641 Google Scholar
T. A. Bakhshet al.,
“Non-invasive quantification of resin–dentin interfacial gaps using optical coherence tomography: validation against confocal microscopy,”
Dent. Mater., 27
(9), 915
–925
(2011). http://dx.doi.org/10.1016/j.dental.2011.05.003 DEMAEP 0109-5641 Google Scholar
A. C. ShortallW. M. PalinP. Burtscher,
“Refractive index mismatch and monomer reactivity influence composite curing depth,”
J. Dent. Res., 87
(1), 84
–88
(2008). http://dx.doi.org/10.1177/154405910808700115 JDREAF 0022-0345 Google Scholar
Z. Menget al.,
“Measurement of the refractive index of human teeth by optical coherence tomography,”
J. Biomed. Opt., 14
(3), 034010
(2009). http://dx.doi.org/10.1117/1.3130322 JBOPFO 1083-3668 Google Scholar
J. D. BaderD. A. ShugarsA. J. Bonito,
“Systematic reviews of selected dental caries diagnostic and management methods,”
J. Dent. Educ., 65
(10), 960
–968
(2001). Google Scholar
|

