
|
|
1.IntroductionVisualizing the precise location and nature of the interactions between specific molecular species is of major interest to researchers who study protein complexes, lipids, and nucleic acids.1,2 However, the limited resolution of traditional optical imaging systems has made it challenging. Förster resonance energy transfer (FRET) is a distance-dependent process that transfers excited state energy from a donor molecule to an acceptor molecule through nonradiative dipole–dipole coupling.3 The FRET efficiency depends on the inverse sixth power of the separation distance , with a 50% transfer rate distance in the 1 to 10 nm range: where , , and are the donor fluorescence emission rate, the FRET rate from the donor to the acceptor, and other nonradiative decay rate of the donor, respectively. Therefore, FRET can be used as a molecular ruler of nanometer scale sensitivity for measuring the distance between biomolecules labeled with an appropriate donor and acceptor pair.Fluorescence microscopy of FRET in the context of an intact cell has proved invaluable in detection of nucleic acid hybridization as well as distribution and transport of lipids.4 Translation of these findings to a whole living organism will provide a more accurate characterization of biomolecular function because the heterogeneous expression of multiple physiological variables in a tissue volume cannot be fully reflected by an isolated cell.5,6 Unfortunately, the intensive light scattering of biological tissue beyond the depth of a few hundred microns precludes fluorescence imaging of FRET at greater depths with high spatial resolution.7,8 It remains a challenge for pure optical imaging to attain fine spatial resolution at depths beyond the optical diffusion limit. Photoacoustic tomography, which detects nonradiative decay, is an emerging biomedical imaging modality that can provide three-dimensional ultrasonically scalable images of biological tissue ranging from organelles to organs.8 When light is absorbed by molecules, nonradiative decay induces thermoelastic expansion and subsequent ultrasound waves, which are detected by an ultrasound transducer to form photoacoustic images. Ultrasonic detection is particularly advantageous in the optical diffusive regime, where traditional optical imaging modalities fail to achieve optical focusing. Photoacoustic tomography employs acoustic focusing or image reconstruction to overcome the optical scattering effect, enabling high-resolution, deep-penetration imaging in biological tissue.9–11 By exploiting the rich optical contrasts of biomolecules, photoacoustic tomography provides unmatched versatility for biological investigations of cells and for medical studies of living organisms.12–18 These include the measurement of dynamic cellular processes (such as red blood cell oxygen release), physiological processes (such as lymphatic uptake),19 and whole organ functional parameters (such as oxygen metabolism).20 Previously, we demonstrated the photoacoustic microscopy of FRET through a 1-mm thickness of mouse skin tissue.21 The result shows that, compared with confocal microscopy, photoacoustic microscopy offers better penetration into scattering biological tissue. Here, we demonstrate the photoacoustic tomography of FRET in 1-cm deep chicken breast tissue, which matches the imaging depths required for small animal FRET imaging. 2.Materials and MethodsThe method of photoacoustic imaging of FRET was reported in our previous article.21 FRET imaging involves nonradiative dipole–dipole interaction that transfers the excited state energy from a donor fluorophore to an acceptor chromophore.22 The excited state fluorophore generally decays through radiative and nonradiative pathways, generating fluorescence and thermal/photoacoustic emission, respectively. FRET adds another excited state decay mechanism with decay rate . The fluorescence quantum yield of the donor is determined by the ratio of the rate of fluorescence emission to the sum of all decay rates of the excited state: where is the fluorescence emission rate and is the sum of all decay rates. Therefore, FRET reduces the donor fluorophore quantum yield and leads to a decrease in the donor fluorescence intensity . In fluorescence imaging, we have where the subscripts and denote the presence of the donor and the acceptor, respectively.With a nonfluorescence acceptor (quencher), the transferred energy eventually decays through the acceptor’s nonradiative pathway, yielding a 100% conversion efficiency of the transferred energy to thermal/photoacoustic emission. Therefore, in the case of a quenching acceptor, FRET manifests itself through a reduction of donor fluorescence and a concomitant increase of the total photoacoustic signal. The FRET efficiency can be computed from photoacoustic measurement as follows21: The ratio of the fluorescence emission wavelength to the excitation wavelength accounts for the Stokes shift of fluorescence emission. For rhodamine 6G, is measured to be 1.20 at an excitation wavelength of 523 nm.21 The photoacoustic emissions and in Eq. (4) are attributed to the excited state energy from light absorbed by the donor fluorophore. However, the spectral overlap of the donor and acceptor required for FRET imaging leads to the acceptor bleed-through (ABT) contamination, i.e., the direct excitation of the acceptor at the donor’s excitation wavelength.23 Therefore, for quantitative treatment of FRET, the ABT background signal needs to be subtracted from the raw photoacoustic amplitude measured from the FRET dye system. The corrected photoacoustic signal at is obtained as follows: where is the raw photoacoustic amplitude measured from the FRET dye system at , and is the photoacoustic amplitude from the acceptor chromophore alone.Figure 1 is a schematic of the photoacoustic tomography system whose design and performance have been detailed previously.24,25 The photoacoustic tomography system employs a 512-element full-ring transducer array. The transducer array has a 5-MHz central frequency (80% bandwidth) and a 50-mm ring diameter. A tunable OPO laser (Newport, basiScan 280) with a 12-ns pulse duration and a 10-Hz pulse repetition rate was the illumination source. The laser beam was homogenized using an optical diffuser, and the maximum light intensity at the surface of the sample was approximately . Within the imaging plane, the system provided 0.10 to 0.25 mm tangential resolution and relatively uniform 0.10-mm radial resolution.26 The raw data from each element was first Wiener deconvolved to account for the ultrasonic transducer’s impulse response. A back-projection algorithm was then implemented using matlab to reconstruct photoacoustic images. We used solutions containing a controlled amount of donor rhodamine 6G and acceptor DQOCI to analyze FRET efficiencies. Seven stock ethanol solutions were prepared with concentrations of donor rhodamine 6G and acceptor DQOCI as tabulated in Fig. 2(a). Fluorescence imaging of the sample solutions sealed in glass tubes was performed.27 Figure 2(b) shows the fluorescence emission from solution containing only donor rhodamine 6G and from mixtures containing both donor rhodamine 6G and acceptor DQOCI. It can be seen that more acceptor DQOCI quenched rhodamine 6G fluorescence more effectively. The fluorescence intensity acquired at 523 nm from the pure donor rhodamine 6G (tube no. 1) and the mixture solutions with different acceptor concentrations of 0.125, 0.25, and 0.5 mM (tube nos. 3, 5, and 7) are plotted in Fig. 2(c). From the ratios of the diminished and unperturbed fluorescence intensities, the absolute FRET efficiencies were quantified using Eq. (3) and are shown in Fig. 2(d). Fig. 2(a) Photograph of the tube phantom and tabulation of the donor (rhodamine 6G or R6G) and acceptor (DQOCI) concentrations. (b) Fluorescence microscopic image of the sample solutions acquired at 523 nm. (c) Fluorescence signals versus acceptor concentration, showing the FRET effect. (d) FRET efficiency map acquired using fluorescence microscopy. 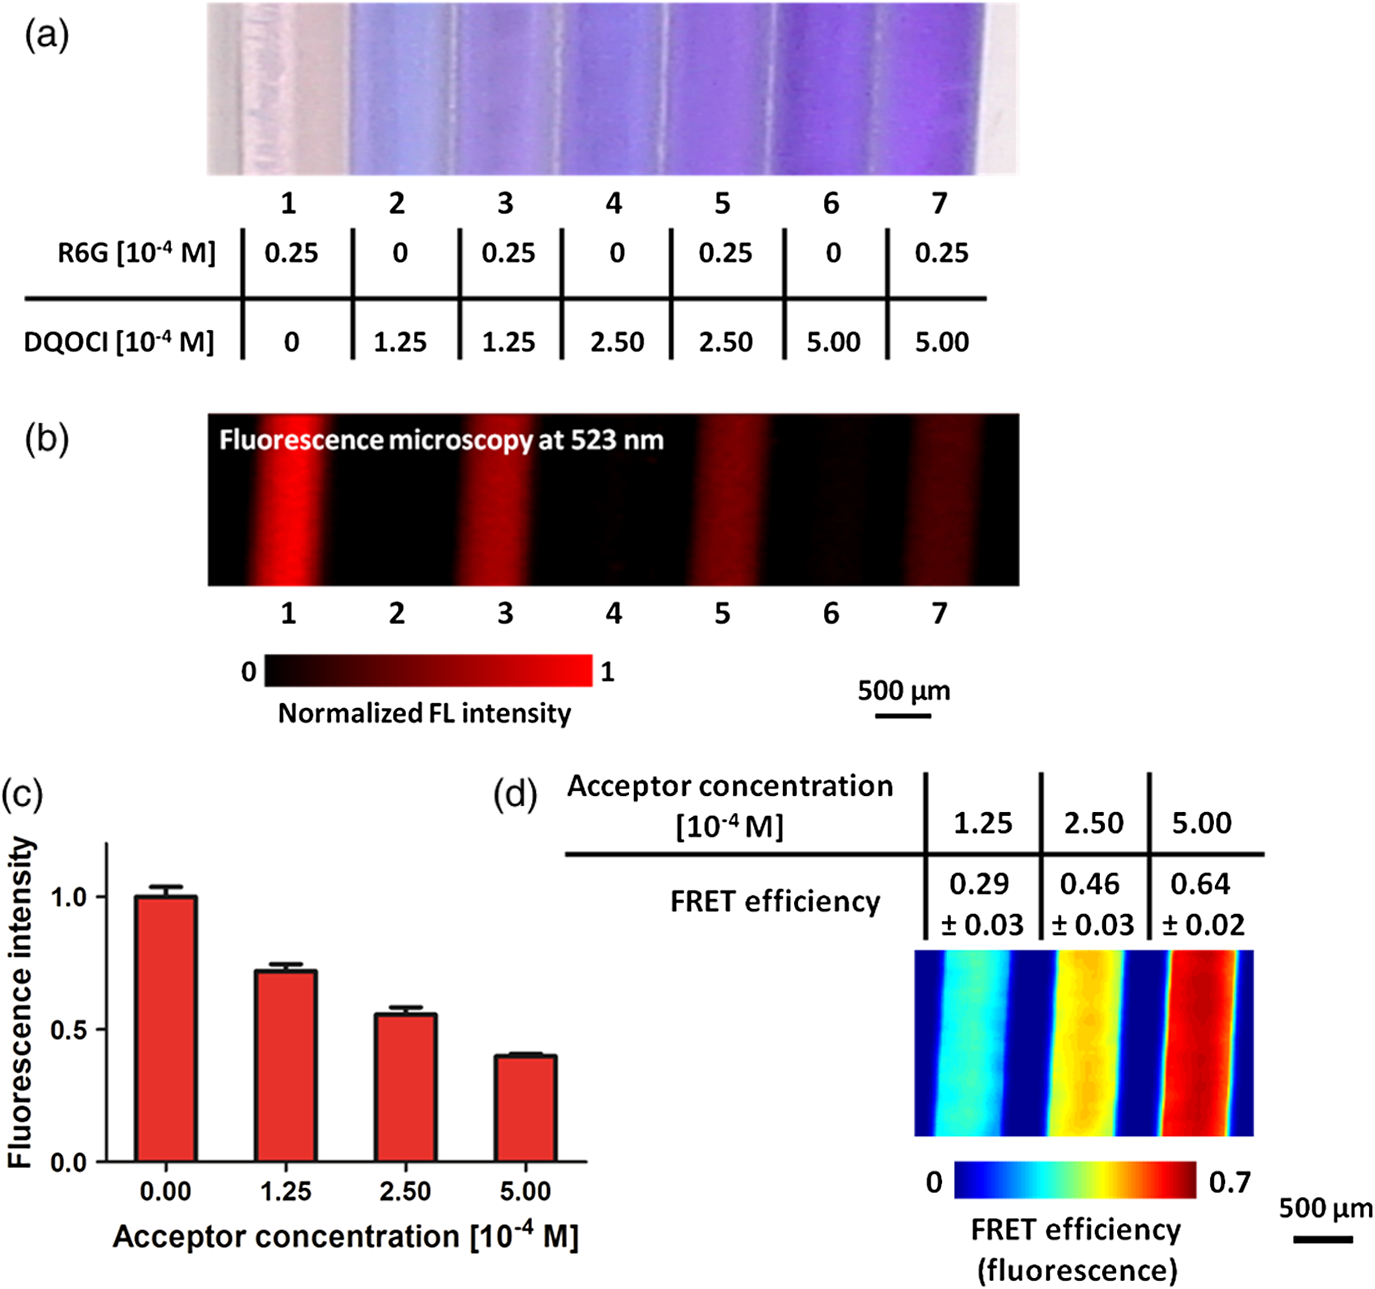 3.ResultsTo test photoacoustic tomography of FRET in biological tissue, the sample solutions were sequentially placed in a 0.3-mm diameter silastic tube beneath 1-cm thickness of chicken breast tissue. Figure 3(a) shows photoacoustic tomography images of the sample solutions acquired at 523 and 630 nm. The photoacoustic signals at 630 nm are dominated by the acceptor DQOCI absorption, as is evident by the equal photoacoustic amplitudes from solutions containing only DQOCI and from solutions containing both rhodamine 6G and DQOCI. The photoacoustic signals at 523 nm show the raw photoacoustic signals generated by both the donor rhodamine 6G and the acceptor DQOCI absorptions. After using Eq. (5) to subtract the acceptor DQOCI bleed-through photoacoustic background (tube nos. 2, 4, and 6) from the raw photoacoustic signals of the FRET pair (tube nos. 3, 5, and 7), the photoacoustic amplitude resulting from the donor rhodamine 6G excitation in the absence (tube no. 1) and the presence (tube nos. 3, 5, and 7) of different concentrations of acceptor DQOCI is plotted in Fig. 3(b). Here, the quenching of donor rhodamine 6G fluorescence leads to an enhancement of the photoacoustic signal. Figure 3(c) shows the FRET efficiency map of the tissue phantom calculated from the relative increase of photoacoustic amplitude using Eq. (4). The photoacoustic and fluorescence measurements of FRET efficiencies agree with a correlation coefficient of 0.93. The results demonstrate the potential for in vivo FRET imaging using photoacoustic tomography. Fig. 3(a) Photoacoustic tomography image of the sample solutions acquired at 523 and 630 nm below a 1-cm thickness of chicken breast tissue. (b) Photoacoustic signals after acceptor bleed-through correction versus acceptor concentration, showing the Förster resonance energy transfer (FRET) effect. (c) FRET efficiency map acquired using photoacoustic tomography.  The signal-to-noise ratio (SNR, the ratio of the signal amplitude to the standard deviation of the background or of the ratio in dB) of the photoacoustic FRET tomography was investigated by overlaying a 25 μM rhodamine 6G donor solution tube with a wedge of chicken breast tissue. The imaging depth was incremented from 0.5 to 1.0 cm [Fig. 4(a)]. Figure 4(a) shows a photoacoustic image of the tube covered with the tissue wedge. Figure 4(b) plots the SNR versus the depth of the tube. It can be seen that the SNR in decibels decreased linearly with increasing depth. The fitted penetration depth for decay at 523 nm in chicken breast tissue was 0.4 cm, and the extrapolated noise equivalent (i.e., ) penetration depth was 1.3 cm. With the laser fluence of (half of the ANSI safety limit28), a 1-cm imaging depth was achieved with an SNR of 7 dB. Increasing the laser fluence can further improve the noise-equivalent penetration depth. Fig. 4Photoacoustic tomography of the donor solution in a tube acquired at 523 nm beneath a wedge of chicken breast tissue with a varying thickness from 0.5 to 1.0 cm. (a) Image of the tube at depths from 0.5 to 1.0 cm as labeled. (b) Photoacoustic signal-to-noise ratio (SNR) versus the depth of the tube.  In conclusion, photoacoustic tomography has been used to image FRET efficiencies beneath a 1-cm thickness of chicken breast tissue. Based on the relative increase in photoacoustic signals, absolute FRET efficiencies can be quantified. Compared to fluorescence-based methods, photoacoustic tomography enables deep penetration imaging in biological tissue at high ultrasonic resolution. This advantage should facilitate the application of FRET imaging in in vivo animal studies. AcknowledgmentsThe authors appreciate the close reading of the manuscript by Profs. James Ballard and Lynnea Brumbaugh. They also thank Alejandro Garcia-Uribe for helping with data processing and manuscript preparation. This work was sponsored in part by National Institutes of Health grants R01 EB000712, R01 EB008085, R01 CA134539, U54 CA136398, R01 CA157277, R01 CA159959, and DP1 EB016986 (NIH Director’s Pioneer Award). L. V. W. has a financial interest in Microphotoacoustics, Inc. and Endra, Inc., which, however, did not support this work. ReferencesA. PeriasamyS. S. VogelR. M. Clegg,
“FRET 65: a celebration of Forster,”
J. Biomed. Opt., 17
(1), 011001
(2012). http://dx.doi.org/10.1117/1.JBO.17.1.011001 JBOPFO 1083-3668 Google Scholar
R. RoyS. HohngT. Ha,
“A practical guide to single-molecule FRET,”
Nat. Methods, 5 507
–516
(2008). http://dx.doi.org/10.1038/nmeth.1208 1548-7091 Google Scholar
T. Forster,
“Energy migration and fluorescence,”
J. Biomed. Opt., 17
(1), 011002
(2012). http://dx.doi.org/10.1117/1.JBO.17.1.011002 JBOPFO 1083-3668 Google Scholar
R. M. Clegg,
“Fluorescence resonance energy transfer,”
Curr. Opin. Biotechnol., 6
(1), 103
–110
(1995). http://dx.doi.org/10.1016/0958-1669(95)80016-6 CUOBE3 0958-1669 Google Scholar
A. BaruchD. A. JefferyM. Bogyo,
“Enzyme activity—it’s all about image,”
Trends Cell Biol., 14
(1), 29
–35
(2004). http://dx.doi.org/10.1016/j.tcb.2003.11.002 TCBIEK 0962-8924 Google Scholar
J. McGintyet al.,
“In vivo fluorescence lifetime tomography of a FRET probe expressed in mouse,”
Biomed. Opt. Express, 2
(7), 1907
–1917
(2011). http://dx.doi.org/10.1364/BOE.2.001907 BOEICL 2156-7085 Google Scholar
V. Gaindet al.,
“Deep-tissue imaging of intramolecular fluorescence resonance energy-transfer parameters,”
Opt. Lett., 35
(9), 1314
–1316
(2010). http://dx.doi.org/10.1364/OL.35.001314 OPLEDP 0146-9592 Google Scholar
L. V. WangS. Hu,
“Photoacoustic tomography: in vivo imaging from organelles to organs,”
Science, 335
(6075), 1458
–1462
(2012). http://dx.doi.org/10.1126/science.1216210 SCIEAS 0036-8075 Google Scholar
S. Parket al.,
“Adaptive beamforming for photoacoustic imaging,”
Opt. Lett., 33
(12), 1291
–1293
(2008). http://dx.doi.org/10.1364/OL.33.001291 OPLEDP 0146-9592 Google Scholar
F. Zhenget al.,
“Laser-scanning photoacoustic microscopy with ultrasonic phased array transducer,”
Biomed. Opt. Express, 3
(11), 2694
–2699
(2012). http://dx.doi.org/10.1364/BOE.3.002694 BOEICL 2156-7085 Google Scholar
Y. Wanget al.,
“In vivo three-dimensional photoacoustic imaging based on a clinical matrix array ultrasound probe,”
J. Biomed. Opt., 17
(6), 061208
(2012). http://dx.doi.org/10.1117/1.JBO.17.6.061208 JBOPFO 1083-3668 Google Scholar
J. M. Yanget al.,
“Simultaneous functional photoacoustic and ultrasonic endoscopy of internal organs in vivo,”
Nat. Med., 18 1297
–1302
(2012). 1078-8956 Google Scholar
H. P. Brechtet al.,
“Whole-body three-dimensional optoacoustic tomography system for small animals,”
J. Biomed. Opt., 14
(6), 064007
(2009). http://dx.doi.org/10.1117/1.3259361 JBOPFO 1083-3668 Google Scholar
C. ZhangK. MaslovL. H. V. Wang,
“Subwavelength-resolution label-free photoacoustic microscopy of optical absorption in vivo,”
Opt. Lett., 35
(19), 3195
–3197
(2010). http://dx.doi.org/10.1364/OL.35.003195 OPLEDP 0146-9592 Google Scholar
E. Z. Zhanget al.,
“In vivo high-resolution 3D photoacoustic imaging of superficial vascular anatomy,”
Phys. Med. Biol., 54
(4), 1035
–1046
(2009). http://dx.doi.org/10.1088/0031-9155/54/4/014 PHMBA7 0031-9155 Google Scholar
M. Heijblomet al.,
“Visualizing breast cancer using the Twente photoacoustic mammoscope: what do we learn from twelve new patient measurements?,”
Opt. Express, 20
(11), 11582
–11597
(2012). http://dx.doi.org/10.1364/OE.20.011582 OPEXFF 1094-4087 Google Scholar
D. RazanskyA. BuehlerV. Ntziachristos,
“Volumetric real-time multispectral optoacoustic tomography of biomarkers,”
Nat. Protoc., 6 1121
–1129
(2011). http://dx.doi.org/10.1038/nprot.2011.351 NPARDW 1750-2799 Google Scholar
Y. Wanget al.,
“In vivo integrated photoacoustic and confocal microscopy of hemoglobin oxygen saturation and oxygen partial pressure,”
Opt. Lett., 36
(7), 1029
–1031
(2011). http://dx.doi.org/10.1364/OL.36.001029 OPLEDP 0146-9592 Google Scholar
T. N. Erpeldinget al.,
“Sentinel lymph nodes in the rat: noninvasive photoacoustic and US imaging with a clinical US system,”
Radiology, 256 102
–110
(2010). http://dx.doi.org/10.1148/radiol.10091772 RADLAX 0033-8419 Google Scholar
J. Yaoet al.,
“Label-free oxygen-metabolic photoacoustic microscopy in vivo,”
J. Biomed. Opt., 16
(7), 076003
(2011). http://dx.doi.org/10.1117/1.3594786 JBOPFO 1083-3668 Google Scholar
Y. WangL. V. Wang,
“Förster resonance energy transfer photoacoustic microscopy,”
J. Biomed. Opt., 17
(8), 086007
(2012). http://dx.doi.org/10.1117/1.JBO.17.8.086007 JBOPFO 1083-3668 Google Scholar
E. A. Jares-ErijmanT. M. Jovin,
“FRET imaging,”
Nat. Biotechnol., 21 1387
–1395
(2003). http://dx.doi.org/10.1038/nbt896 NABIF9 1087-0156 Google Scholar
A. Periasamy,
“Fluorescence resonance energy transfer microscopy: a mini review,”
J. Biomed. Opt., 6
(3), 287
–291
(2001). http://dx.doi.org/10.1117/1.1383063 JBOPFO 1083-3668 Google Scholar
J. Gamelinet al.,
“A real-time photoacoustic tomography system for small animals,”
Opt. Express, 17
(13), 10489
–10498
(2009). http://dx.doi.org/10.1364/OE.17.010489 OPEXFF 1094-4087 Google Scholar
J. Xiaet al.,
“Whole-body ring-shaped confocal photoacoustic computed tomography of small animals in vivo,”
J. Biomed. Opt., 17
(5), 050506
(2012). http://dx.doi.org/10.1117/1.JBO.17.5.050506 JBOPFO 1083-3668 Google Scholar
J. Xiaet al.,
“Three-dimensional photoacoustic tomography based on the focal-line concept,”
J. Biomed. Opt., 16
(9), 090505
(2011). http://dx.doi.org/10.1117/1.3625576 JBOPFO 1083-3668 Google Scholar
Y. Wanget al.,
“Integrated photoacoustic and fluorescence confocal microscopy,”
IEEE Trans. Biomed. Eng., 57
(10), 2576
–2578
(2010). http://dx.doi.org/10.1109/TBME.2010.2059026 IEBEAX 0018-9294 Google Scholar
American National Standard for Safe Use of Lasers ANSI Z136.1-2000, Laser Institute of America, American National Standards Institute, Inc., New York
(2000). Google Scholar
|


