
|
|
1.IntroductionMost optical-physiological diagnosis methods are based on the insertion of light, with known parameters to a tested tissue, followed by the measurement of the re-emitted light. When investigating light–tissue interactions, human tissue is usually dealt with as a semi-infinite surface. Hence, the light reflected from the tissue (volume reflection) is commonly investigated.1–6 Very few methods test the transmitted light7–10 or ballistic photons.11 In this work, we suggest looking at the full profile of scattered light (transmitted and reflected) from a circle of tissue, such as a fingertip joint, ear lobe, or pinched tissue, at all possible exit angles. This full profile will reveal new behaviors of photon migration in tissue. The human tissue is one of the most complex optical mediums since it is a turbid one, which means it is not homogeneous. Hence the optical properties, such as the absorption coefficient , the scattering coefficient , and the anisotropy factor , are unknown and vary in different areas and physiological states. Furthermore, during respiration the blood vessels, which are the main cause for light absorption, vary in size. Since the blood vessel distribution in the tissue is not homogenous, several researchers12–15 raised the question whether the attenuation due to absorption in the blood also depends on the distribution of the blood vessels in the tissue. Liu et al.10 used an epoxy phantom to demonstrate that the inner part of larger blood vessels is less effective in light absorption because it has lower exposure to light (“shielding effect”). By using computer simulation, Jacques13 found that the reflectance from a semi-infinite tissue increases with a direct correlation to the vessel size, even though blood volume was kept constant. Measurements of light–tissue interaction involve either direct methods which need no theoretical models of light propagation, or indirect methods. Direct methods include attenuation measurements in calibration solutions16 or integrating spheres for the measurement of the total light transmission through a blood sample and of the total reflected light.7–9 Indirect methods are based on mathematical simulation models of photon migration. Photon migration simulations are commonly described by the diffusion theory.17 However, in the close region near the light source, diffusion theory does not accurately describe the light distribution.18 The Monte Carlo (MC) simulation method assumes that all photons begin as ballistic photons, and the change in their direction is due to the scattering coefficient of the medium.1,11,13,19,20 In this work, we calculated via MC simulation the distribution of collected photons after being scattered and absorbed in a two-dimensional (2-D) model of a circular cross section of tissue containing blood vessels. The results were compared to three-dimensional (3-D) where the transmission profile was calculated. A near infrared (NIR) wavelength of 850 nm was chosen due to its high penetration depth and minimal scattering.21 The numerical simulation was repeated ten times to eliminate vessel location dependency. The transmission and reflectance profiles via blood vessel diameter was extracted from our results in order to compare them to traditional known results. 2.Materials and Methods2.1.Model of Tissue with Blood VesselsThe 2-D 10-mm diameter circular cross section of “tissue” in which circles of “blood vessels” were introduced is shown in Fig. 1. To understand the influence of the vessel diameter, several simulations were held where a different vessel diameter was chosen. In order to fulfill the constant blood volume (denoted ) condition, the number of vessels having a diameter was chosen using so the total volume of the blood is constant for all blood vessel diameter groups.Fig. 1Scheme of simulated 2-D model. Blood vessels (small red circles) were randomly placed in a homogenic tissue (black circle). A beam of photons with a waist of was introduced at one end (green arrows) in a direction of 0 deg central angle and collected at all central angles. Reflected photons (violet arrows) are defined as photons exiting the tissue in a central angle higher than 135 deg. Transmitted photons (blue arrows) are defined as photons exiting from the tissue on the opposite side of the tissue in a central angle lower than 45 deg.  The location of these vessels was chosen randomly while verifying that there are no overlaps. A 3-D model of a cylinder of tissue with absorbent blood vessels randomly placed in the plane and uniform in the direction were created with the same method and properties as described in the 2-D model (Fig. 2). Ten repetitions of the simulation, where the number of vessels and their diameter was the same but their location was changed, were held to determine the variations in transmission due to the random vessel location. The illumination was set to be a square of , and the transmitted photons were collected from a 1 mm thick slice (gray area in Fig. 2) along the cylinder surface. Although the cylindrical geometry description is well known in the literature,22 to the best of our knowledge this is the first time its full scattering profile for 360 deg over the sample has been simulated. 2.2.Numerical MC Simulation of Photon MigrationA beam of photons with a waist of enters the circular tissue parallel to the direction. Note that due to the diffraction theory limitations, the distinction between different blood vessel diameters in the scattering profile is only valid when illuminating with a beam waist several orders of magnitude higher than the vessel diameters. In the NIR wavelength of 850 nm chosen in this work, the vessels act as absorbing and highly scattering disturbances9 in a tissue which is mainly a scattering medium.23 The propagation path of each photon is calculated from the absorption and scattering constants (Table 1). An MC simulation of photon migration within irradiated tissues was performed based on the model that was previously developed in our group.1 This simulation is based on the assumption that all photons reaching the tissue begin as ballistic photons (phase function equal to 0). Given the current photon’s direction (), the new photon direction () following tissue or blood vessels penetration was calculated according to the scattering and absorption properties, as follows:
Table 1Tissue and vessel optical properties for a wavelength of 850 nm.
Table 2Comparison of average reflection (Ravg) and transmission (Tavg) for different tissue diameters (Dt).
This process is repeated until the photon exits the tissue, and then its location is saved. Ten repetitions of the simulation, where the number of vessels and their diameter were the same but their location was changed, were held to determine the variations due to the random blood vessel locations. 3.Results and DiscussionThe simulation described in Sec. 2 was held for several vessel diameters while maintaining a constant blood volume. The mean fraction of photons that exited the tissue at several central angles ( in Fig. 1) from 0 deg to 180 deg is presented in Fig. 3 for each vessel diameter. The mean of 10 different vessel distributions was calculated. As can be seen from Fig. 3, for central angles lower than 135 deg the photon transmission decreases for lower vessel diameters, while for central angles higher than 135 deg the photon reflection decreases for higher vessel diameters. Thus, is an isobaric point to vessel diameter. Fig. 3The distribution of collected photons. The percent of photons exiting from the tissue in different central angles for various vessel diameters. For central angles lower than 135 deg the photon transmission increases for higher vessel diameters; for central angles higher than 135 deg the photon reflection decreases for higher vessel diameters. 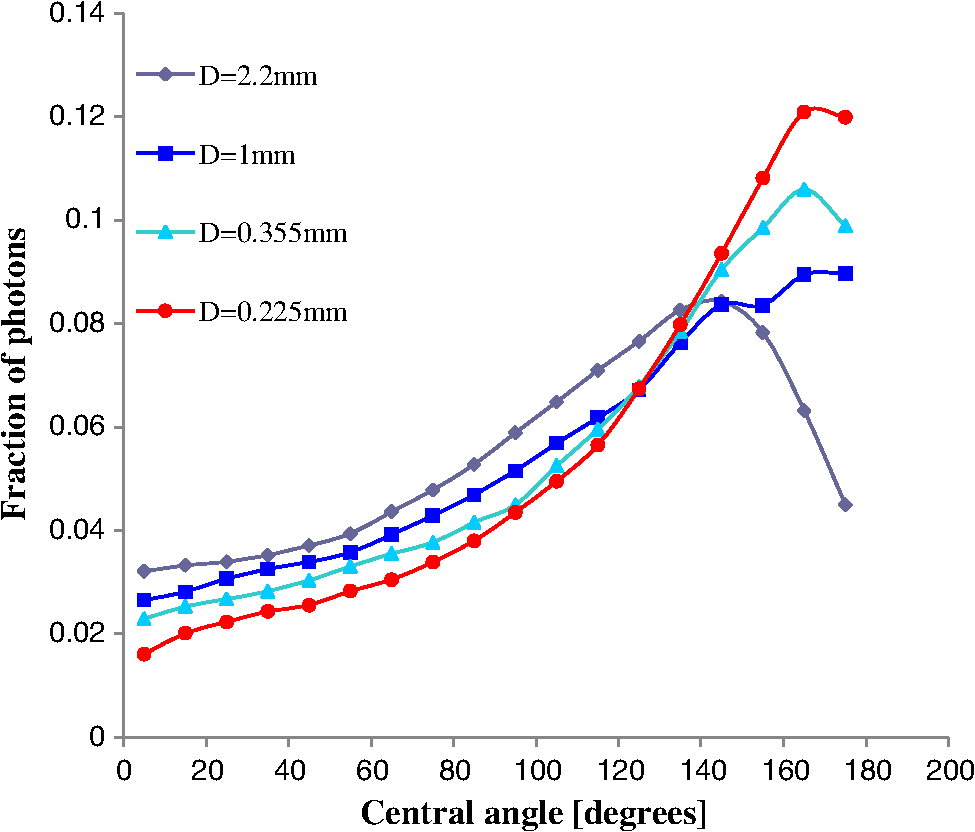 In order to facilitate the presentation, reflected photons are defined as those that exit the tissue near the entrance point at a central angle of . Forward transmitted photons are defined as those that exit the tissue at a central angle of . Figure 4(a) and 4(b) presents the average fractions of the reflected and forward transmitted photons, respectively, for several vessel diameters while maintaining a constant blood volume. The standard deviation (STD) due to vessel placement is presented in both figures. These results match the “shielding effect”10 since for larger blood vessels the total effective absorption and scattering are lower. As a result, the attenuation is lower, hence the transmission is higher and the reflectance is lower as seen in Fig. 4(a) and 4(b). Note that the transmission curve in Fig. 4(b) matches the results presented by Jacques13 for reflection. The changes in the scattering values near 850 nm wavelength are negligible and the changes in the absorption are still dominant.3 It follows that less absorption will lead to more transmission and less reflectance as demonstrated. Fig. 4The fraction of (a and c) reflected and (b) forward transmitted photons as a function of blood vessel diameter while keeping a constant blood volume, obtained by computerized simulation for (a and b) 2-D and (c) 3-D.  Due to the fact that real tissues are 3-D and not 2-D, the 3-D simulation described in Sec. 2 was held, and the fraction of the reflection as a function of blood vessel diameter was presented [Fig. 4(c)], while keeping a constant blood volume. Despite the differences in the slopes and the variables, the 3-D curves resemble those received in the 2-D simulation. However, the exact position of the isobaric point as well as the profile of transmitted photons strongly depends on the optical properties as well as the geometry of the tissue. As seen in Table 2, even if only the changes while the number of vessels () is kept constant, the behavior of the transmitted and reflected photons switches and the isobaric point moves to a higher angle () for and to a lower angle () for . The main result in the 2-D simulation is that for a central angle lower than the isobaric point the photon transmission is lower for vessels of lower diameter while for a central angle higher than the isobaric point the photon reflection is smaller for vessels of higher diameter. The latter result is in contrast to that obtained by Jacques,13 who used a semi-infinite model of the tissue and a wavelength of 585 nm. While repeating Jacques’ conditions we were able to reproduce his results. This outcome reinforces the correctness of our model. The reasons that we found that the photon reflection is smaller for vessels of higher diameter are the difference in: (1) the wavelengths (585 nm at Jacques and 850 nm in this research); and following this (2) the absorption constant ( at Jacques) is 36 times higher than the absorption constant for the wavelength chosen in our paper21 which has a value of . Furthermore, (3) an 850 nm wavelength provides higher penetration depth and (4) lower tissue scattering.3 However, both the scattering profile as well as the value of the isobaric point strongly depend on optical properties (like the absorption and scattering constants) and the exact geometry of the case (as we shown for different ). 4.ConclusionThe main result is that there is a central angle that below which the photon transmission decreased for lower vessel diameters while above this angle the opposite occurred. The isobaric point (found at under the presented studies conditions) could be used as a point of measurement for optical characterization purposes. Furthermore, the findings of our work dealing with the changes in reflection and transmission for different blood vessels diameter with the same volume could be used for different applications such as pulse oximetry in the ear lobe as well as in pinched tissue or in the fingertip joint. The changes in the scattering profile due to variations in blood vessel diameter are more substantial than the change in optical properties in the NIR region, and hence may be used to improve existing pulse oximetry methods. The current pulse oximetry technique derives oxygen saturation in arterial blood from light transmission pulses (photoplethysmography) signals in two wavelengths. The current technique requires calibration and the calibration process saves the need for separation between absorption and scattering effects, and also the need for exact knowledge of the light extinction coefficients. By using our new computer simulation for the evaluation of the transmission and reflection of NIR photons after being scattered and absorbed, the accurate values of extinction coefficients can be extracted and will improve the pulse oximetry technique as well as other NIR methods for the assessment of oxygen saturation. ReferencesR. Ankriet al.,
“In-vivo tumor detection using diffusion reflection measurements of targeted gold nanorods—a quantitative study,”
J. Biophoton., 5
(3), 263
–273
(2012). http://dx.doi.org/10.1002/jbio.201100120 JBOIBX 1864-063X Google Scholar
R. AnkriH. TaitelbaumD. Fixler,
“Reflected light intensity profile of two-layer tissues: phantom experiments,”
J. Biomed. Opt., 16
(8), 0850011
–0850016
(2011). http://dx.doi.org/10.1117/1.3605694 JBOPFO 1083-3668 Google Scholar
D. FixlerR. Ankri,
“Subcutaneous gold nanorod detection with diffusion reflection measurement,”
J. Biomed. Opt., 18
(6), 612261
–612267
(2013). http://dx.doi.org/10.1117/1.JBO.18.6.061226 JBOPFO 1083-3668 Google Scholar
R. A. J. GroenhuisA. H. FerwedaJ. J. Ten Bosch,
“Scattering and absorption of turbid materials determined from reflection measurements. 1: theory,”
Appl. Opt., 22
(16), 2456
–2462
(1983). http://dx.doi.org/10.1364/AO.22.002456 APOPAI 0003-6935 Google Scholar
D. Jakubowskiet al.,
“Quantitative absorption and scattering spectra in thick tissues using broadband diffuse optical spectroscopy,”
Biomedical Optical Imaging, 330
–355 Oxford University Press, New York
(2009). Google Scholar
T. H. Pham et al.,
“Broad bandwidth frequency domain instrument for quantitative tissue optical spectroscopy,”
Rev. Sci. Instrum., 71
(6), 2500
–2513
(2000). http://dx.doi.org/10.1063/1.1150665 RSINAK 0034-6748 Google Scholar
M. Friebel et al.,
“Influence of oxygen saturation on the optical scattering properties of human red blood cells in the spectral range 250 to 2000 nm,”
J. Biomed. Opt., 14
(3), 034001
–034006
(2009). http://dx.doi.org/10.1117/1.3127200 JBOPFO 1083-3668 Google Scholar
M. Friebel et al.,
“Determination of optical properties of human blood in the spectral range 250 to 1100 nm using Monte Carlo simulations with hematocrit-dependent effective scattering phase functions,”
J. Biomed. Opt., 11
(3), 034021
(2006). http://dx.doi.org/10.1117/1.2203659 JBOPFO 1083-3668 Google Scholar
A. Rogganet al.,
“Optical properties of circulating human blood in the wavelength range 400–2500 nm,”
J. Biomed. Opt., 4
(1), 36
–46
(1999). http://dx.doi.org/10.1117/1.429919 JBOPFO 1083-3668 Google Scholar
L. ZhangA. ShiH. Lu,
“Determination of optical coefficients of biological tissue from a single integrating-sphere,”
J. Mod. Opt., 59
(2), 121
–125
(2012). http://dx.doi.org/10.1080/09500340.2011.631052 JMOPEW 0950-0340 Google Scholar
R. VeredS. HavlinH. Taitelbaum,
“Optical detection of hidden tumors,”
Proc. SPIE, 2389 851
–858
(1995). http://dx.doi.org/10.1117/12.210035 PSISDG 0277-786X Google Scholar
M. FirbankE. OkadaD. T. Delpy,
“Investigation of the effect of discrete absorbers upon the measurement of blood volume with near-infrared spectroscopy,”
Phys. Med. Biol., 42
(3), 465
–477
(1997). http://dx.doi.org/10.1088/0031-9155/42/3/002 PHMBA7 0031-9155 Google Scholar
S. L. Jacques,
“Optical assessment of cutaneous blood volume depends on the vessel size distribution: a computer simulation study,”
J. Biophoton., 3
(1–2), 75
–81
(2010). http://dx.doi.org/10.1002/jbio.200900085 JBOIBX 1864-063X Google Scholar
H. Liuet al.,
“Influence of blood vessels on the measurement of hemoglobin oxygenation as determined by time-resolved reflectance spectroscopy,”
Med. Phys., 22
(8), 1209
–1217
(1995). http://dx.doi.org/10.1118/1.597520 MPHYA6 0094-2405 Google Scholar
A. TalsmaB. ChanceR. Graaff,
“Corrections for inhomogeneities in biological tissue caused by blood vessels,”
J. Opt. Soc. Am., 18
(4), 932
–939
(2001). http://dx.doi.org/10.1364/JOSAA.18.000932 JOSAAH 0030-3941 Google Scholar
A. N. Yaroslavskyet al., Optics of Blood, SPIE Press, Bellingham
(2002). Google Scholar
G. ZaccantiS. Del BiancoF. Martelli,
“Measurements of optical properties of high-density media,”
Appl. Opt., 42
(19), 4023
–4030
(2003). http://dx.doi.org/10.1364/AO.42.004023 APOPAI 0003-6935 Google Scholar
S. L. JacquesB. W. Pogue,
“Tutorial on diffuse light transport,”
J. Biomed. Opt., 13
(4), 041302
(2008). http://dx.doi.org/10.1117/1.2967535 JBOPFO 1083-3668 Google Scholar
L. WangS. L. Jacques,
“Hybrid model of Monte Carlo simulation and diffusion theory for light reflectance by turbid media,”
J. Opt. Soc. Am. A, 10
(8), 1746
–1752
(1993). http://dx.doi.org/10.1364/JOSAA.10.001746 JOAOD6 0740-3232 Google Scholar
L. WangS. L. JacquesL. Zheng,
“MCML—Monte Carlo modeling of light transport in multi-layered tissues,”
Comput. Methods Prog. Biomed., 47
(2), 131
–146
(1995). http://dx.doi.org/10.1016/0169-2607(95)01640-F CMPBEK 0169-2607 Google Scholar
M. NitzanS. Engelberg,
“Three-wavelength technique for the measurement of oxygen saturation in arterial blood and in venous blood,”
J. Biomed. Opt., 14
(2), 024046-1
–024046-6
(2009). http://dx.doi.org/10.1117/1.3120496 JBOPFO 1083-3668 Google Scholar
X. Guoet al.,
“Depolarization of light in turbid media: a scattering event resolved Monte Carlo study,”
Appl. Opt., 49 153
–162
(2010). http://dx.doi.org/10.1364/AO.49.000153 APOPAI 0003-6935 Google Scholar
A. N. Bashkatovet al.,
“Optical properties of human skin, subcutaneous and mucous tissues in the wavelength range from 400 to 2000 nm,”
J. Phys. D: Appl. Phys., 38
(15), 2543
–2555
(2005). http://dx.doi.org/10.1088/0022-3727/38/15/004 JPAPBE 0022-3727 Google Scholar
|


