
|
|
1.IntroductionActinic cheilitis (AC), or solar cheilosis, is a potentially malignant disorder that mostly affects the vermilion border of the lower lip.1–4 It usually involves fair-skinned, middle-aged or older patients with a history of prolonged sun exposure, especially in outdoors workers.5 Some studies have identified the prevalence of AC in some different groups of Brazilian population, such as Junqueira et al.,6 who found 39% of AC among agricultural workers; Martins-Filho et al.,7 who found 16.7% of AC among farmers in a semi-arid northeastern; and de Souza Lucena et al.,8 who found about 15% of AC among beach workers. The solar ultraviolet (UV) radiation is considered the main risk factor for AC and lip squamous cell carcinoma (SCC),9–11 but tobacco has also been associated with these lesions and with AC progression to SCC.11 Lip SCC is one of the most common malignancies of the oral cavity11 and almost all lip SCCs are associated with clinical areas of AC.12,13 AC is a heterogeneous clinical entity that may be localized or, more commonly, presented as a diffuse lesion, including atrophy, dryness, scaly areas, swelling, erythema, ulceration, loss of vermilion border definition, transverse fissures, white plaques, erosion, crusting, blotchiness, and tissue pallor as the main clinical features.2,3,5,11 Histopathological changes vary from hyperkeratosis to SCC in the presence of solar elastosis.4,11,13 Epithelial dysplasia (ED), which is still the most important predictor of malignant development,14,15 is described in up to 100% of AC cases.1–3,5 Additionally, although the precise AC malignant transformation rate is unknown,4 lip SCC is described to have a high metastatic potential when compared to skin SCC, turning the assessment of ED degree in AC a critical diagnosis step.5,11 AC diagnosis is mainly based on demographic, clinical, and histopathological findings,1–3 but as clinical appearance is sometimes subtle and may not correspond to the severity of tissue damage,1,11,13,16 most authors consider biopsy mandatory to establish AC definitive diagnosis and treatment planning.2,11 Recurrent ulceration, red and white blotchy areas with loss of the vermilion border, persistent crusting, generalized atrophy, and induration are clinical signs that may indicate high-grade epithelial dysplastic changes or even a malignant transformation.5,11 Nonetheless, due to the fact that AC is characterized by multifocal and heterogeneous lesions, it is not easy to predict which area will exhibit representative histopathological changes to define the biopsy site3 and an SCC may be misdiagnosed if the biopsy is not performed at a proper site.13 Some noninvasive clinical methods, such as the tissue autofluorescence widefield imaging system, have been reported as complementary approaches to discriminate malignant/dysplastic areas from normal tissue.17 Direct tissue fluorescence visualization or tissue autofluorescence widefield imaging systems are becoming attractive noninvasive diagnostic tools to identify oral ED, because they have been used to identify biochemical and morphological alterations in tissues that are not easily discriminated under white light illumination.18,19 This technique is based on the use of an illumination under UV-blue spectrum to excite native tissue fluorophores, like metabolic markers as nicotinamide adenine dinucleotide (NADH) and flavin adenine dinucleotide (FAD), and proteins as collagen, elastin, and keratin.20 The emitted fluorescence by the excited tissue can be visualized by the observer21 and provides information about metabolic and biochemical status of the resident cells.22 Changes in this fluorescence may be related to malignant progression23,24 and loss of normal tissue autofluorescence is described as a sign of malignant changes in the oral cavity.20,25–28 Several widefield optical imaging systems have been reported with good results in the oral and oropharyngeal regions,21,23,24 and some authors have presented a handheld device for widefield fluorescence imaging for oral tissue fluorescence direct visualization.21 In this way, this optical technique seems to have a potential to improve visual evaluation of AC heterogeneity, helping the decision of biopsy sites and, as a consequence, assisting the detection of possible premalignant changes. Accordingly, the purpose of this study was to evaluate the usefulness of the tissue autofluorescence widefield imaging system in the clinical diagnosis of AC, using the histopathological examination as gold standard. 2.Material and MethodsFifty-seven patients with clinical diagnosis of AC assisted at School of Dentistry of Fluminense Federal University (Nova Friburgo, Rio de Janeiro, Brazil) from March 2011 to March 2012 were included in this study. The study population was composed of 27 males (47.4%) and 30 females (52.6%), with ages ranging from 23 to 82 years (mean of 58.3 years) and having only fair-skin types (phototypes I, II, or III). A control group including 45 normal volunteers with similar sex and age distribution [23 males (51.1%) and 22 females (48.9%); age ranging from 30 to 88 years; mean of 50.6 years), most having fair-skin types (75.6%), and without any clinical signs of AC were also included for clinical and autofluorescence exams. Study and control groups did not include patients with any other lip disease. This study was carried out with the approval of the Research Ethics Committee (Medical School, Antonio Pedro School Hospital, Fluminense Federal University). All patients were examined under white light by two oral medicine specialists who performed a detailed lip evaluation considering dryness, blurred vermilion border demarcation, swelling, hardness, red or white lesions, pigmented and pallor areas, vertical fissures, erosion, ulceration, and crusts. Ulceration, erosion, crust, and red and white areas were considered the main regions prone to malignant changes and were selected as elected biopsy sites. After clinical examination, the lip was evaluated using the tissue autofluorescence widefield imaging in a dark room. A homemade handheld device was assembled with a light-emitting diode (LED) array emitting at the violet-blue range. The light source was an LED (Edison, EDEV-3LA1) emitting at 405 nm, 40 nm bandwidth, and 350 mW output power. The emission peak was cleaned by a custom-made bandpass filter (Proteon, SP, Brazil) having a center wavelength of 430 nm and a bandwidth of 40 nm. A dichroic beam splitter (FF483/639-Di01, Semrock, NY), with a cutting wavelength of 460 nm, deflected the excitation light to the sample and allowed the fluorescence signal to reach the detector. Furthermore, a custom-made longpass filter (Proteon), with a cutting wavelength of 475 nm, was placed in front of the camera objective in order to block the backscattered excitation light. Autofluorescence features were evaluated, and areas with loss of fluorescence (LOF) were considered the main regions prone to malignant changes and were selected as elected biopsy sites. All clinical and autofluorescence characteristics observed were noted in a chart sketch of the lip divided into 19 sites. Biopsies using a 5-mm punch biopsy were performed in all AC patients, and the specimens were taken from the biopsy site selected under white light and under fluorescence. If these sites were coincident, only one site was biopsied; if these sites were not coincident, each elected site was biopsied. In cases of absence of a biopsy site selected by one of the exams, the biopsy was taken from the site selected by the other exam. Tissue specimens identified by clinical and/or fluorescence indications were processed for histopathological analysis. Hematoxylin and eosin stained slides were evaluated by three oral pathologists to score ED grade as mild, moderate, or severe according to the World Health Organization criteria and classification. Fluorescence images were obtained always with the same exposure time using a Canon EOS Obj.18–55 3.5–5.6 IS with 100 mm 2.8 AF USM Macro Lens and Macro Ring Lite (Canon Inc., Tokyo, Japan) connected with the widefield fluorescence system; and they were processed by a clustering algorithm for AC automated diagnosis. The lower lip was hand-selected from the fluorescence images and placed on a new image with a black background for an easy recognition of the lip by the program. Among the three color channels, only the green one was selected for the analysis since it showed the highest intensity variation. A Gaussian blur filter was applied for noise reduction and K-means algorithm was used to assign pixel with similar intensity value to the same classification cluster. After this procedure, from a starting image of 256 grayscale intensity levels, a new image was obtained with only four intensity values (clusters). In order to evaluate the intensity distribution, the number of clustering areas was determined for each lip, in both study and control groups, and it was chosen as score for AC diagnosis. A 10-fold cross-validation with J48 decision tree algorithm29 was used to create a model to classify lip images. Briefly, this algorithm randomly divides the whole data set of scores into two groups: 90% of the scores were used to find the threshold value, according to the J48 decision tree classifier, and the remaining 10% were used for validation to determine the sensitivity and the specificity rates. This procedure was repeated 10 times. In order to understand whether AC diagnostic methods would be associated with ED upon histopathological analysis, chi-square tests were performed. The chi-square test is designed to analyze categorical data and tests the null hypothesis that the variables are independent. The association between diagnostic method, whether clinical, tissue autofluorescence widefield imaging system, or both, and ED was verified. 3.ResultsAC affected the lower lip of all patients and also affected the upper lip of nine patients, four men and five women. Clinically, AC was diffuse and heterogeneous and it was mainly observed as an area of blurred vermilion border demarcation associated with a wide swelling, focal hypopigmentation, and/or red lesions [Table 1 and Fig. 1(a) and 1(b)]. Likewise, autofluorescence analysis showed that patients with AC exhibited a heterogeneous pattern of fluorescence, mixing areas of loss and increased emission intensity, in comparison with the normal autofluorescence (NF) observed in the control group lips. In AC, LOF was clinically characterized mainly as red or pigmented areas and increase of autofluorescence (IOF) as hypopigmented, whitish or hyperkeratotic areas. IOF pattern was not the same in all cases, but usually exhibited a greater intensity in the hypopigmented regions than in the white plaques. In some areas, there was also a fluorescence emission similar to the NF, and these areas were examples of transverse fissures, hypopigmentation, hyperpigmentation, red macules, and a white plaque. It is noteworthy that there were cases without any clinical alteration that exhibited LOF or IOF (16 cases; 28.1%). In this way, the region close to lip commissure was mainly characterized as an LOF area (49 cases; 86.0%) and the border between lip semi-mucosa and lip skin as an IOF area (46 cases; 80.7%) [Table 2 and Fig. 1(d) and 1(e)]. Table 1Summary data of clinical features from 57 cases of AC.
Fig. 1Clinical and autofluorescence appearance of lower lip from AC and normal volunteer patients. (a) Clinical aspect of an AC patient presenting blurred vermilion border demarcation associated with areas of focal hypopigmentation and red and white lesions in the lower lip. (b) Clinical aspect of another AC patient showing a swollen lip with hypopigmented areas and some red spots. (c) Clinical aspect of a normal patient presenting some subtle transverse fissures. (d) Autofluorescence view of the same patient on (a), showing a heterogeneous pattern mixing areas of LOF and IOF. (e) Autofluorescence view of the same patient on (b), also showing a heterogeneous pattern. (f) Autofluorescence view of the same patient on (c), showing a homogeneous pattern of NF. 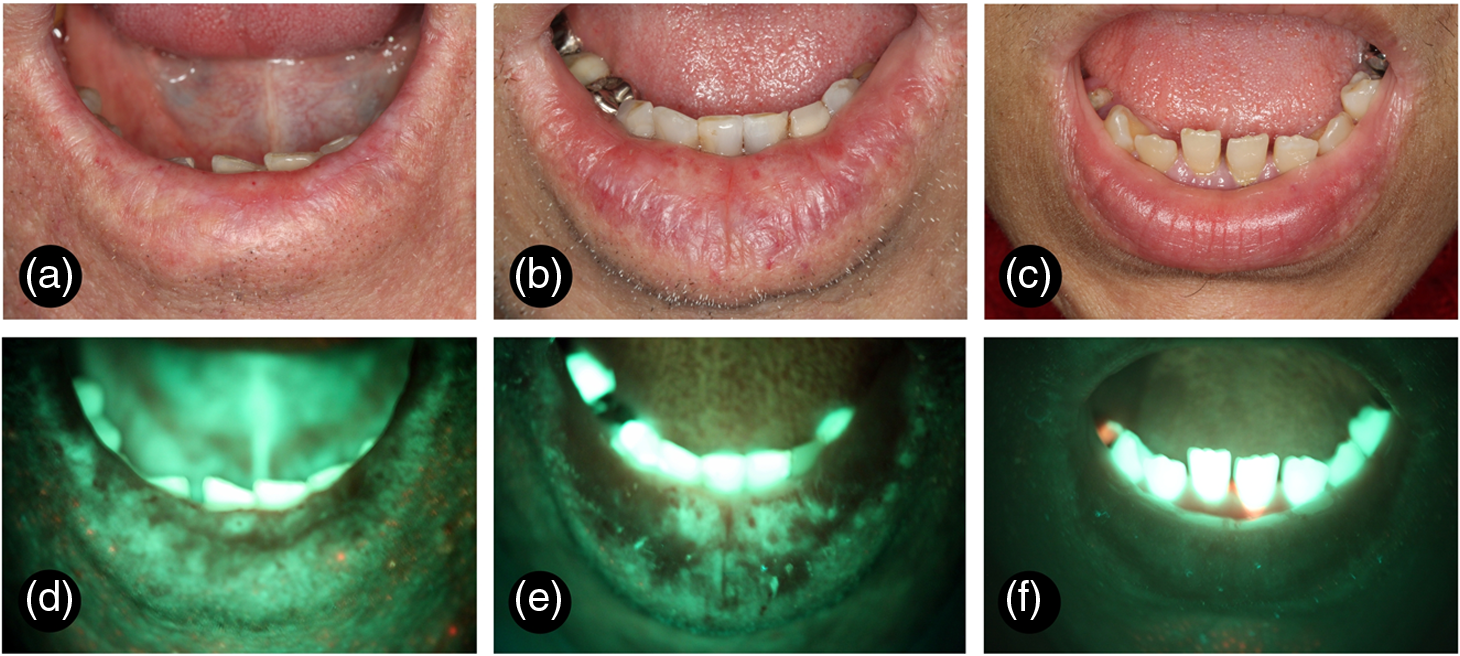 Table 2Summary data of autofluorescence features from 57 cases of AC.
Considering the control group, patients had no evidence of AC [Fig. 1(c)], but it was possible to observe areas of focal hyperpigmentation (18 cases; 40.0%), transverse fissures (13 cases; 28.9%), hypopigmentation (10 cases; 22.2%), dryness (7 cases; 15.6%), telangiectatic vessels (3 cases; 6.7%), and an area of focal crust (1 case; 2.2%). Autofluorescence analysis of this group revealed a general homogeneous fluorescence appearance [Fig. 1(f)], with cases exhibiting an NF pattern (38 cases; 84.4%) or an IOF pattern (7 cases; 15.6%). In many of these cases, focal areas of LOF were simultaneously observed (30 cases; 66.7%). LOF areas were clinically characterized as hyperpigmentation (16 cases), hypopigmentation (8 cases), fissures (3 cases), or telangiectatic vessels (3 cases); and IOF areas were clinically characterized as a fissure (1 case) or as a crust (1 case). As observed in AC, the region adjacent to lip commissure was mainly identified as an LOF area (28 cases; 62.2%) and the vermillion border as an IOF area (17 cases; 37.8%). A total of 113 areas were biopsied, ranging from 1 to 4 areas, with an average number of 1.98 biopsied areas per patient. Clinical assessment was used as the single clinical procedure to choose the biopsy site in 22 cases (19.5%), autofluorescence visualization alone was used in 45 cases (39.8%), and the combination of both techniques was used in 46 cases (40.7%). ED was found in 105 biopsies (93%) and they were graded as mild in 55 cases, moderate in 41 cases, and severe in 9 cases (Fig. 2). Mild and moderate ED were mainly detected at the biopsy sites chosen by the combination of both clinical and autofluorescence exams (45.4 and 41.5%, respectively), while the widefield autofluorescence imaging exam alone was the diagnostic technique that resulted in the highest detection of areas of severe ED (55.6%). Among the eight biopsy sites without ED, three were indicated by both clinical and autofluorescence exams, one by clinical exam only, and four by autofluorescence exam only. In addition, 20 patients had at least two biopsy sites separately chosen by clinical or autofluorescence indication. In seven of them, the autofluorescence exam revealed a higher grade of ED, while in four of these cases, the clinical exam revealed a higher grade of ED; in the remaining nine cases, both exams revealed the same grade of ED. However, chi-square tests revealed no statistically significant association between any diagnostic method and the presence or the degree of ED (, Table 3). Fig. 2ED grading of biopsies from AC patients (hematoxylin and eosin, ). (a) Mild ED—architectural disturbance and cytological atypia limited to the lower third of the epithelium. (b) Moderate ED—architecture disturbance and cytological atypia extending into the middle third of the epithelium. (c) Severe ED—architecture disturbance and cytological atypia above the middle third of the epithelium.  Table 3Summary data of the diagnostic methods used to indicate 113 areas of biopsy from 57 cases of AC.
In this study, the resultant number of clustering areas was used to score the lip images. A scatter plot of the number of areas for each group, both for control and AC, is presented in Fig. 3(a). Using a 10-fold cross-validation with J48 decision tree algorithm, a threshold value of 25 areas was found. K-means images with a number of areas above the threshold value was classified as AC lip and the ones with a lower number as normal lip. Using this image processing analysis, values of 80.7% of sensitivity and 78.3% of specificity were obtained. An example of a control and an AC fluorescence image processed with the K-means algorithm is shown in Fig. 3(b) and 3(c). Control normal lip had a more homogeneous fluorescence intensity distribution, with clustering areas showing regular shapes. It was possible to notice that, in cases of lower-lip AC, images were fragmented, showing a higher number of areas with an irregular pattern. Fig. 3Autofluorescence images processed by a clustering algorithm for automated AC diagnosis. (a) Scatter plot of number of clustering areas for control group (represented as 0 in red) and for AC group (represented as 1 in black). In green, the threshold line obtained using 10-fold cross-validation with J48 decision tree algorithm. All images with a number of areas higher than the threshold value were classified as AC. (b) and (c) K-means images obtained by processing the green channel of fluorescence images from a AC patient (b) and normal volunteer (c). Color scale is common for both images: light blue for lower-intensity pixel values and magenta for higher-intensity pixel values. 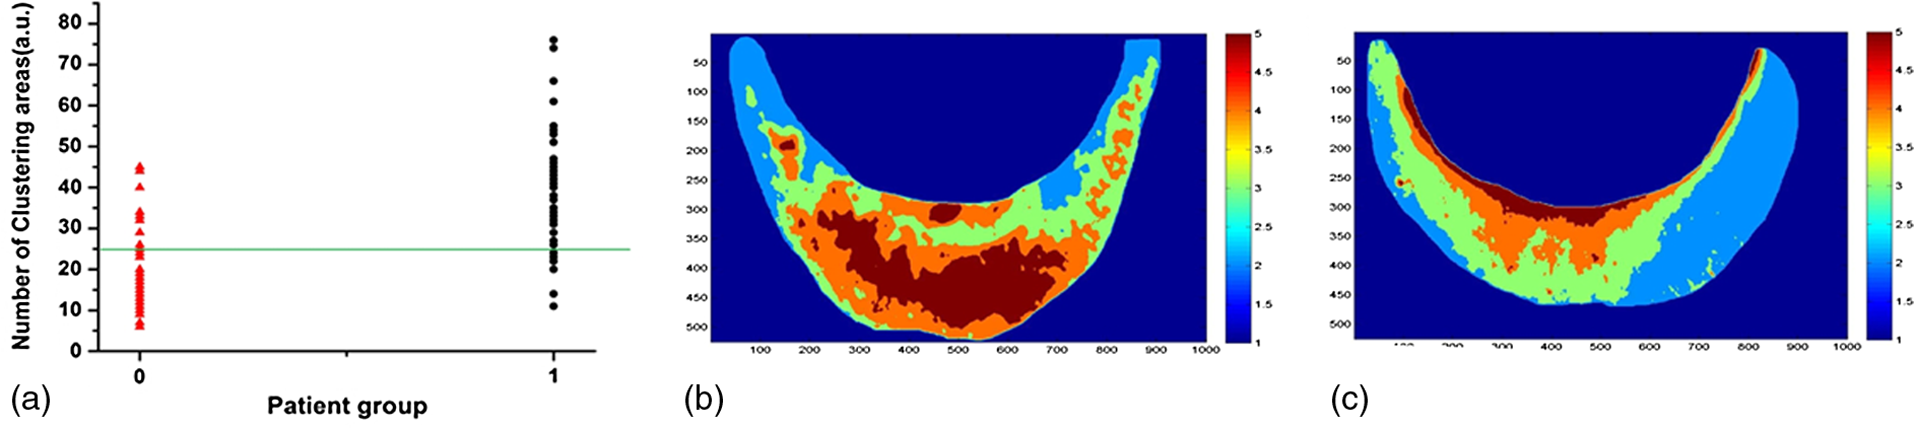 4.DiscussionAC is considered a potentially malignant disorder resulting from cumulative and long-term exposure to UV radiation.4,5,11 Population from tropic countries near to the Equator latitude, like Brazil, have a greater risk to develop AC and lip SCC,30 and progression to SCC may take decades.11,12 AC clinical presentation is variable and includes early changes, such as indistinct vermilion border and dryness, and late changes, such as ulceration, induration, white and red lesions.2,3 Nonetheless, these clinical features do not necessarily correlate with the severity of histological findings and may also include an unnoticed SCC;1,3,13 thus, AC definitive diagnosis and treatment decision should be made taking into account the histopathological assessment.5,11 The present study group was clinically characterized by the presence of many different clinical findings in a single lower lip, rendering a heterogeneous appearance that sometimes turn it difficult to select the best area to perform the biopsy to establish the definitive diagnosis and to identify and grade ED. In these cases, a clinician can use an adjuvant tool, as the tissue autofluorescence widefield imaging system, which has already been used to investigate oral potentially malignant disorders, and also oral SCC, oral SCC tumor margins, and high-risk oral SCC patients.17,19,21,22,28,31–33 Autofluorescence image techniques are also described as an important adjuvant tool to choose the most appropriate region for biopsy, especially on superficial nonhomogeneous oral lesions.33 Hence, we decide to ascertain the usefulness of a tissue autofluorescence widefield imaging system in AC diagnosis. Direct oral autofluorescence visualization is obtained by the excitation of natural biofluorophores existing in the epithelial and connective tissue in a suitable wavelength between 400 and 440 nm of light source,34–36 and it is influenced by clinic and microscopic morphology and tissue biochemistry.19 Oral normal mucosal sites have an almost identical autofluorescence spectral intensity, except for the lateral border of the tongue and vermillion border of the lips that have the lowest total intensities.37 In general, pathologic tissues usually emit a lower fluorescence because of modified distribution of the native biofluorophores or have a lack of emission because of molecular or environment changes, such as collagen matrix breakdown in tissue remodeling, increased hemoglobin absorption in high-vascularized areas, epithelial thickening in malignant progression, and decreased flavin adenine dinucleotide concentration in metabolic functions.19,21,33,36 The qualitative evaluation of tissue autofluorescence widefield imaging system performed in this series revealed that while normal lip has a general homogeneous dark green autofluorescence appearance, AC lip has a clear heterogeneous appearance containing areas of both LOF and IOF. LOF areas observed in AC may be explained by the constant finding of solar elastosis that is characterized by the replacement of the normal collagen fibers by an amorphous basophilic granular material and deformation of superficial elastic fibers.1–3,38 Vasodilatation is also a constant finding in AC3 and may be responsible for maintaining a high local hemoglobin concentration and, consequently, be associated with LOF areas. Similarly, IOF areas observed in AC may be the result of hyperkeratinization1–3 that probably increases the emitted fluorescence. Inflammation is also a common finding in AC, but its influence on tissue autofluorescence is controversial,32,35 although it is known that oxidative phosphorylation and glycolysis may be altered during inflammation and inflammatory disorders may be characterized as both clinic and microscopic LOF.20,22,32,33 Interestingly, it was possible to notice that the autofluorescence heterogeneous pattern of AC reproduces its clinical heterogeneity. Red macule, hyperpigmentation, fissure, crust, vascular abnormalities, erosion, and ulceration were mainly visualized as an IOF area. Red benign, premalignant, and malignant lesions and superficial blood vessels were already described as an LOF image.22,32,33,36 Reactive inflammatory ulceration was considered as a negative autofluorescence in a study performed by Onizawa et al.17 using filters absorbing fluorescence below 390, 480, and 520 nm. The three cases clinically characterized as erosion and ulceration in the present study were visualized as LOF areas, but associated crust in two of these cases has an IOF appearance. The LOF visualized in our study as a hyperpigmentation was already described in the oral mucosa of three dark-skinned patients in a spectroscopy autofluorescence study, and this finding probably occurs because melanin absorbs excitation and emission fluorescence.39 On the other hand, hypopigmentation and white plaques were mainly visualized as an IOF area. White lesions, including leukoplakias and frictional keratosis, may have LOF and IOF appearance,28,36 and it can also show absence of autofluorescence abnormality as a case of hyperkeratotic SCC described by Koch et al.32 Finally, it is noteworthy that some apparently normal lip vermilion also presented LOF (22.8%) or IOF (5.3%) areas, especially because clinically occult high-risk lesions will probably be visualized as an LOF area.19,31 There are many studies using direct autofluorescence imaging systems devices to differentiate benign from potentially malignant and malignant lesions,17,21,22,31,33,40 but, to the best of our knowledge, there are no studies using these autofluorescence methods in AC diagnosis. The use of the tissue autofluorescence widefield imaging system in this group of AC patients was useful in the clinical differentiation of AC lip from healthy lip and in the selection of the best area for incisional biopsy. Autofluorescence general appearance was reasonably heterogeneous in AC even in cases having a subtle clinical presentation and it was especially important in the identification of light red macules. Also, the autofluorescence imaging system, alone or combined with clinical exam, was used to detect most of the areas histopathologically classified as moderate and severe ED (39 cases; 78% of only moderate and severe ED), which are considered high-risk grades for malignant transformation.14,15,41 Nevertheless, the autofluorescence exam, with or without the use of clinical exam in the diagnostic approach, indicates most cases with mild or no ED (52 cases; 82.5%). The aforementioned findings reinforce the impression that this device may be helpful in confirming the diagnosis of premalignant and malignant conditions, but it is not helpful in discriminating low-risk lesions from high-risk lesions without the clinical interpretation.21,22,28,32,33,36 Yet, the value of this technology is remarkable in cases of apparently normal mucosa or semi-mucosa having an LOF appearance in patients with AC and other potentially malignant disorders or a previous history of oral cancer.19,22,28,31 Promising results were obtained by this study for an operator-independent classification by means of an automated algorithm. Using K-means clustering algorithm, fluorescence images were processed, improving the discrimination of the heterogeneous fluorescence of AC patients. Due to the inherent curvature of the lower lip, the central part of the illuminated area received a higher excitation intensity, resulting, in general, in a higher fluorescence intensity in this region and a lower resolution contrast at the image borders. Even with this nonuniform illumination condition, present in all cases of normal and AC lips, the proposed image processing showed relevant results. The heterogeneous fluorescence intensity distribution was the main feature observed in AC lips; so a threshold value of number of clustering areas was defined in this diagnostic algorithm. Misclassified lips showed, in the clinical assessment, hyperpigmentation, ulceration, and dryness. These false results reinforce the fact that fluorescence imaging is an auxiliary diagnostic tool and does not replace clinical examination. Tissue autofluorescence visualization presents additional information for the clinician to improve diagnostic resolution, as also stated by some authors when reporting that LOF is not useful in diagnosing premalignant and malignant conditions if the associated clinical interpretation is not performed with caution.22,33 The values of sensitivity and specificity for the tissue autofluorescence imaging system in the identification of oral dysplastic or malignant lesions vary in the literature. Studies evaluating patients at risk for oral cancer revealed sensitivity values varying from 98 to 100% and specificity values varying from 80.8 to 100% when discriminating normal mucosa and benign lesion from ED and cancer,21,28,33 but these values vary from 30 to 84% of sensitivity and from 15.3 to 63% of specificity in the identification of ED.22,36 A study using the autofluorescence imaging system coupled with an objective imaging analysis, similar to the present study, found 100% of sensitivity and 91.4% of specificity in the discrimination of normal tissue from ED and malignancy.40 Our results of 80.7% sensitivity and 78.3% specificity show the potential of autofluorescence imaging as an auxiliary tool to discriminate AC in lower lip. This lower diagnostic resolution was already expected, since the AC tissue condition is more similar to the normal tissue, than the alterations observed at a carcinoma. In addition, as the present results showed, even a normal lip may present clinical variations, such as areas of hyperpigmentation, fissures, hypopigmentation, dryness, and punctiform red spots. Therefore, the autofluorescence from an AC lip will not be as distinct as the one from a normal lip, when compared to the autofluorescence seen in an SCC lip. The use of more complex algorithms and the addition of other fluorescence features may result in higher sensitivity and specificity. Tissue autofluorescence widefield imaging system seems to be a valuable technique for assisting AC diagnosis, mainly in the identification of suspicious areas for incisional biopsy. However, it does not substitute clinical examination because LOF may represent benign variations that do not indicate a propensity to malignant development. As a result, the association of the autofluorescence technique with the physical exam may contribute to enhance our naked eye visualization in the identification of potentially malignant changes in this clinically heterogeneous lesion. AcknowledgmentsWe would like to thank Fundação Carlos Chagas Filho de Amparo à Pesquisa do Estado do Rio de Janeiro (FAPERJ), Fundação de Amparo à Pesquisa do Estado de São Paulo (FAPESP), and Conselho Nacional de Desenvolvimento Científico e Tecnológico (CNPq) for the financial support. ReferencesG. E. Kaugarset al.,
“Actinic cheilitis: a review of 152 cases,”
Oral Surg. Oral Med. Oral Pathol. Oral Radiol. Endod., 88
(2), 181
–186
(1999). http://dx.doi.org/10.1016/S1079-2104(99)70115-0 1079-2104 Google Scholar
A. MarkopoulosE. Albanidou-FarmakiI. Kayavis,
“Actinic cheilitis: clinical and pathologic characteristics in 65 cases,”
Oral Dis., 10
(4), 212
–216
(2004). http://dx.doi.org/10.1111/odi.2004.10.issue-4 1354-523X Google Scholar
A. S. R. CavalcanteA. L. AnbinderY. R. Carvalho,
“Actinic cheilitis: clinical and histological features,”
J. Oral Maxillofac. Surg., 66
(3), 498
–503
(2008). http://dx.doi.org/10.1016/j.joms.2006.09.016 JOMSDA 0278-2391 Google Scholar
I. van der Waal,
“Potentially malignant disorders of the oral and oropharyngeal mucosa; terminology, classification and present concepts of management,”
Oral Oncol., 45
(4–5), 317
–323
(2009). http://dx.doi.org/10.1016/j.oraloncology.2008.05.016 EJCCER 1368-8375 Google Scholar
N. W. SavageC. McKayC. Faulkner,
“Actinic cheilitis in dental practice,”
Australian Dental J., 55
(Suppl 1), 78
–84
(2010). http://dx.doi.org/10.1111/adj.2010.55.issue-s1 ADEJA2 0045-0421 Google Scholar
J. L. Junqueiraet al.,
“Actinic cheilitis among agricultural workers in Campinas, Brazil,”
Community Dent. Health, 28
(1), 60
–63
(2011). CDHEES Google Scholar
P. R. Martins-FilhoL. C. Da SilvaM. R. Piva,
“The prevalence of actinic cheilitis in farmers in a semi-arid northeastern region of Brazil,”
Int. J. Dermatol., 50
(9), 1109
–1114
(2011). http://dx.doi.org/10.1111/ijd.2011.50.issue-9 IJDEBB 0011-9059 Google Scholar
E. E. de Souza Lucenaet al.,
“Prevalence and factors associated to actinic cheilitis in beach workers,”
Oral Dis., 18
(6), 575
–579
(2012). http://dx.doi.org/10.1111/odi.2012.18.issue-6 1354-523X Google Scholar
D. D. PicasciaJ. K. Robinson,
“Actinic cheilitis: a review of the etiology, differential diagnosis, and treatment,”
J. Am. Acad. Dermatol., 17
(2 Pt 1), 255
–264
(1987). http://dx.doi.org/10.1016/S0190-9622(87)70201-1 JAADDB 0190-9622 Google Scholar
J. G. de VisscherI. van der Waal,
“Etiology of cancer of the lip. A review,”
Int. J. Oral Maxillofac. Surg., 27
(3), 199
–203
(1998). http://dx.doi.org/10.1016/S0901-5027(98)80010-6 IJOSE9 0901-5027 Google Scholar
Y. T. JadotteR. A. Schwartz,
“Solar cheilosis: an ominous precursor: part I. Diagnostic insights,”
J. Am. Acad. Dermatol., 66
(2), 173
–184
(2012). http://dx.doi.org/10.1016/j.jaad.2011.09.040 JAADDB 0190-9622 Google Scholar
J. H. MainM. Pavone,
“Actinic cheilitis and carcinoma of the lip,”
J. Can. Dent. Assoc., 60
(2), 113
–116
(1994). JCDAAS 0008-3372 Google Scholar
M. M. S. NicoE. A. RivittiS. V. Lourenco,
“Actinic cheilitis: histologic study of the entire vermilion and comparison with previous biopsy,”
J. Cutan. Pathol., 34
(4), 309
–314
(2007). http://dx.doi.org/10.1111/cup.2007.34.issue-4 JCUPBN 0303-6987 Google Scholar
P. M. Speight,
“Update on oral epithelial dysplasia and progression to cancer,”
Head Neck Pathol., 1
(1), 61
–66
(2007). http://dx.doi.org/10.1007/s12105-007-0014-5 1936-055X Google Scholar
S. Warnakulasuriyaet al.,
“Oral epithelial dysplasia classification systems: predictive value, utility, weaknesses and scope for improvement,”
J. Oral Pathol. Med., 37
(3), 127
–133
(2008). http://dx.doi.org/10.1111/j.1600-0714.2007.00584.x JPMEEA 0904-2512 Google Scholar
F. C. Xavieret al.,
“WNT-5A, but not matrix metalloproteinase 3 or beta-catenin protein, expression is related to early stages of lip carcinogenesis,”
J. Oral Pathol. Med., 38
(9), 708
–715
(2009). http://dx.doi.org/10.1111/jop.2009.38.issue-9 JPMEEA 0904-2512 Google Scholar
K. Onizawaet al.,
“Usefulness of fluorescence photography for diagnosis of oral cancer,”
Int. J. Oral Maxillofac. Surg., 28
(3), 206
–210
(1999). http://dx.doi.org/10.1016/S0901-5027(99)80140-4 IJOSE9 0901-5027 Google Scholar
W. H. WestraD. Sidransky,
“Fluorescence visualization in oral neoplasia: shedding light on an old problem,”
Clin. Cancer Res., 12
(22), 6594
–6597
(2006). http://dx.doi.org/10.1158/1078-0432.CCR-06-2253 CCREF4 1078-0432 Google Scholar
C. F. Pohet al.,
“Direct fluorescence visualization of clinically occult high-risk oral premalignant disease using a simple hand-held device,”
Head Neck, 29
(1), 71
–76
(2007). http://dx.doi.org/10.1002/(ISSN)1097-0347 HEANEE 1097-0347 Google Scholar
I. Pavlovaet al.,
“Understanding the biological basis of autofluorescence imaging for oral cancer detection: high-resolution fluorescence microscopy in viable tissue,”
Clin. Cancer Res., 14
(8), 2396
–2404
(2008). http://dx.doi.org/10.1158/1078-0432.CCR-07-1609 CCREF4 1078-0432 Google Scholar
P. Laneet al.,
“Simple device for the direct visualization of oral cavity tissue fluorescence,”
J. Biomed. Opt., 11
(2), 024006
(2006). http://dx.doi.org/10.1117/1.2193157 JBOPFO 1083-3668 Google Scholar
C. S. Farahet al.,
“Efficacy of tissue autofluorescence imaging (VELScope) in the visualization of oral mucosal lesions,”
Head Neck, 34
(6), 856
–862
(2012). http://dx.doi.org/10.1002/hed.v34.6 HEANEE 1097-0347 Google Scholar
D. C. de Veldet al.,
“The status of in vivo autofluorescence spectroscopy and imaging for oral oncology,”
Oral Oncol., 41
(2), 117
–131
(2005). http://dx.doi.org/10.1016/j.oraloncology.2004.07.007 EJCCER 1368-8375 Google Scholar
D. Roblyeret al.,
“Multispectral optical imaging device for in vivo detection of oral neoplasia,”
J. Biomed. Opt., 13
(2), 024019
(2008). http://dx.doi.org/10.1117/1.2904658 JBOPFO 1083-3668 Google Scholar
S. P. Schantzet al.,
“In vivo native cellular fluorescence and histological characteristics of head and neck cancer,”
Clin. Cancer Res., 4
(5), 1177
–1182
(1998). CCREF4 1078-0432 Google Scholar
A. Gillenwateret al.,
“Noninvasive diagnosis of oral neoplasia based on fluorescence spectroscopy and native tissue autofluorescence,”
Arch. Otolaryngol. Head Neck Surg., 124
(11), 1251
–1258
(1998). http://dx.doi.org/10.1001/archotol.124.11.1251 AONSEJ 0886-4470 Google Scholar
N. Ramanujam,
“Fluorescence spectroscopy of neoplastic and non-neoplastic tissues,”
Neoplasia, 2
(1–2), 89
–117
(2000). http://dx.doi.org/10.1038/sj.neo.7900077 1522-8002 Google Scholar
A. Moroet al.,
“Autofluorescence and early detection of mucosal lesions in patients at risk for oral cancer,”
J. Craniofac. Surg., 21
(6), 1899
–1903
(2010). http://dx.doi.org/10.1097/SCS.0b013e3181f4afb4 JSURE8 1049-2275 Google Scholar
R. Quinlan, C4.5: Programs for Machine Learning, Morgan Kaufmann Publishers, San Mateo, CA
(1993). Google Scholar
E. Kornevset al.,
“5 year experience with lower lip cancer,”
Stomatologija, 7
(3), 95
–98
(2005). Google Scholar
C. F. Pohet al.,
“Fluorescence visualization detection of field alterations in tumor margins of oral cancer patients,”
Clin. Cancer Res., 12
(22), 6716
–6722
(2006). http://dx.doi.org/10.1158/1078-0432.CCR-06-1317 CCREF4 1078-0432 Google Scholar
F. P. Kochet al.,
“Effectiveness of autofluorescence to identify suspicious oral lesions—a prospective, blinded clinical trial,”
Clin. Oral Investig., 15
(6), 975
–982
(2011). http://dx.doi.org/10.1007/s00784-010-0455-1 1432-6981 Google Scholar
M. Scheeret al.,
“Autofluorescence imaging of potentially malignant mucosa lesions,”
Oral Surg. Oral Med. Oral Pathol. Oral Radiol. Endod., 111
(5), 568
–577
(2011). http://dx.doi.org/10.1016/j.tripleo.2010.12.010 1079-2104 Google Scholar
C. S. Betzet al.,
“Autofluorescence imaging and spectroscopy of normal and malignant mucosa in patients with head and neck cancer,”
Lasers Surg. Med., 25
(4), 323
–334
(1999). http://dx.doi.org/10.1002/(ISSN)1096-9101 LSMEDI 0196-8092 Google Scholar
E. Svistunet al.,
“Vision enhancement system for detection of oral cavity neoplasia based on autofluorescence,”
Head Neck, 26
(3), 205
–215
(2004). http://dx.doi.org/10.1002/(ISSN)1097-0347 HEANEE 1097-0347 Google Scholar
K. H. AwanP. R. MorganS. Warnakulasuriya,
“Evaluation of an autofluorescence based imaging system (VELscope™) in the detection of oral potentially malignant disorders and benign keratosis,”
Oral Oncol., 47
(4), 274
–277
(2011). http://dx.doi.org/10.1016/j.oraloncology.2011.02.001 EJCCER 1368-8375 Google Scholar
D. C. de Veldet al.,
“Autofluorescence characteristics of healthy oral mucosa at different anatomical sites,”
Lasers Surg. Med., 32
(5), 367
–376
(2003). http://dx.doi.org/10.1002/(ISSN)1096-9101 LSMEDI 0196-8092 Google Scholar
S. Imayamaet al.,
“Ultraviolet-B irradiation deforms the configuration of elastic fibers during the induction of actinic elastosis in rats,”
J. Dermatol. Sci., 7
(1), 32
–38
(1994). http://dx.doi.org/10.1016/0923-1811(94)90019-1 JDSCEI 0923-1811 Google Scholar
D. C. de Veldet al.,
“Effects of individual characteristics on healthy oral mucosa autofluorescence spectra,”
Oral Oncol., 40
(8), 815
–823
(2004). http://dx.doi.org/10.1016/j.oraloncology.2004.02.006 EJCCER 1368-8375 Google Scholar
D. Roblyeret al.,
“Objective detection and delineation of oral neoplasia using autofluorescence imaging,”
Cancer Prev. Res., 2
(5), 423
–431
(2009). http://dx.doi.org/10.1158/1940-6207.CAPR-08-0229 JSURE8 1049-2275 Google Scholar
O. Kujanet al.,
“Evaluation of a new binary system of grading oral epithelial dysplasia for prediction of malignant transformation,”
Oral Oncol., 42
(10), 987
–993
(2006). http://dx.doi.org/10.1016/j.oraloncology.2005.12.014 EJCCER 1368-8375 Google Scholar
|
||||||||||||||||||||||||||||||||||||||||||||||||||||||||||||||||||||||||||||||||||||||||||||||||||||||||||||||||||||


