

|
|
1.IntroductionThe cornea and anterior segment imaging system was first introduced using time-domain optical coherence tomography (OCT) (Carl Zeiss, Inc., Dublin, California), with a light source operating at a central wavelength of 830 nm, and was able to reconstruct cross-sectional images (B-scans) of only a small portion of the anterior segment, with an imaging speed of 100 to 400 1,2 In 2000,3an OCT system was implemented with a 1310 nm superluminescent diode capable of covering a larger portion of the anterior segment, including the entire cross-sectional structure of the cornea. A few years later, a commercial 1310 nm time-domain OCT system for in vivo anterior segment imaging was launched, Visante™ OCT (Carl Zeiss, Inc.), with axial resolution of 18 μm and an imaging speed of 2000 . The introduction of Fourier-domain OCT,4–6 due to the advantage of increased sensitivity and acquisition speed,7–9 permitted three-dimensional (3-D) imaging with rather short depth range ( in tissue).10,11 Originally, commercial spectrometer-based Fourier-domain OCT systems (spectral OCTSD-OCT) had been designed for retinal imaging and offered an axial resolution of 3 to 7 μm and imaging speeds of 20,000 to 50,000 . However, they are not able to provide adequate assessment of anterior and posterior corneal topography because of both limited depth range and sensitivity drop-off typical for spectral domain (SD)-OCT.12,13 Despite, these limitations retinal imaging instruments can be applied to anterior chamber imaging by the use of additional lenses to enable imaging beam focusing at the front of the eye.14,15 As an alternative, swept source (SS) OCT can provide volumetric images of ocular structure with micrometer resolution and high speed.16–22 OCT SS-1000 “CASIA” from Tomey Corporation is a dedicated OCT system for anterior segment imaging only, but it has limitations in resolution (10 μm, axial; 30 μm, transverse) and scanning speed of 30,000 .23 The major advantages for SS-OCT systems developed recently by several groups24–33 include improved speed and sensitivity and better tissue penetration due to the application of longer wavelengths to improve imaging of iris, sclera, or irido-scleral angle. Currently, there is demand in clinical ophthalmic practice for imaging of the full architecture of the cornea, iris, and crystalline lens. Large-scale imaging covering the depth of in tissue and a large () transverse range enables quantification of morphometric parameters including corneal thickness and topography, the corneo-scleral angle, and orientation of intraocular lenses, among others.30 New applications of OCT include full eye length imaging and the investigation of post-surgery biometry in ocular tissues.34 In clinical settings, precise quantitative assessment of the anterior segment is also critical in evaluation of surgical outcomes, such as for the KPro. A robust high-speed volumetric SS-OCT system that extends our ability to image and evaluate in 3-D the full architecture of the anterior segment of the human eye was, therefore, developed. 2.Materials and MethodsThe Keratoprosthesis (KPro) has been recognized as a viable alternative to penetrating keratoplasty in the treatment of selective patients with corneal blindness, particularly after repeated graft failures. The Boston KPro™ is illustrated in Fig. 1. The KPro35–38 includes a central optical cylinder. A donor cornea is placed between the front and back plates, and the combination is sutured into the patient’s corneal opening. The holes in the back plate allow the aqueous humor to diffuse into the donor cornea. For the type 1KPro, a soft contact lens (usually a Kontur™Lens; Kontur Contact Lens Co., Hercules, CA), 16 mm diameter and 9.8 mm base curvature, plano power, is placed as a bandage lens. The type 2 KPro [Fig. 1(b)] has an anterior cylinder, enabling it to protrude through an opening in the closed lid in patients with severe dry eye [Fig. 1(c)]. Our SS-OCT system is capable of evaluating the KPro position and its interaction with surrounding tissue in vivo after surgical procedures. Fig. 1Images of Boston Keratoprosthesis (KPro) type 1 (a) and type 2 (b). Different components of KPro (c), FP: front plate, OC: optical cylinder, CG: corneal graft, BP: back plate, and LR: locking ring.  Currently available commercial OCT systems for imaging of in vivo anterior segment are limited by shallow scan depth range, image acquisition speed, and poor ability to penetrate tissues that produce high light scatter (e.g., sclera, limbus). These limitations prevent image capture of a cross section of the entire anterior segment (or KPro) in a single B-scan.15 To overcome these limitations, we report on the development and implementation of a switchable imaging depth range SS-OCT system (3.7 to 11.5 mm in air) with 4.5 μm axial resolution, higher image acquisition speed (100 kHz), and deep tissue penetration. This new system was successfully implemented to acquire images of the full anterior segment in patients with the Boston KPro. A schematic diagram of our 1 μm SS-OCT system is shown in Fig. 2. An external cavity tunable laser, from Axsun Technologies, with a central wavelength of 1060 nm, sweep bandwidth of 110 nm, repetition rate of 100 kHz, 46% duty cycle, and average output power of , was used as the light source. A spectrally balanced Michelson fiber interferometer configuration was used with three fiber couplers (AC Photonics, Santa Clara, California).39 To achieve a complex conjugate resolved SS-OCT system, cavity offset configuration of the laser was used to take advantage of the Axun’s SS “coherence revival.”40 The sample port was attached to a scanning head, which consists of a fiber collimator lens (12.38 mm, focal length, TC12APC-1064, Thorlabs, Inc., Newton, New Jersey), a two-axis galvo mirror (Cambridge Technology, Bedford, Massachusetts), and interchangeable achromatic doublets with two different focal lengths. The reference port of the fiber coupler is attached to a reference unit comprising a collimator lens, an achromatic doublet lens, and a static silver-coated mirror. Fig. 2(a) Schematic of SS-OCT system. Swept source laser 1060 nm (Axsun Technologies). FBG: fiber Bragg grating, FC: fiber coupler, GS: galvanometer scanning mirrors, M: mirror, BPD: balanced photodetectorr, PC: polarization controller, LP: polarizer, RF Amp: RF amplifier, BD: beam dump, UP: unused port, OI: optical isolator, BPD 1: PDB430C-AC, Thorlabs, BPD 2: WL-BPD1GA, Wiserlabs, OSA: optical spectrum analyzer, DAQ 1: A/D converter (ATS9350), DAQ 2: A/D converter (ATS9870), L1: 30 mm lens, and L2: 75 mm lens. (b and c) FBG traces in the OCT interferogram before and after numerical trigger jitter correction.  The galvanometric scanner steering the probe beam is controlled by a data acquisition (DAQ) board (PCI-6363, National Instruments, TX). The probing beam power at the sample was set at 1.85 mW, which is lower than the American National Standards Institute for maximum permissible exposure. The back-scattered light from the sample is combined with the light back-reflected from the reference arm at the coupler. For short-range “standard” imaging (3.7 mm in air), a 30 mm (NA: 0.05) focal length lens was used in our OCT scanning head. The OCT signal was detected by a balanced photodetector (PDB430C-AC, 100 Hz to 350 MHz, Thorlabs). SS-OCT signal acquisition was triggered by the k-clock signal generated by an internal Mach–Zehnder interferometer of the Axsun OCT engine. In this mode, the transverse resolution was 13.5 μm. For long-range imaging (11.5 mm in air), a longer focal length scan lens (75 mm with NA: 0.02) in the scanning head was used to increase the Rayleigh range (depth of focus) of this configuration to match the long imaging range; however, this resulted in a larger focal spot which compromises lateral resolution (34 μm). The OCT signal in this configuration was detected by a balanced photodetector with a bandwidth of DC to 1 GHz (WL-BPD1GA, Wiserlabs, Munich, Germany) followed by an radio-frequency (RF) amplifier. In order to resample the data, a recalibration vector41 was calculated from the digitized k-clock signal (acquired digitizer card). In this system, two depth ranges can be changed by swapping one imaging lens, changing the SS-OCT detector (reconnecting fibers to a different balanced detector and adjusting the axial position of the mirror in the reference arm to match the optical path delay to the focal position of the imaging lens). Only one reference arm was used for both depth range modes. For the short range imaging mode, a digitizer card (8 bit) can be used, but image quality was limited by bit resolution compared with a 12-bit card. In our system, the interference signal can be digitized by one of two DAQ boards, ATS9870 (8-bit resolution and sampling rate of , Alazar Technologies Inc., Pointe-Claire, QC) and ATS9350 (12-bit resolution and sampling rate of , Alazar Technologies Inc.) for long-range and short-range imaging, respectively. One of the problems with SS-OCT systems, including those using the Axsun laser, is fluctuation in the A-scan trigger. This need to be compensated in order to achieve efficient removal of coherent noise for precise phase measurements. If not compensated for it has great impact on B-scan quality, including horizontal lines (coherent noise) on the OCT images [white arrows in Fig. 4(a) and 4(b)]. There are several existing methods to compensate for phase instability.41–46 Here, we describe a novel and robust method that provides a simple solution to this problem. Our method used a fixed wavenumber reference signal from a fiber Bragg grating (FBG, OE Land, Quebec, Canada, , , ) inserted in transmission mode after the source, as shown in Fig. 2(a). This allows us to avoid loss in OCT signal intensity due to insertion loss of the FBG placed in one of the balanced detection arms.45 Moreover, we do not need any additional fiber to compensate for the relative time delay in the detection arm. The necessary shifts in the acquired SS-OCT signal can be calculated based on the first falling slope of the signal around the FBG signal. This operation is computationally straightforward. This phase-stabilization method also helps the phase-sensitive measurement. For long range, an electronic delay was applied on the A-line trigger due to a “pretrigger” acquisition problem for the ATS9870 card. Then, the OCT spectrum was aligned based on the method above, and the same numerical shift was applied for the corresponding k-clock signal for proper rescaling of OCT data. This allows the coherence noise seen on the B-scans (line artifacts) to be minimized. 3.ResultsBoth the clock and receiver signals were acquired using custom-designed LabVIEW software. SS-OCT data preprocessing included fixed pattern noise removal, rescaling of the spectral data to remove sweep nonlinearities, spectral shaping, zero padding, numerical dispersion compensation, and an inverse FFT. Fall-off profiles for both depth range configurations were measured (Fig. 3). For short depth range, peak sensitivity of 98 dB was measured with 1.85 mW incident on the sample. A fall in the deepest position was observed with respect to the “zero position.” A peak sensitivity of 98 dB was also monitored for long-depth range for [Fig. 3(b)] offsets. The fall-off in sensitivity at the deepest position compared to the central position was for long range. The imaging ranges were 3.7 and 11.5 mm in air for the short-depth and long-depth range offsets, respectively. The theoretical shot noise limit for this system was 102 dB.16 The discrepancy between the measured and theoretical sensitivity is probably due to coupling losses in the fiber, unbalanced RIN, digitization noise due to the low effective number of bits of the digitizer as well as amplification noise from the RF amplifier. Nearly no loss in sensitivity was observed due to “coherence revival” for the long-range imaging mode (between cavity offset and cavity offset).40 Fig. 3Fall-off measurements from the changeable depth range system for (a) short depth range and (b) long-depth range ( cavity length offset).  For purposes of this study, two healthy volunteers and two patients with the Boston KPro were imaged without pupil dilation. Written informed consent was obtained under protocols approved by the Institutional Review Board of the University of California Davis. In the cross-sectional images (B-scans), the intensity of light scattered and/or reflected from the internal structures within the sample was coded using a logarithmic intensity gray scale. For 3-D data visualization, we used our previously described volume visualization software (IDAV 1.0).47 Using the high-resolution mode (short depth range; 30 mm focal length objective, and k-clock triggered DAQ) it is possible to visualize detailed morphology in different areas of the anterior segment. In Fig. 4, an example of a high quality crosssectional image of the cornea and junction between the cornea and sclera (angle) is shown. Top (a, b) and bottom (c, d) panels of Fig. 4 present the B-scans (average of 10 frames) at the same position before and after phase stabilization, respectively. The trabecular meshwork and Schlemm’s canal can be seen as well. Deep image penetration enables visualization of the iris and anterior angle through the sclera. The 1060 nm imaging system achieves axial resolution of 4.5 μm which is sufficient to distinguish epithelium and delineate the position of Bowman’s membrane. Fig. 4SS-OCT images of human anterior eye segments (a) short-range imaging of cornea (); CE: corneal epithelium, BL: Bowman’s layer, CS: corneal stroma, and CEN: corneal endothelium. (b) Irido-corneal angle (); SL: sclera, IS: iris stroma, IPE: iris pigment epithelium, SS: scleral spur, TM: trabecular meshwork, SC: Schlemm’s canal, and ICA: iridocorneal angle opening. Top panel (a, b) and bottom panel (c, d) shows the images before and after phase stabilization, respectively. Thick arrows shows artifacts.  A comparison between short-range images of the cornea acquired using the 8-bit [Fig. 5(a)] and 12-bit [Fig. 5(b)] digitizer cards, respectively, with the same imaging conditions (30 mm objective lens, external triggering with source -clock, acquisition speed) was presented. Figure 5(d) shows a B-scan image from the full-range imaging configuration (75 mm focal length objective and internal clock triggered DAQ). The figure shows the cornea, iris, and anterior surface of the lens acquired in a single B-scan. Figure 5(e) shows a 3-D visualization of the volumetric data set acquired with the same configuration. Fig. 5(a and b) Short range imaging of cornea acquired with 8- and 12-bit digitizer card, respectively, with the same imaging conditions; (c) en face projection view [arrow shows the position of B-scan (d)]; (d) full range imaging of anterior chamber [image comprise pixels spanning 14 mm (axial)]. Each image represents five averaged frames. (C: cornea, corneal epithelium, SL: sclera, IS: iris stroma, IPE: iris pigment epithelium, and CL: crystalline lens); (e) in vivo3-D reconstruction of the anterior segment of human eye. (Image reconstructed from voxel data set. The size of the imaged volume is .)  Using these short-range imaging modes, two KPro patients, one with corneal graft melting [Fig. 6(c)] and another with a growing epithelial layer [Fig. 6(d)] were imaged. We obtained high-resolution images of the KPro, visible as a T-shaped cylinder with corrugated sides through the center of the cornea [Fig. 6(d) and 6(e)]. Fig. 6(a) Slit-lamp photograph of the type 1KPro (arrow shows the position of B-scan for d), (b) Total OCT intensity projection view, short-range imaging KPro ( comprised of pixels) for patient with corneal graft melting (arrow shows the position of B-scan for c), (c) KPro with corneal graft melting region denoted by red dashed ellipse, (d) KPro with growing epithelial layer over front plate, image represents five averaged frames, (e) another B-scan from patient shown in (d). Arrows show epithelial layer (EL) and mucus layer (ML). FP: front plate, OC: optical cylinder, CG: corneal graft, BP: back plate, HC: peripheral host cornea, LR: locking ring, and IS: iris. 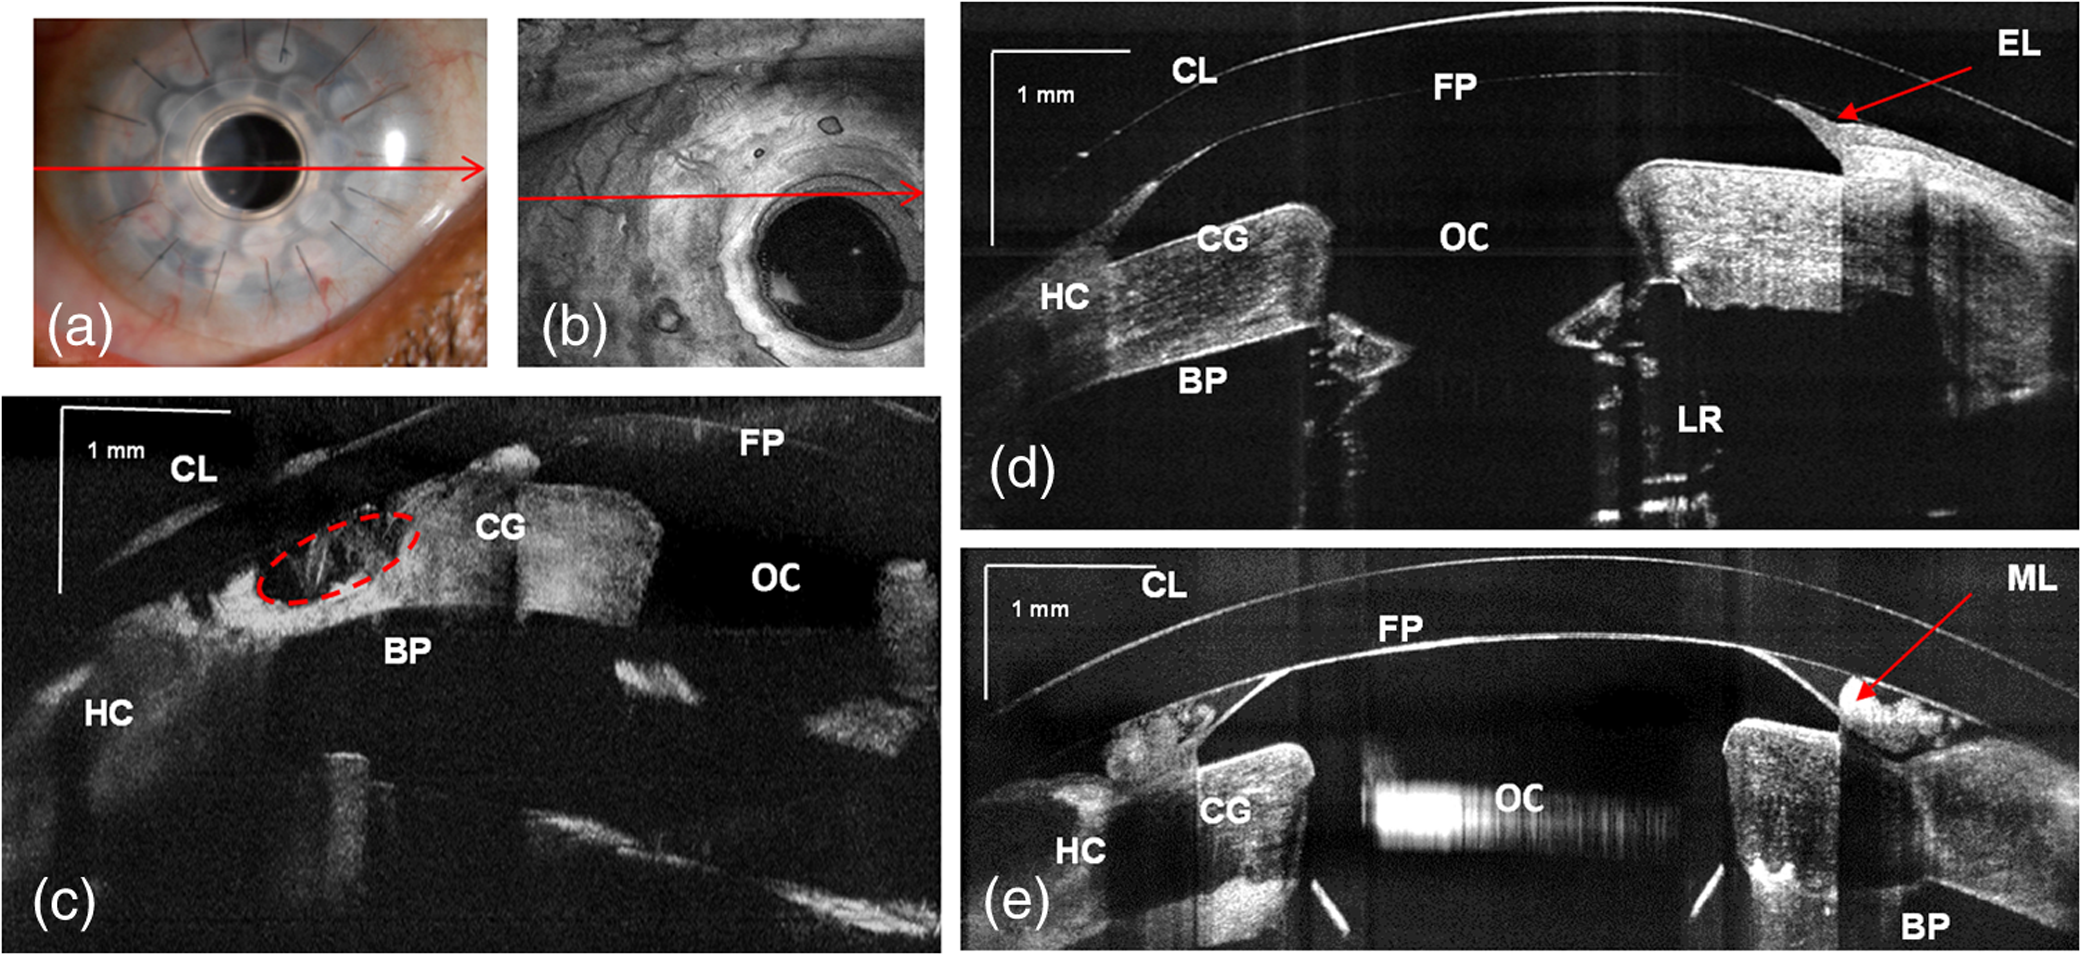 The bandage contact lens, front plate, optical cylinder, back plate, the carrier corneal graft, and the graft host junction were distinctly visualized in the images [Fig. 6(d) and 6(e)]. This high-resolution mode reveals the epithelial layer growing over the front plate [Fig. 6(d), red arrow)] and corneal graft melting [Fig. 6(c), red circle)]. It also has the potential to detect the presence of retroprosthetic membranes, epithelial downgrowth, corneal thinning in the carrier graft and periprosthetic gaps, spaces, or cysts. In a single image, we can observe the entire anterior segment and KPro components, which were not visualized with the slit lamp or the Spectralis™ systems. By using the extended depth range, we obtained full range images of the KPro (contact lens, front plate back plate, optical cylinder, locking ring, and iris) in a single B-scan [Fig. 7(c)] for a patient with growing epithelial layer over the front plate. Fig. 7(a) Total OCT intensity projection view for long-range imaging of the type 1KPro, (arrow shows the position of B-scan (c), (b) OCT C-scan image of backplate, (c) tomogram of full type 1KPro[image comprise 2000 (axial) pixels spanning 14 mm ( (axial)]; image represents average of five frames; (d) in vivo large-scale 3-D volume rendering of KPro (images are reconstructed from voxel data set. The size of the imaged volume is . FP: front plate, OC: optical cylinder, CG: corneal graft, BP: back plate, HC: peripheral host cornea, LR: locking ring, and IS: iris.  This information is important for studying the adaptation and orientation of the implant in the anterior segment. We were able to distinguish precise components of the KPro and carrier graft as well as to exquisitely visualize the relationship of the epithelium to both the anterior and posterior surfaces of the KPro front plate. Holes on the back plate are clearly visible [Fig. 7(b)]. This imaging mode can be used to evaluate the components of the assembled KPro in vivo, with visualization of the donor cornea interface and to assess the presence of a potential space between the KPro front plate, the optical cylinder, and the corneal graft. Furthermore, we can explore in greater detail, using the 3-D reconstructed image, complications such as retroprosthetic membrane formation, epithelial downgrowth, stromal necrosis, and corneal thinning in 3-D. 4.SummaryIn conclusion, we demonstrated a high-speed complex conjugate resolved 1 μm SS-OCT system using coherence revival applied to ophthalmic imaging of the human anterior segment. This high-speed imaging enables 3-D visualization of the anterior segment with a reduction of motion artifact. An easily switchable axial imaging range is important in both high resolution and large depth range imaging of the full anterior segment needed during evaluation of a patient. The time needed to switch between the two system configurations is . We were also able to demonstrate novel and highly detailed visual information for KPro patients compared to images obtained with the existing commercial systems. The preliminary images obtained with this system demonstrate the possibility of high speed and high resolution imaging of large volumes needed to assess KPro implants and other conditions of the anterior segment. AcknowledgmentsWe gratefully acknowledge the contributions of VSRI UC Davis laboratory members especially R. Jonnal for his help with the A-line registration program. The help of J.A. Izatt and A.H. Dhalla, Department of Biomedical Engineering, Duke University, is greatly appreciated. This research was supported by the National Eye Institute (EY 014743) and Research to Prevent Blindness (RPB), Inc. ReferencesJ. A. Izattet al.,
“Micrometer-scale resolution imaging of the anterior eye in-vivo with optical coherence tomography,”
Arch.Ophthalmol., 112
(12), 1584
–1589
(1994). http://dx.doi.org/10.1001/archopht.1994.01090240090031 AROPAW 0003-9950 Google Scholar
M. J. Maldonadoet al.,
“Optical coherence tomography evaluation of the corneal cap and stromal bed features after laser in situ keratomileusis for high myopia and astigmatism,”
Ophthalmology, 107
(1), 81
–87
(2000). http://dx.doi.org/10.1016/S0161-6420(99)00022-6 OPANEW 0743-751X Google Scholar
H. Hoeraufet al.,
“Slit-lamp-adapted optical coherence tomography of the anterior segment,”
Graefes Arch. Clin. Exp. Ophthalmol., 238
(1), 8
–18
(2000). http://dx.doi.org/10.1007/s004170050002 GACODL 0721-832X Google Scholar
A. Fercheret al.,
“Measurement of intraocular distances by backscattering spectral interferometry,”
Opt. Commun., 117
(1–2), 43
–48
(1995). http://dx.doi.org/10.1016/0030-4018(95)00119-S OPCOB8 0030-4018 Google Scholar
G. HäuslerM. W. Lindner,
“‘Coherence Radar’ and ‘Spectral Radar’—new tools for dermatological diagnosis,”
J. Biomed. Opt., 3
(1), 21
–31
(1998). http://dx.doi.org/10.1117/1.429899 JBOPFO 1083-3668 Google Scholar
M. Wojtkowskiet al.,
“In vivo human retinal imaging by Fourier domain optical coherence tomography,”
J. Biomed. Opt., 7
(3), 457
–463
(2002). http://dx.doi.org/10.1117/1.1482379 JBOPFO 1083-3668 Google Scholar
J. F. de Boeret al.,
“Improved signal-to-noise ratio in spectral-domain compared with time-domain optical coherence tomography,”
Opt. Lett., 28
(21), 2067
–2069
(2003). http://dx.doi.org/10.1364/OL.28.002067 OPLEDP 0146-9592 Google Scholar
R. LeitgebC. HitzenbergerA. Fercher,
“Performance of Fourier domain vs. time domain optical coherence tomography,”
Opt. Express, 11
(8), 889
–894
(2003). http://dx.doi.org/10.1364/OE.11.000889 OPEXFF 1094-4087 Google Scholar
M. A. Chomaet al.,
“Sensitivity advantage of swept source and Fourier domain optical coherence tomography,”
Opt. Express, 11
(18), 2183
–2189
(2003). http://dx.doi.org/10.1364/OE.11.002183 OPEXFF 1094-4087 Google Scholar
M. Wojtkowskiet al.,
“Three-dimensional retinal imaging with high-speed ultrahigh-resolution optical coherence tomography,”
Ophthalmology, 112
(10), 1734
–1746
(2005). http://dx.doi.org/10.1016/j.ophtha.2005.05.023 OPANEW 0743-751X Google Scholar
S. Alamet al.,
“Clinical application of rapid serial Fourier-domain optical coherence tomography for macular imaging,”
Ophthalmology, 113
(8), 1425
–1431
(2006). http://dx.doi.org/10.1016/j.ophtha.2006.03.020 OPANEW 0743-751X Google Scholar
SPECTRALIS HRA+OCT, Heidelberg Engineering, Inc., Heidelberg, Germany,
(2013) http://www.heidelbergengineering.com/us/products/spectralis-models/ March ). 2013). Google Scholar
RTVue-100, Optovue Corp., Fremont, CA,
(2013) http://www.optovue.com/products/rtvue/ March ). 2013). Google Scholar
SPECTRALIS Anterior Segment Module, Heidelberg Engineering, Inc., Heidelberg, Germany,
(2013) http://www.heidelbergengineering.com/us/products/spectralis-models/imaging-modes/anterior-segment-module/ March ). 2013). Google Scholar
B. L. Shapiroet al.,
“High-resolution spectral domain anterior segment optical coherence tomography in type 1 Boston Keratoprosthesis,”
Cornea, 32
(7), 951
–955
(2013). http://dx.doi.org/10.1097/ICO.0b013e318285c8f4 CORNDB 0277-3740 Google Scholar
S. Yunet al.,
“High-speed optical frequency-domain imaging,”
Opt. Express, 11
(22), 2953
–2963
(2003). http://dx.doi.org/10.1364/OE.11.002953 OPEXFF 1094-4087 Google Scholar
W. Y. Ohet al.,
“115 kHz tuning repetition rate ultrahigh-speed wavelength-swept semiconductor laser,”
Opt. Lett., 30
(23), 3159
–3161
(2005). http://dx.doi.org/10.1364/OL.30.003159 OPLEDP 0146-9592 Google Scholar
M. A. Chomaet al.,
“Swept source optical coherence tomography using an all-fiber 1300-nm ring laser source,”
J. Biomed. Opt., 10
(4), 044009
(2005). http://dx.doi.org/10.1117/1.1961474 JBOPFO 1083-3668 Google Scholar
R. Huberet al.,
“Amplified, frequency swept lasers for frequency domain reflectometry and OCT imaging: design and scaling principles,”
Opt. Express, 13
(9), 3513
–3528
(2005). http://dx.doi.org/10.1364/OPEX.13.003513 OPEXFF 1094-4087 Google Scholar
R. Huberet al.,
“Fourier domain mode locking (FDML): a new laser operating regime and applications for optical coherence tomography,”
Opt. Express, 14
(8), 3225
–3237
(2006). http://dx.doi.org/10.1364/OE.14.003225 OPEXFF 1094-4087 Google Scholar
R. Huberet al.,
“Buffered Fourier domain mode locking: unidirectional swept laser sources for optical coherence tomography imaging at ,”
Opt. Lett., 31
(20), 2975
–2977
(2006). http://dx.doi.org/10.1364/OL.31.002975 OPLEDP 0146-9592 Google Scholar
M. K. Leunget al.,
“High-power wavelength-swept laser in Littman telescope-less polygon filter and dual-amplifier configuration for multichannel optical coherence tomography,”
Opt. Lett., 34
(18), 2814
–2816
(2009). http://dx.doi.org/10.1364/OL.34.002814 OPLEDP 0146-9592 Google Scholar
Cornea/Anterior Segment OCT SS-1000 “CASIA”, Tomey Corp., Nagoya, Japan,
(2013) http://www.tomey.com/Products/OCT/SS-1000CASIA.html March ). 2013). Google Scholar
Y. Yasunoet al.,
“Three-dimensional and high-speed swept-source optical coherence tomography for in vivo investigation of human anterior eye segments,”
Opt. Express, 13
(26), 10652
–10664
(2005). http://dx.doi.org/10.1364/OPEX.13.010652 OPEXFF 1094-4087 Google Scholar
D. C. Adleret al.,
“Phase-sensitive optical coherence tomography at up to 370,000 lines per second using buffered Fourier domain mode-locked lasers,”
Optic. Lett., 32
(6), 626
–628
(2007). http://dx.doi.org/10.1364/OL.32.000626 OPLEDP 0146-9592 Google Scholar
M. V. Sarunicet al.,
“Imaging the ocular anterior segment with real-time, full-range Fourier-domain optical coherence tomography,”
Arch. Ophthalmol., 126
(4), 537
–542
(2008). http://dx.doi.org/10.1001/archopht.126.4.537 AROPAW 0003-9950 Google Scholar
M. Goraet al.,
“Ultra-high-speed swept source OCT imaging of the anterior segment of human eye at 200 kHz with adjustable imaging range,”
Opt. Express, 17
(17), 14880
–14894
(2009). http://dx.doi.org/10.1364/OE.17.014880 OPEXFF 1094-4087 Google Scholar
W. Wieseret al.,
“Multi-Megahertz OCT: high quality 3D imaging at 20 million A-scans and 4.5 GVoxels per second,”
Opt. Express, 18
(14), 14685
–14704
(2010). http://dx.doi.org/10.1364/OE.18.014685 OPEXFF 1094-4087 Google Scholar
B. Potsaidet al.,
“Ultrahigh speed 1050 nm swept source/Fourier domain OCT retinal and anterior segment imaging at 100,000 to 400,000 axial scans per second,”
Biomed. Opt. Express, 18
(19), 20029
–20048
(2010). http://dx.doi.org/10.1364/OE.18.020029 BOEICL 2156-7085 Google Scholar
K. Karnowskiet al.,
“Corneal topography with high-speed swept source OCT in clinical examination,”
Biomed. Opt. Express, 2
(9), 2709
–2720
(2011). http://dx.doi.org/10.1364/BOE.2.002709 BOEICL 2156-7085 Google Scholar
T. Kleinet al.,
“Multi-MHz FDML OCT: snapshot retinal imaging at 6.7 million axial-scans per second,”
Proc. SPIE, 8213 82131E
(2012). http://dx.doi.org/10.1117/12.908798 PSISDG 0277-786X Google Scholar
I. Grulkowskiet al.,
“Retinal, anterior segment and full eye imaging using ultrahigh speed swept source OCT with vertical-cavity surface emitting lasers,”
Biomed. Opt. Express, 3
(11), 2733
–2751
(2012). http://dx.doi.org/10.1364/BOE.3.002733 BOEICL 2156-7085 Google Scholar
J. J. Liuet al.,
“In vivo imaging of the rodent eye with swept source/Fourier domain OCT,”
Biomed. Opt. Express, 4
(2), 351
–363
(2013). http://dx.doi.org/10.1364/BOE.4.000351 BOEICL 2156-7085 Google Scholar
S. Ortizet al.,
“Full OCT anterior segment biometry: an application in cataract surgery,”
Biomed. Opt Express, 4
(3), 387
–396
(2013). http://dx.doi.org/10.1364/BOE.4.000387 BOEICL 2156-7085 Google Scholar
C. H. Dohlmanet al.,
“Some factors influencing outcome after keratoprosthesis surgery,”
Cornea, 13
(3), 214
–218
(1994). http://dx.doi.org/10.1097/00003226-199405000-00004 CORNDB 0277-3740 Google Scholar
M. G. DoaneC. H. Dohlman,
“Fabrication of a keratoprosthesis,”
Cornea, 15 179
–184
(1996). http://dx.doi.org/10.1097/00003226-199603000-00011 CORNDB 0277-3740 Google Scholar
P. S. Julian Garciaet al.,
“Evaluation of the stability of Boston type I Keratoprosthesis-donor cornea interface using anterior segment optical coherence tomography,”
Cornea, 29
(9), 1031
–1035
(2010). http://dx.doi.org/10.1097/ICO.0b013e3181ca2ea5 CORNDB 0277-3740 Google Scholar
A. G. Alzagaet al.,
“Boston type I Keratoprosthesis-donor cornea interface evaluated by high-definition spectral-domain anterior segment optical coherence tomography,”
Clin. Ophthalmol., 6 1355
–1359
(2012). http://dx.doi.org/10.2147/OPTH.S34787 COLPCK 1177-5483 Google Scholar
T. Kleinet al.,
“Megahertz OCT for ultrawide-field retinal imaging with a 1050 nm Fourier domain mode-locked laser,”
Opt. Express, 19
(4), 3044
–3062
(2011). http://dx.doi.org/10.1364/OE.19.003044 OPEXFF 1094-4087 Google Scholar
A. H. Dhallaet al.,
“Complex conjugate resolved heterodyne swept source optical coherence tomography using coherence revival,”
Biomed. Opt. Express, 3
(3), 633
–649
(2012). http://dx.doi.org/10.1364/BOE.3.000633 BOEICL 2156-7085 Google Scholar
J. ZhangZ. Chen,
“In vivo blood flow imaging by a swept laser source based Fourier domain optical Doppler tomography,”
Opt. Express, 13
(19), 7449
–7457
(2005). http://dx.doi.org/10.1364/OPEX.13.007449 OPEXFF 1094-4087 Google Scholar
B. Baumannet al.,
“Total retinal blood flow measurement with ultrahigh speed swept source/Fourier domain OCT,”
Biomed. Opt. Express, 2
(6), 1539
–1552
(2011). http://dx.doi.org/10.1364/BOE.2.001539 BOEICL 2156-7085 Google Scholar
B. Braafet al.,
“Phase-stabilized optical frequency domain imaging at 1-μm for the measurement of blood flow in the human choroid,”
Opt. Express, 19
(21), 20886
–20903
(2011). http://dx.doi.org/10.1364/OE.19.020886 OPEXFF 1094-4087 Google Scholar
Y. Honget al.,
“High-penetration swept source Doppler optical coherence angiography by fully numerical phase stabilization,”
Biomed. Opt. Express, 20
(3), 2740
–2760
(2012). http://dx.doi.org/10.1364/OE.20.002740 BOEICL 2156-7085 Google Scholar
H.C. Hendargoet al.,
“Doppler velocity detection limitations in spectrometer-based versus swept-source optical coherence tomography,”
Biomed. Opt. Express, 2
(8), 2175
–2188
(2011). http://dx.doi.org/10.1364/BOE.2.002175 BOEICL 2156-7085 Google Scholar
W. J. Choiet al.,
“Phase-sensitive swept-source optical coherence tomography imaging of the human retina with a vertical cavity surface-emitting laser light source,”
Opt. Lett., 38
(3), 338
–340
(2013). http://dx.doi.org/10.1364/OL.38.000338 OPLEDP 0146-9592 Google Scholar
R.J. Zawadzkiet al.,
“Adaptation of a support vector machine algorithm for segmentation and visualization of retinal structures in volumetric optical coherence tomography data sets,”
J. Biomed. Opt., 12
(4), 041206
(2007). http://dx.doi.org/10.1117/1.2772658 JBOPFO 1083-3668 Google Scholar
|


