

|
|
1.IntroductionLaser techniques development have initiated their wide medical applications.1 Nowadays lasers are successfully applied for cosmetics.2 Due to the narrow band of laser radiation, it interacts with biological tissue selectively. Additional selectivity can be achieved at tissue staining by dyes or sensitizing by inserting of nanoparticles. One of the promising laser applications is treatment of obesity and cellulites.3,4 Therefore, studies of fat tissue morphology and its changes under laser/LED induced heat/photodynamic effects are of great importance for the development of novel noninvasive or least-invasive fat reduction technologies. Obesity is a disease characterized by weight gain due to adipose tissue and is defined by a value of body mass index (ratio of human mass to squared height). Designing and introduction of new approaches of harmless fat cell reduction will allow one to avoid serious complications in diabetic patients and to make esthetic-aimed procedures more safe and pleasant. It is necessary to maintain adipose cell controllable lipolysis or least invasively destruct them in situ. Adipose tissue is formed by the aggregation of fat cells (adipocytes), containing stored fat (lipids) in the form of single droplets of triglycerides. The nucleus, cytoplasm, and other organelles are at the periphery of the cell and the rest is occupied by lipid droplets. The narrow layer of fat cell cytoplasm contains a significant amount of organelles, which determine the metabolic activity of cells.5 At body temperature, the lipids in adipocytes are in a liquid state. At changing temperatures from 24°C to 45°C, lipid components of adipose tissue undergo several phase transitions.6 The temperature range from the physiology, 36°C and above, is important for the enhancement of fat cell lipolysis.7 There are many methods suited for the noninvasive or least-invasive removal of unwanted body fat. The most simple and effective techniques are based on hyperthermia8–12 and selective photothermolysis.13–15 Near-infrared (NIR) laser radiation has a selective thermal effect on fat tissue via absorption bands of lipids at 915, 1210, and 1720 nm.3,4,14 Recently, we have shown that photodynamic/photothermal effects induced in adipose tissue, stained with brilliant green (BG) or indocyanine green (ICG), at irradiation by diode light sources (LED lamp and NIR laser) can lead to lipolysis of fat cells and their gradual destruction following the scenario of apoptosis.12,16 The final products of cell lipolysis contributed to optical clearing of the upper cell layers of photodynamically/photothermally modified fat tissue samples. It was proved that due to light-induced cell membrane porosity, the intercellular content of the cell percolates through the arising temporal pores into the interstitial space.17 As a consequence, the refractive index of the interstitial fluid (initially equal to ) becomes closer to the refractive index of matter inside the adipocytes (refractive index of lipids, ), and due to the refractive index matching effect, the tissue sample becomes optically more homogeneous and more transparent to light.17–19 The aim of this work is to study the time variations in the morphology of adipose tissue in the course of photodynamic treatment using two different dyes in combination with visible and NIR radiation from laser and diode lamp sources. Selection of the wavelength, power density, and light exposure as well as the dye concentration was done on the basis of our early observations.12,20 In particular, the motivation for use of BG dye is due to its availability and wide use in medical practice. It is also important that it has an absorption spectrum which is well fit to the irradiation spectrum of commercially available medical LED irradiators (442 and 597 nm) used in dental practice. The ICG as a dye provides selective absorption in the NIR (around 800 nm) that gives the possibility to use NIR light from powerful diode lasers with radiation deeply penetrating into tissue.21 At the preliminary stage, a series of experiments on the choice of dye concentrations was carried out.22 The concentrations of dye solutions used in this article were chosen on the basis of our preliminary studies22 to be optimal to provide a noticeable cell damage at the minimal concentration in correspondence with used light power densities and exposures. The emission maxima of the diode lamp (442 and 597 nm) lie within the half-width of the BG absorption bands (440 and 650 nm), and the emission maximum of the diode laser (808 nm) lies within the half-width of the absorption band of ICG bound with tissue proteins (805 nm).22 As a measuring instrument, a commercially available 930-nm-spectral-radar THORLABS optical coherence tomography (OCT) system was used due to its rather high spatial resolution allowing for quantifying cell morphology within rather than thick tissue slices. The OCT imaging and monitoring of photodynamic therapy effects on tissues were described in many papers (see, e.g., Refs. 2324.–25), however, none of them provided studies on the cellular level. As far as we know, in this article, we demonstrate for the first time application of OCT technique to quantifying fat cell morphology within tissues at photodynamic action. 2.Materials and Methods2.1.Experimental SetupThe experiments were carried out using a portable OCT system (THORLABS, Newton, New Jersey, Thorlabs Lübeck AG and the Medical Laser Center Lübeck Spectral Radar OCT System) (Fig. 1). In this system, the light source is a low-coherence broadband superluminescent diode with the central wavelength and the spectral bandwidth of 100 nm. The coherence length that determines the axial resolution of the system is 6.5 μm and transverse resolution is 9 μm in the air, and the output power is 2 mW. Transverse resolution of the OCT system was examined by a special microscopic scale. The light from the source is guided into a handheld Michelson interferometer probe, which splits the light into two separate optical paths. In our experiments, the handheld probe was mounted in an adjustable holder. The reference arm path is terminated with a mirror, whereas the other path contains an imaging lens that focuses the light into the sample. This imaging lens is also used to collect the light that is backscattered or reflected from the sample. The light returning from both paths is recombined and directed into a spectrometer, which spatially separates the light to form the interference pattern that is then analyzed to yield the spectral OCT images. The whole OCT process was controlled by a personal computer. As a result of OCT imaging, one gets a two-dimensional array of the digitized OCT signal with rows corresponding to lateral scanning and columns to axial scanning.26 Fig. 1THORLABS Spectral Radar optical coherence tomography (OCT) with a Handheld Probe: schematic diagram of OCT imaging (left) and general view (right), where 1, PC; 2, THORLABS Spectral Radar OCT; 3, heated table, connected to the liquid thermostat TJ-TC-01 (Ref. 4). 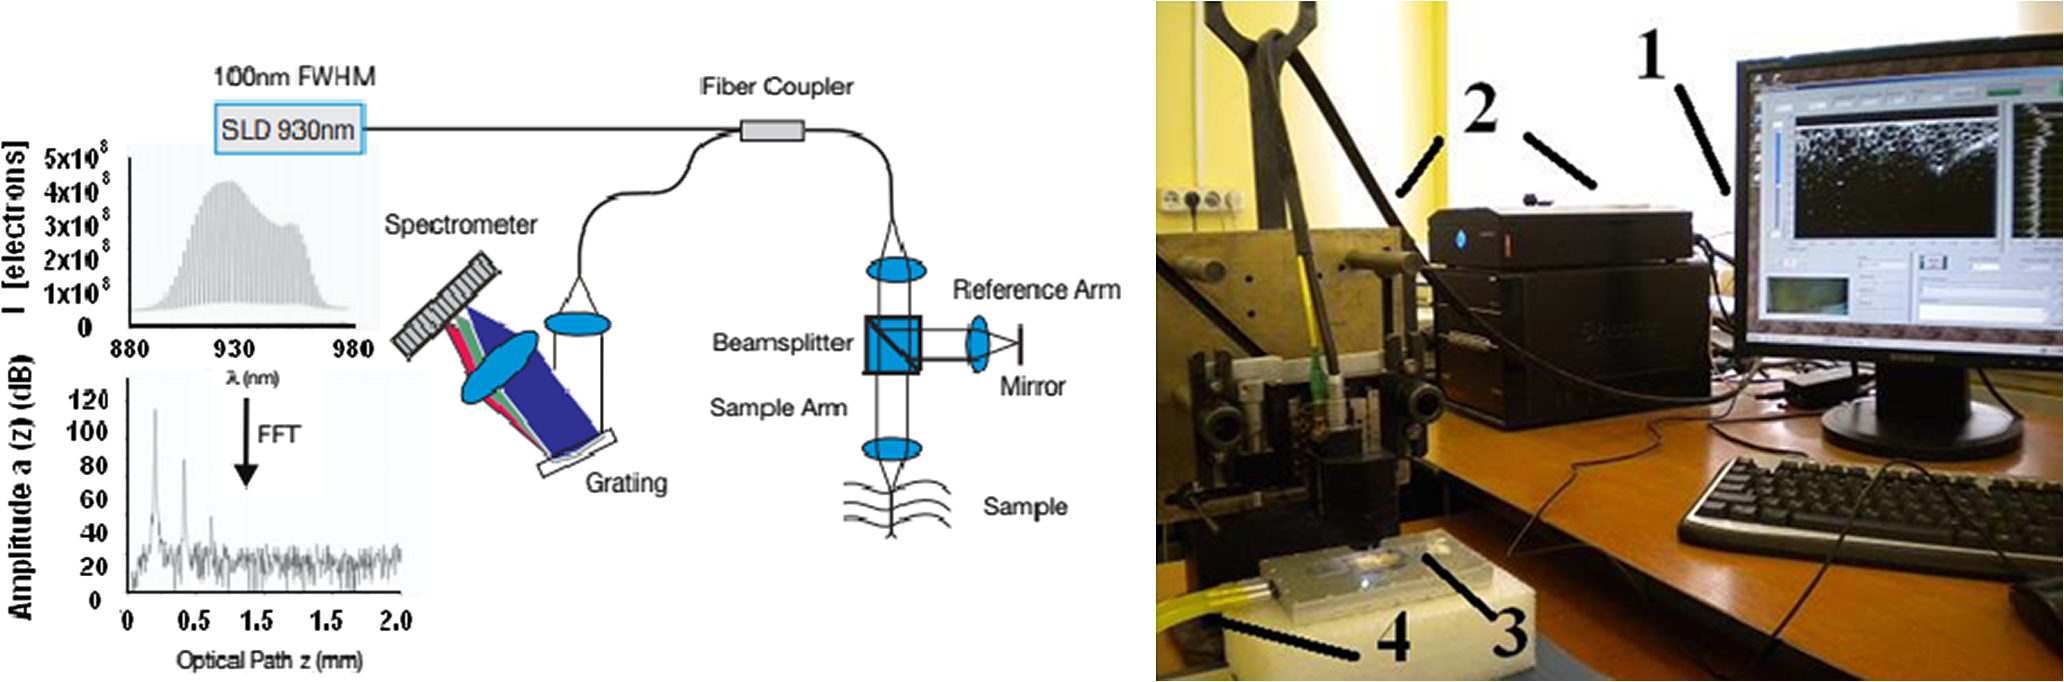 2.2.Tissue Samples Preparation, Dyes, and Light SourcesThe samples of adipose tissue were obtained as waste products of planned surgery in volunteers treated for diseases not related to fat cell condition. Before measurements, the fat tissue was stored in a refrigerator at the temperature of for 3 days. When frozen, the sample slices of fat tissue were cut and then slowly warmed up to room temperature. The thickness of a tissue slice thus prepared was measured using a mechanical micrometer and ranged from 200 to 600 μm. Then the slice was placed into the temperature-stabilizing system (heated specimen holder with glass windows, connected to the thermostat TJ-TC-01). The controllable range of the temperature was from to , with an accuracy of . After the moment when the selected temperature of a sample was reached, usually was about 15 min, the OCT imaging of the sample was started. The first OCT image was obtained with the intact sample. Then each slice having an area of was separated by spacers into four zones. The first zone was used as a control and this fat site has not been under any treatment (no stain and no radiation). The second zone was treated with dye. Water–ethanol solutions of ICG and BG with the concentration 1 and , respectively, were used for fat tissue staining. The third zone was irradiated by light. The continuous wave (CW) laser diode (VD-VII DPSS, 808 nm) and the dental diode lamp (Ultra Lume Led 5, 442 and 597 nm) were used for irradiation of tissue slices. The exposure time was 5 min with the laser and 15 min with the diode lamp. Zone 4 was stained with a dye first and then irradiated with a light source. The observations were conducted for four zones simultaneously, immediately after the irradiation and then repeatedly every 15 min during a sufficiently long observation time period (up to 300 min). The selected temperature was kept constant during the whole procedure. To carry out statistical processing of the result, the identical procedure was repeated with 10 different slices. For other temperature values or for staining with other dyes, new samples were taken and the whole procedure was repeated with 10 slices again for each combination of dye and temperature. 3.Experimental Results and DiscussionThe control tissue samples (zone 1), which were not stained and exposed to light, demonstrated good stability against environmental conditions without noticeable changes in structure during the characteristic time of any experiments. Figure 2 shows a series of OCT images of fat tissue slices, stained with BG, before (a) and after (b–d) the lamp irradiation during 15 min (temperature of the sample, 25°C). Figure 2(b) shows the fat tissue immediately after the irradiation, whereas Figs. 2(c) and 2(d) display the OCT images of the tissue slices after relatively long observation time intervals of 120 and 300 min, respectively. We used the diode lamp Ultra Lume Led 5 emitting at the wavelengths 442 and 597 nm, with power density . The efficiency of photochemical action was provided by the overlapping of light source emission spectrum and the absorption spectrum of the photosensitizer, BG. The concentration of BG dissolved in the ethanol–water () solution was . The initial thickness of the adipose tissue samples was measured using a micrometer. The measurement was repeated several times with subsequent averaging of the results. In this case, this thickness was found to be . Fig. 2OCT images of fat tissue slices, stained by blue green (BG), before irradiation (a); immediately after irradiation during 15 min (b); after 120-min observation (c); after 300-min observation (d). The light source was dental diode lamp (Ultra Lume Led 5, 442 and 597 nm, ). The concentration of BG in ethanol–water (2:3) solution was . Temperature of sample, 25°C. The upper histograms are cell area distributions, calculated for OCT images (algorithm is presented in Fig. 6), and down curves are A-scan averaged for whole B-scan area.  Figure 3 shows a series of OCT images of fat tissue slices, stained with BG (), before (a) and after (b–d) the Ultra Lume Led 5 lamp irradiation () during 15 min (temperature of the sample, 37°C). Figure 3(b) shows the fat tissue OCT image immediately after the irradiation, whereas Fig. 3(c) and 3(d) display the OCT images of the tissue after relatively long observation time intervals of 60 and 120 min, respectively. The initial thickness of the adipose tissue sample was . Fig. 3OCT images of fat tissue slices, stained by BG, before irradiation (a); immediately after irradiation during 15 min (b); after 60-min observation (c); after 120-min observation (d). The light source was dental diode lamp (Ultra Lume Led 5, 442 and 597 nm, ). The concentration of BG in ethanol–water (2:3) solution was . Temperature of sample, 37°C. The upper histograms are cell area distributions, calculated for OCT images (algorithm is presented in Fig. 6), and down curves are A-scan averaged for whole B-scan area.  The same features were observed in experiments with ICG-stained fat tissue and NIR diode laser as a light source (temperature of the sample, 25°C) (see Fig. 4). The irradiation time was shorter (5 min) for the laser source and the observation times were the same 120 and 300 min, as in Fig. 2. We used the CW laser diode VD-VII DPSS having a wavelength 808 nm and power density of . The concentration of ICG was and the initial thickness of the adipose tissue sample was . Fig. 4OCT images of fat tissue stained by ICG before irradiation (a); immediately after laser irradiation during 5 min (b); after 120-min observation (c); after 300-min observation (d). The light source was continuous wave (CW) laser diode (VD-VII DPSS, 808 nm, ). The concentration of indocyanine green (ICG) was . Temperature of the sample, 25°C. The upper histograms are cell area distributions, calculated for OCT images (algorithm is presented in Fig. 6), and down curves are A-scan averaged for selected area of B-scan area (between two thin vertical lines). 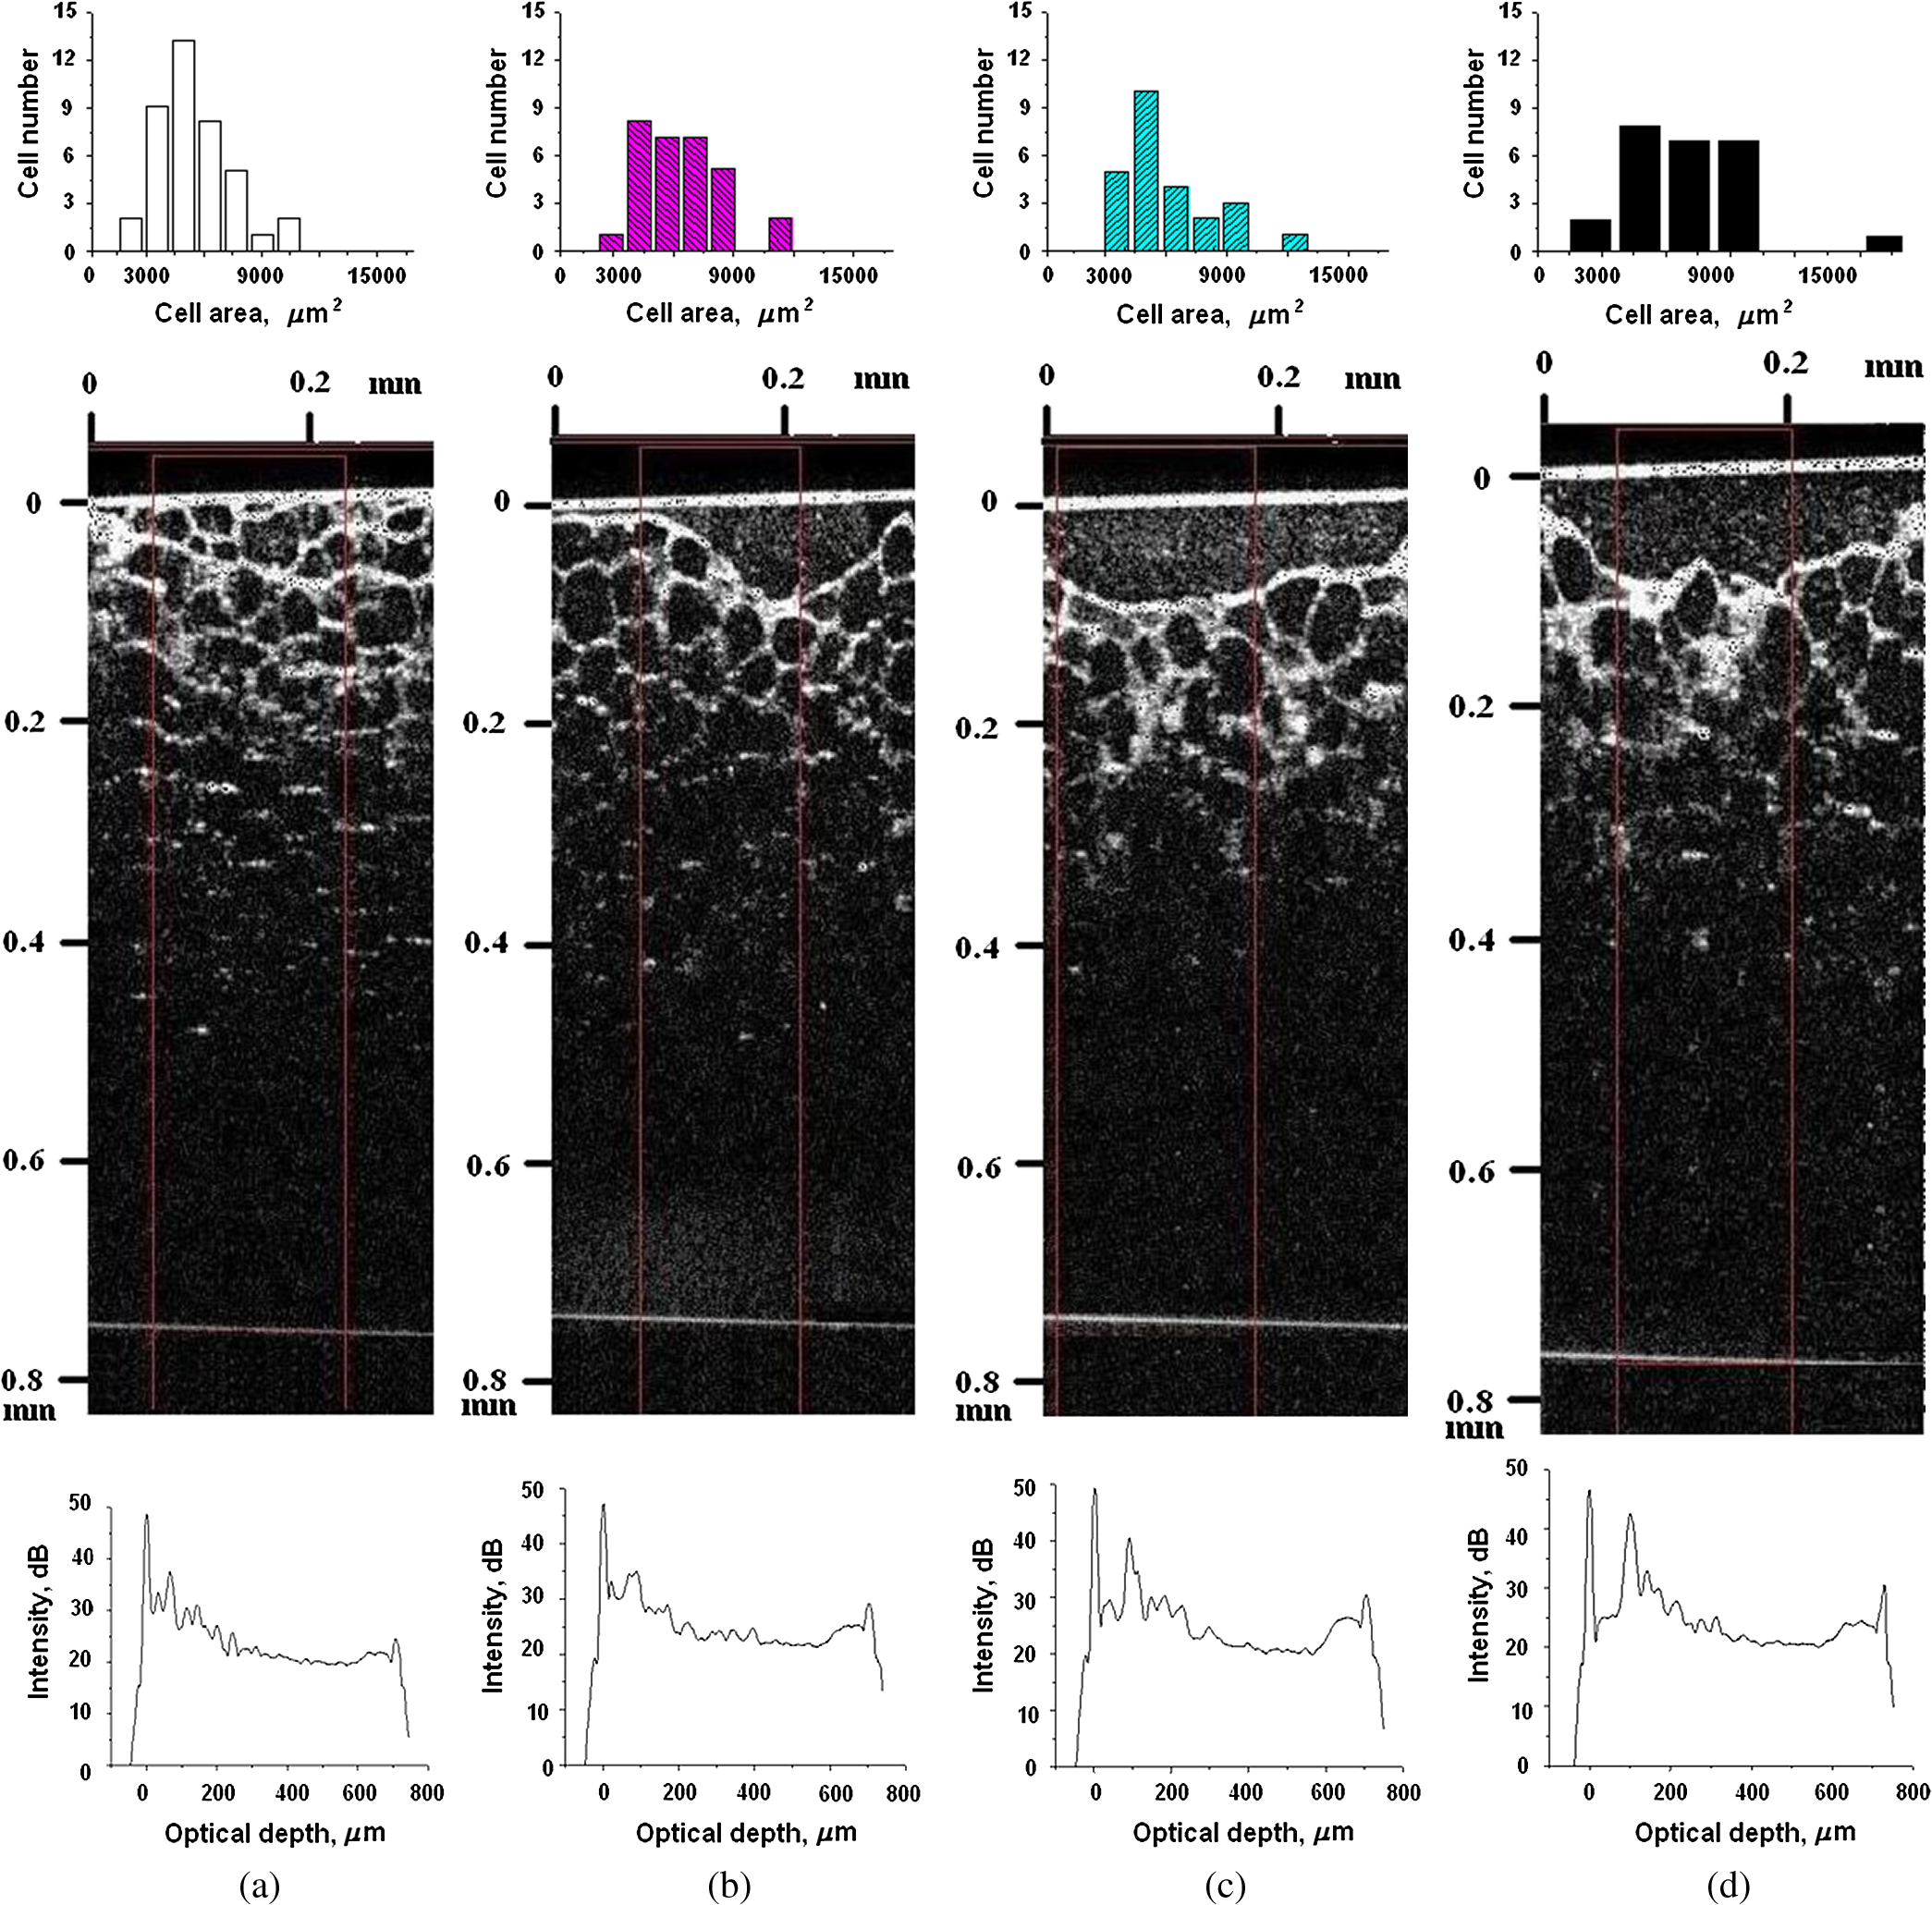 Figure 5 displays the results obtained with ICG as a staining agent and NIR diode laser () as a light source (temperature of the sample, 37°C). The irradiation time was 5 min for the laser source and the observation times were 60 and 120 min. The concentration of ICG was and the initial thickness of the tissue sample was . Fig. 5OCT images of fat tissue slices, stained by ICG, before irradiation (a); immediately after laser irradiation during 5 min (b); after 60-min observation (c); after 120-min observation (d). The light source was CW laser diode (VD-VII DPSS, 808 nm, ). The concentration of ICG was . Temperature of the sample, 37°C. The upper histograms are cell area distributions, calculated for OCT images (algorithm is presented in Fig. 6), and down curves are -scan averaged for selected area of -scan area (between two thin vertical lines).  Since the OCT image resolves individual cells well enough, it is possible to study the effect of light exposure on the size distribution of the cells. The image processing steps operate on the obtained OCT images to calculate the area and to count the number of distinguishable cells. Before the analysis can be applied, the image must be preprocessed by converting the gray scale image of 256 grades to an image with only two grades, zero and unit. The area of a cell having round or close to round form can be found by counting the pixels with the unity grade. Zero-graded pixels present image background.16 Calculated cell areas were transferred from to . The algorithm for cell area calculating includes the following steps [Fig. 6(a)–6(g)]16: (1) opening the folder with the images of the specified format, reading files, and creating an array of paths to images; (2) improving image quality by using special filters built into the LabVeiw (enhancement of the cell edge contrast by conversion to negative image); (3) thresholding procedure providing image segmentation into cell and background regions by setting 1 to all pixels that belong to a gray-level interval and 0 to all other pixels in the image (background); (4) smoothing procedure (filling up the holes in each cell image); (5) eliminating cells that touch the border of an image and cells with irregular form which could not be approximated by circular or elliptic form; (6) cell approximating as circular or elliptically shaped objects; and (7) counting the number and area of each cell in squared microns. Fig. 6Algorithm for calculating cell area: (a) initial OCT image of the adipose tissue slice; (b) enhancement of the cell edge contrast by conversion to negative image; (c) thresholding procedure; (d) image smoothing; (e) removing cells crossing the image border and with irregular form; (f) approximating cells by circular- or elliptical-shaped objects; (g) calculating of cell number and areas. 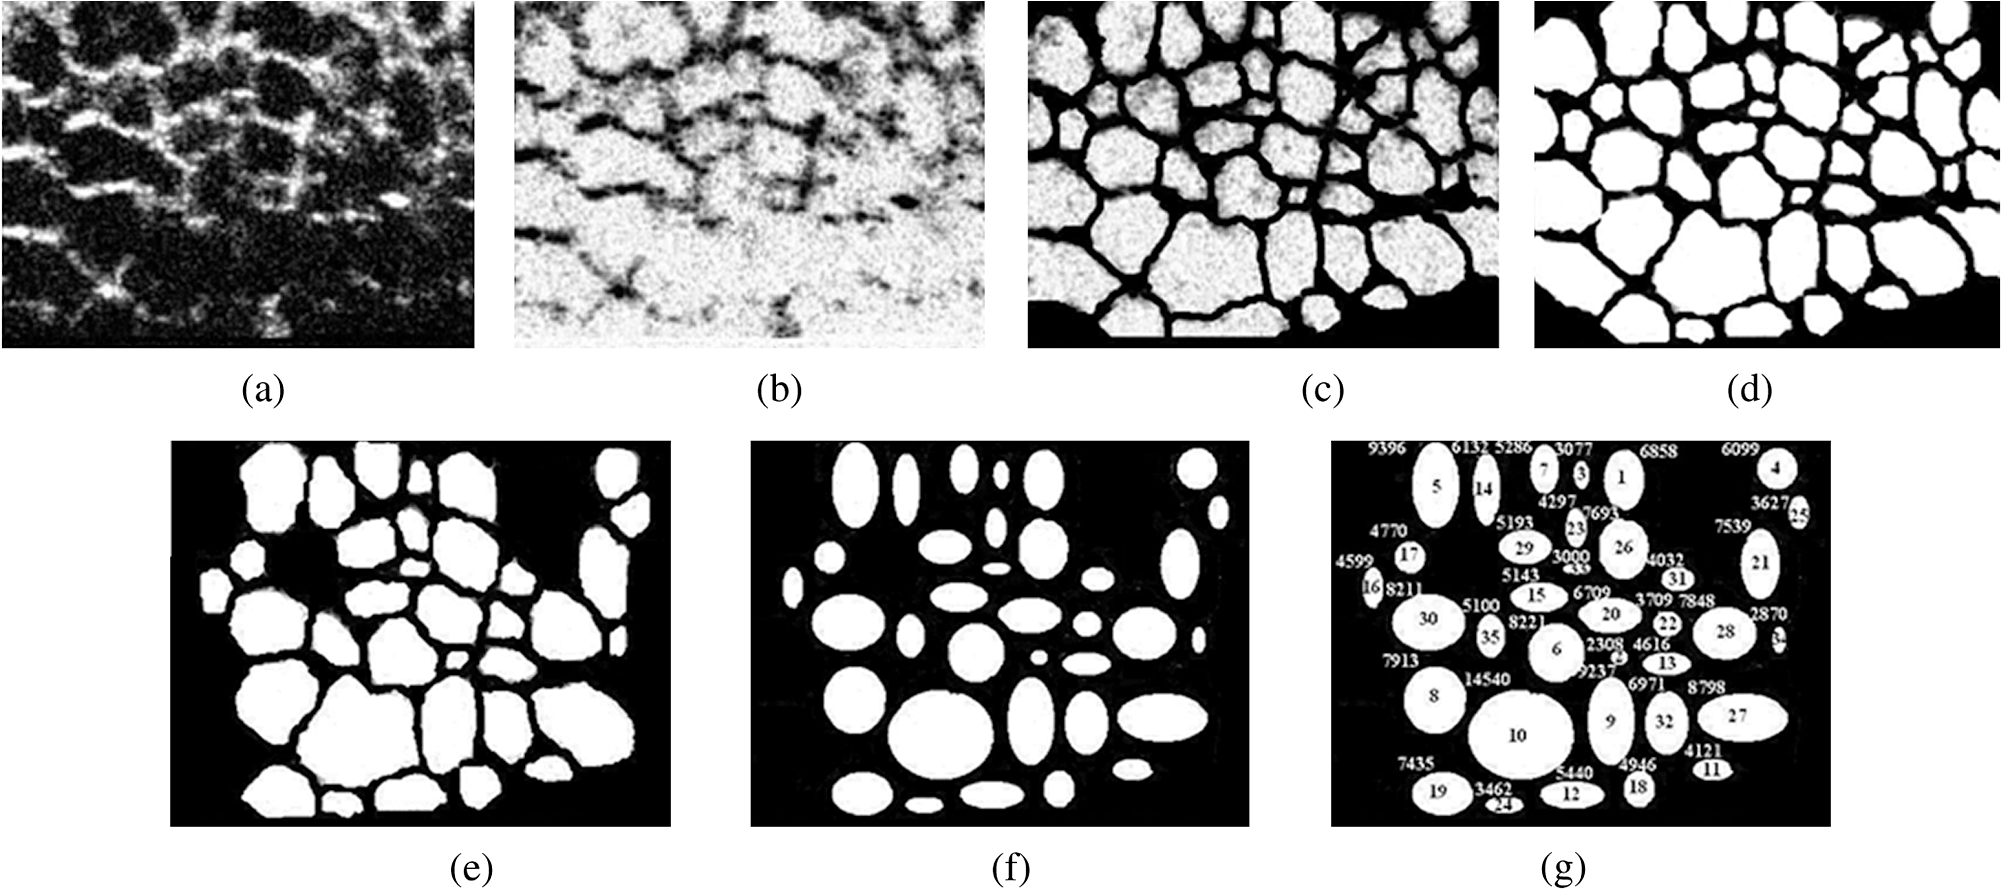 Figure 7(a) and 7(b) and 8(a) and 8(b) show results of statistical analysis for cell areas observed in Figs. 2Fig. 3Fig. 4–5. Origin standard software was used to calculate these histograms with width of bars showing the standard deviation of cell area. The histograms show that over time, the distribution becomes more uniform because of the increased number of cells with smaller areas (due to lipolysis) and larger areas (most likely due to their merge). Fig. 7Histograms for fat cell area (area, not reduced to geometrical) distributions, presented in OCT images shown in Figs. 2(a)–2(d) and 3(a)–3(d).  Fig. 8Histograms for fat cell area (area, not reduced to geometrical) distributions, presented in OCT images shown in Figs. 4(a)–4(d) and 5(a)–5(d). 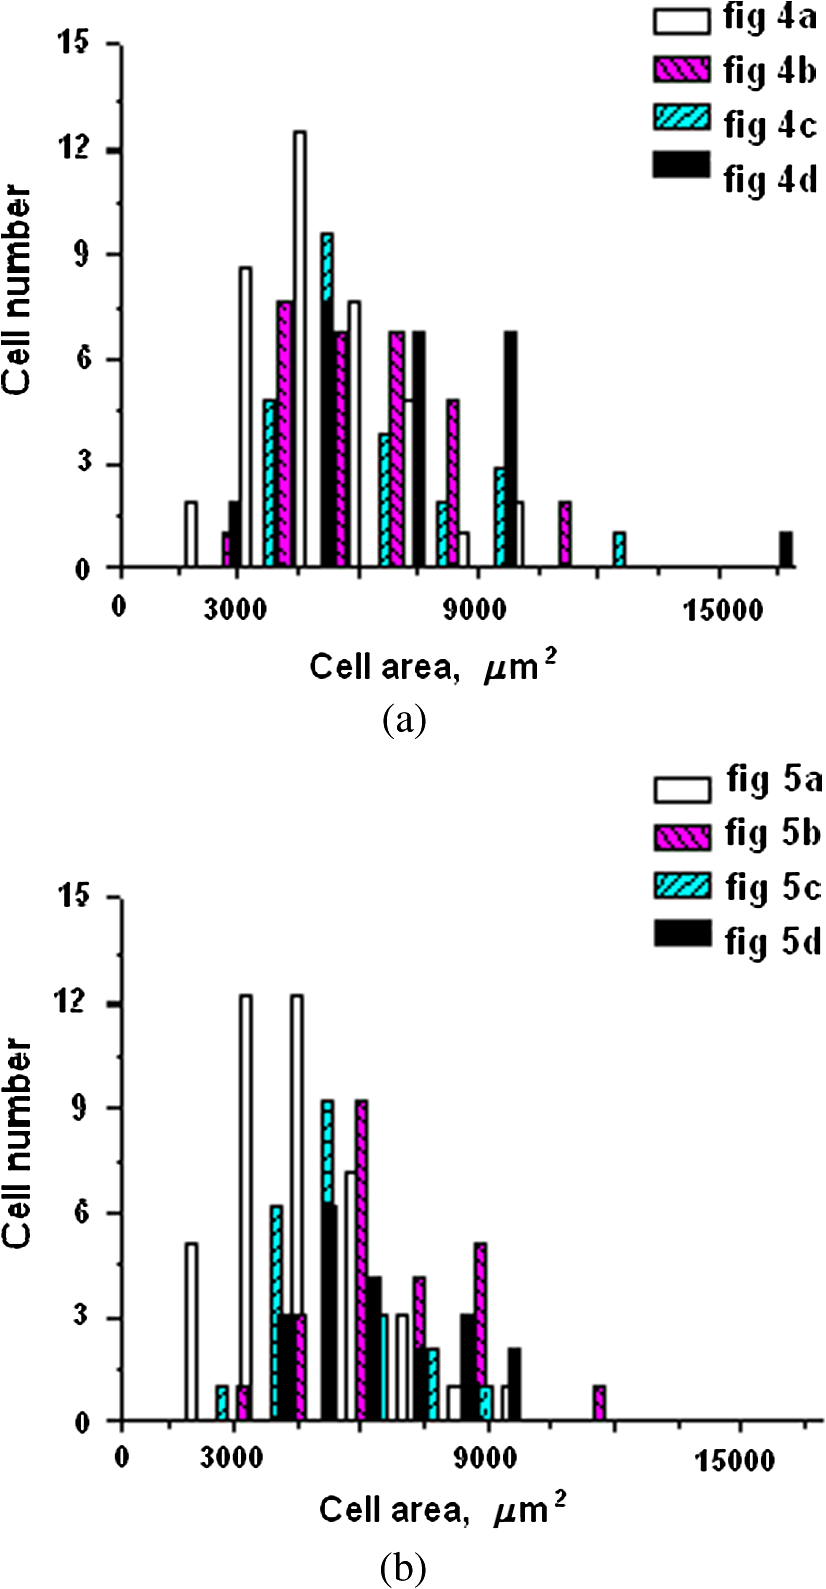 The OCT images presented in Figs. 2Fig. 3Fig. 4–5 clearly show changes of fat tissue cell morphology with time after photodynamic treatment using two different photosensitizers and irradiation conditions at two temperatures 25°C and 37°C. This characteristic time is of 60 and 300 min, depending on staining and irradiation conditions, is generally fit to expected biological response to photodynamic therapy (PDT) treatment.27 The major changes after irradiation are seen for the upper layer of the cell structure. The depth of cell damage for BG-mediated diode lamp treatment at room temperature (25°C) was 20 and 60 μm [Fig. 2(b)–2(d)], and at physiological temperature (37°C), it was 80 to 90 μm [Fig. 3(b)–3(d)]. ICG-mediated 808-nm laser diode treatment was stronger at room temperature (25°C) and the cell damage depth was approximately similar to 30 to 70 μm [Fig. 4(b)–4(d)], but at physiological temperature (37°C), it was up to 230 μm [Fig. 5(b)–5(d)]. The average size of adipocytes was 60 to 70 μm (vertical size in optical length units). The size distributions of cells in the course of treatment were calculated (see Figs. 2Fig. 3Fig. 4–5 for individual distributions and Figs. 7 and 8, where all distributions were summarized separately for two types of used photosensitizers). The technology for calculation of cell size distribution is shown in Fig. 6. In spite of the relatively small number of cells used for calculations (30 to 35 cells), all cell size distributions demonstrate a pretty good general behavior of cell structure morphology changes under PDT treatment, i.e., more uniform distribution with an approximately equal number of smaller, bigger, and mean sized cells, which is not dramatically changed at treatment. Such deformation of size distribution function can be explained as transformation of some amount of the normal cells to smaller size due to cell lipolysis and to bigger size due to cell swelling and fusion. Figure 9 showing results of statistical analysis for 10 specimens at control zone (zone 1) and at zone 4 (ICG/diode laser action) illustrates this statement well. Fig. 9Results of statistical analysis for 10 specimens at control zone (zone 1, dark squares) and at zone 4 (red circles) [stained by ICG () and irradiated by CW laser diode (VD-VII DPSS, 808 nm, )] at 37°C. Evolution with time of fat cell area (not reduced to geometrical) distributions is shown.  Therefore, we understand the observed changes in the OCT image as resulting from lipolysis and destruction of cells due to the photodynamic effect. The final products of cell lipolysis are glycerol and water,28 thus they cause the optical clearing due to matching of the refractive indices of cells and intercellular medium. Cell destruction (less thickness of tissue layer) is also helpful in better light penetration inside tissue for further interaction with other cells. Optical clearing is seen as an increase of reflectance from the down tissue–glass interface (Figs. 2Fig. 3Fig. 4–5).29,30 It was also shown that keeping samples at physiological temperature leads to deeper and faster alterations of tissue morphology at PDT treatment. 4.ConclusionThe photodynamic and thermal effects in adipose tissue were investigated. In this study, we have provided prolonged (a few hours) observations of fat tissue sample morphology alterations at precisely fixed room (25°C) or physiological temperature (37°C) followed up after PDT treatment. Such experimental technology allowed for PDT-induced controlled cell lipolysis and targeted changes in the morphology (cell destruction and size distribution) of adipose tissue in conditions close to physiological. Local temperature increases above 37°C, up to , can provide a reduction of adipose tissue at greater depths and in lesser time.8,12 In practice, this heating, which is additional to PDT treatment, can be done by the same laser and photosensitizer that is used for PDT. Indeed, laser (LED) energetic properties and dye concentration should be optimized. Note, that commercially available moderate spatial resolution OCT is suitable to quantify fat cell morphology alterations at photodynamic or photothermal treatment and provides valuable information about the mechanisms of therapy at the cellular level. Because of relatively large size of adipose tissue cells, OCT technique allows for direct control of lipolytic activity and cell destruction ability caused by optical and any other treatment modalities, including chemicals28 and ultrasound.31 Experimental data received in this study support the hypothesis that PDT treatment induces fat cell lipolysis from minutes to hours in time scale after treatment, which is well fit to general biological response to PDT treatment.27 AcknowledgmentsThis study was supported in part by grants 224014 PHOTONICS4LIFE of FP7-ICT-2007-2, 1.4.09 of RF Ministry of Education and Science; RF Governmental contracts 14.B37.21.0728, 14.B37.11.0563, and 14.512.11.0022; FiDiPro, TEKES Program (40111/11), Finland; SCOPES EC, Uzb/Switz/RF, Swiss NSF, IZ74ZO_137423/1; RF President’s grant “Scientific Schools”, 1177.2012.2; RFBR grants 11-02-00560-а and 13-02-91176-NSFC_a. ReferencesApplied Laser Medicine, Springer-Verlag, Berlin
(2003). Google Scholar
Cosmetic Applications of Laser & Light-Based Systems, William Andrew Inc., Norwich, NY
(2009). Google Scholar
M. Wanneret al.,
“Effects of non invasive, 1,210 nm laser exposure on adipose tissue: results of a human pilot study,”
Laser Surg. Med., 41
(6), 401
–407
(2009). http://dx.doi.org/10.1002/lsm.v41:6 LSMEDI 0196-8092 Google Scholar
M. J. Salzman,
“Laser lipolysis using a 1064/1319-nm blended wavelength laser and internal temperature monitoring,”
Semin. Cutaneous Med. Surg., 28
(4), 220
–225
(2009). http://dx.doi.org/10.1016/j.sder.2009.11.002 Google Scholar
M. I. Gurret al.,
“Adipose tissue cellularity in man: the relationship between fat cell size and number, the mass and distribution of body fat and the history of weight gain and loss,”
Int. J. Obes., 6
(6), 419
–436
(1982). IJOBDP 0307-0565 Google Scholar
Crystallization and Polymorphism of Fats and Fatty Acids, 97
–137 Marcel Dekker Inc., New York
(1988). Google Scholar
A.V. BelikovC.V. PrikhodkoO.A. Smolyanskaya,
“Study of thermo induced changes resulted in optical properties of fat tissue,”
Proc. SPIE, 5066 207
–212
(2003). http://dx.doi.org/10.1117/12.501656 PSISDG 0277-786X Google Scholar
O. A. Cherkasovaet al.,
“Influence of carbohydrate specificity of bacterial lectin Azospirillum on structural changes of adipocytes at hyperthermia,”
Biophysics, 52
(4), 687
–693
(2007). http://dx.doi.org/10.1117/12.2017672 BIOPAE 0006-3509 Google Scholar
N. Ju. IgnatevaI. E. GrohovskayaV. V. Lunin,
“The laser-induced structural and chemical changes of a fatty tissue,”
J. Phys. Chem., 76
(8), 1357
–1364
(2002). JPCHAX 0022-3654 Google Scholar
E. Solarteet al.,
“In vitro effects of 635 nm low intensity diode laser irradiation on the fat distribution of one adipose cell,”
Proc. SPIE, 4829 994
–996
(2003). http://dx.doi.org/10.1117/12.527513 PSISDG 0277-786X Google Scholar
V.V. TuchinI. Yu. YaninaG. V. Simonenko,
“Destructive fat tissue engineering using photodynamic and selective photothermal effects,”
Proc. SPIE, 7179 71790C
(2009). http://dx.doi.org/10.1117/12.812164 PSISDG 0277-786X Google Scholar
G.B. Altshuleret al.,
“Extended theory of selective photothermolysis,”
Laser Surg. Med., 29
(5), 416
–432
(2001). http://dx.doi.org/10.1002/(ISSN)1096-9101 LSMEDI 0196-8092 Google Scholar
R.R. Andersonet al.,
“Selective photothermolysis of lipid rich tissues: a free electron laser study,”
Laser Surg. Med., 38
(10), 913
–919
(2006). http://dx.doi.org/10.1002/(ISSN)1096-9101 LSMEDI 0196-8092 Google Scholar
I. Yu. Yaninaet al.,
“Fat tissue histological study at ICG-mediated photothermal/photodynamic treatment of the skin in vivo,”
J. Biomed. Opt., 17
(5), 058002
(2012). http://dx.doi.org/10.1117/1.JBO.17.5.058002 JBOPFO 1083-3668 Google Scholar
I. Yu. Yaninaet al.,
“The morphology of apoptosis and necrosis of fat cells after photodynamic treatment at a constant temperature in vitro,”
Proc. SPIE, 7887 78870X
(2011). http://dx.doi.org/10.1117/12.878754 PSISDG 0277-786X Google Scholar
V.A. DoubrovskyI. Yu. YaninaV.V. Tuchin,
“Inhomogeneity of photo-induced fat cell lipolysis,”
Proc. SPIE, 7999 799921
(2011). http://dx.doi.org/10.1117/12.889326 PSISDG 0277-786X Google Scholar
V.A. Doubrovskyet al.,
“Photoaction on cells of human adipose tissue in vitro,”
Cytology, 53
(5), 423
–432
(2011). CYGEDX 0095-4527 Google Scholar
V.A. DoubrovskyI. Yu. YaninaV.V. Tuchin,
“The kinetics of optical properties of adipose cells in vitro as a result of photodynamic action,”
Biophysics, 57
(1), 125
–136
(2012). BIOPAE 0006-3509 Google Scholar
V.V. Tuchinet al.,
“Fat tissue staining and photodynamic/photothermal effects,”
Proc. SPIE, 7563 75630V
(2010). http://dx.doi.org/10.1117/12.849346 PSISDG 0277-786X Google Scholar
J. T. Alanderet al.,
“A review of indocyanine green fluorescent imaging in surgery,”
Int. J. Biomed. Imaging, 2012 1
–26
(2012). http://dx.doi.org/10.1155/2012/940585 Google Scholar
I. Yu. Yaninaet al.,
“Absorption spectra of photosensitized human adipose tissue,”
Opt. Spectrosc., 108
(7), 34
–46
(2010). http://dx.doi.org/10.1134/S0030400X10080114 OPSUA3 0030-400X Google Scholar
M.C.G. Aalderset al.,
“Doppler optical coherence tomography to monitor the effect of photodynamic therapy on tissue morphology and perfusion,”
J. Biomed. Opt., 11
(4), 044011
(2006). http://dx.doi.org/10.1117/1.2337302 JBOPFO 1083-3668 Google Scholar
M. Khuranaet al.,
“Intravital high-resolution optical imaging of individual vessel response to photodynamic treatment,”
J. Biomed. Opt., 13
(4), 040502
(2008). http://dx.doi.org/10.1117/1.2965545 JBOPFO 1083-3668 Google Scholar
B.A. Standishet al.,
“Interstitial Doppler optical coherence tomography monitors microvascular changes during photodynamic therapy in a Dunning prostate model under varying treatment conditions,”
J. Biomed. Opt., 12
(3), 034022
(2007). http://dx.doi.org/10.1117/1.2744068 JBOPFO 1083-3668 Google Scholar
, Your Source for Fiber Optics, Laser Diodes, Optical Instrumentation and Polarization Measurement & Control,
(2013) http://www.thorlabs.com/catalogpages/595.pdf April ). 2013). Google Scholar
B.C. Wilson,
“Photodynamic therapy/diagnostics: Principles, practice and advances,”
Handbook of Photonics for Medical Science, 649
–686 CRC Press, Taylor & Francis Group, London
(2010). Google Scholar
T. Yamaguchiet al.,
“CGI-58 facilitates lipolysis on lipid droplets but is not involved in the vesiculation of lipid droplets caused by hormonal stimulation,”
J. Lipid Res., 48
(5), 1078
–1089
(2007). http://dx.doi.org/10.1194/jlr.M600493-JLR200 JLPRAW 0022-2275 Google Scholar
V.V. TuchinX. XuR.K. Wang,
“Dynamic optical coherence tomography in optical clearing, sedimentation and aggregation study of immersed blood,”
Appl. Opt., 41
(1), 258
–271
(2002). http://dx.doi.org/10.1364/AO.41.000258 APOPAI 0003-6935 Google Scholar
N. Sudheendranet al.,
“Assessment of tissue optical clearing as a function of glucose concentration using optical coherence tomography,”
J. Innov. Opt. Health Sci., 3
(3), 169
–176
(2010). http://dx.doi.org/10.1142/S1793545810001039 Google Scholar
K.M. ColemanW. P. Coleman IIIA. Benchetrit,
“Non-invasive, external ultrasonic lipolysis,”
Semin. Cutaneous Med. Surg., 28
(4), 263
–267
(2009). http://dx.doi.org/10.1016/j.sder.2009.10.004 Google Scholar
|


