|
|
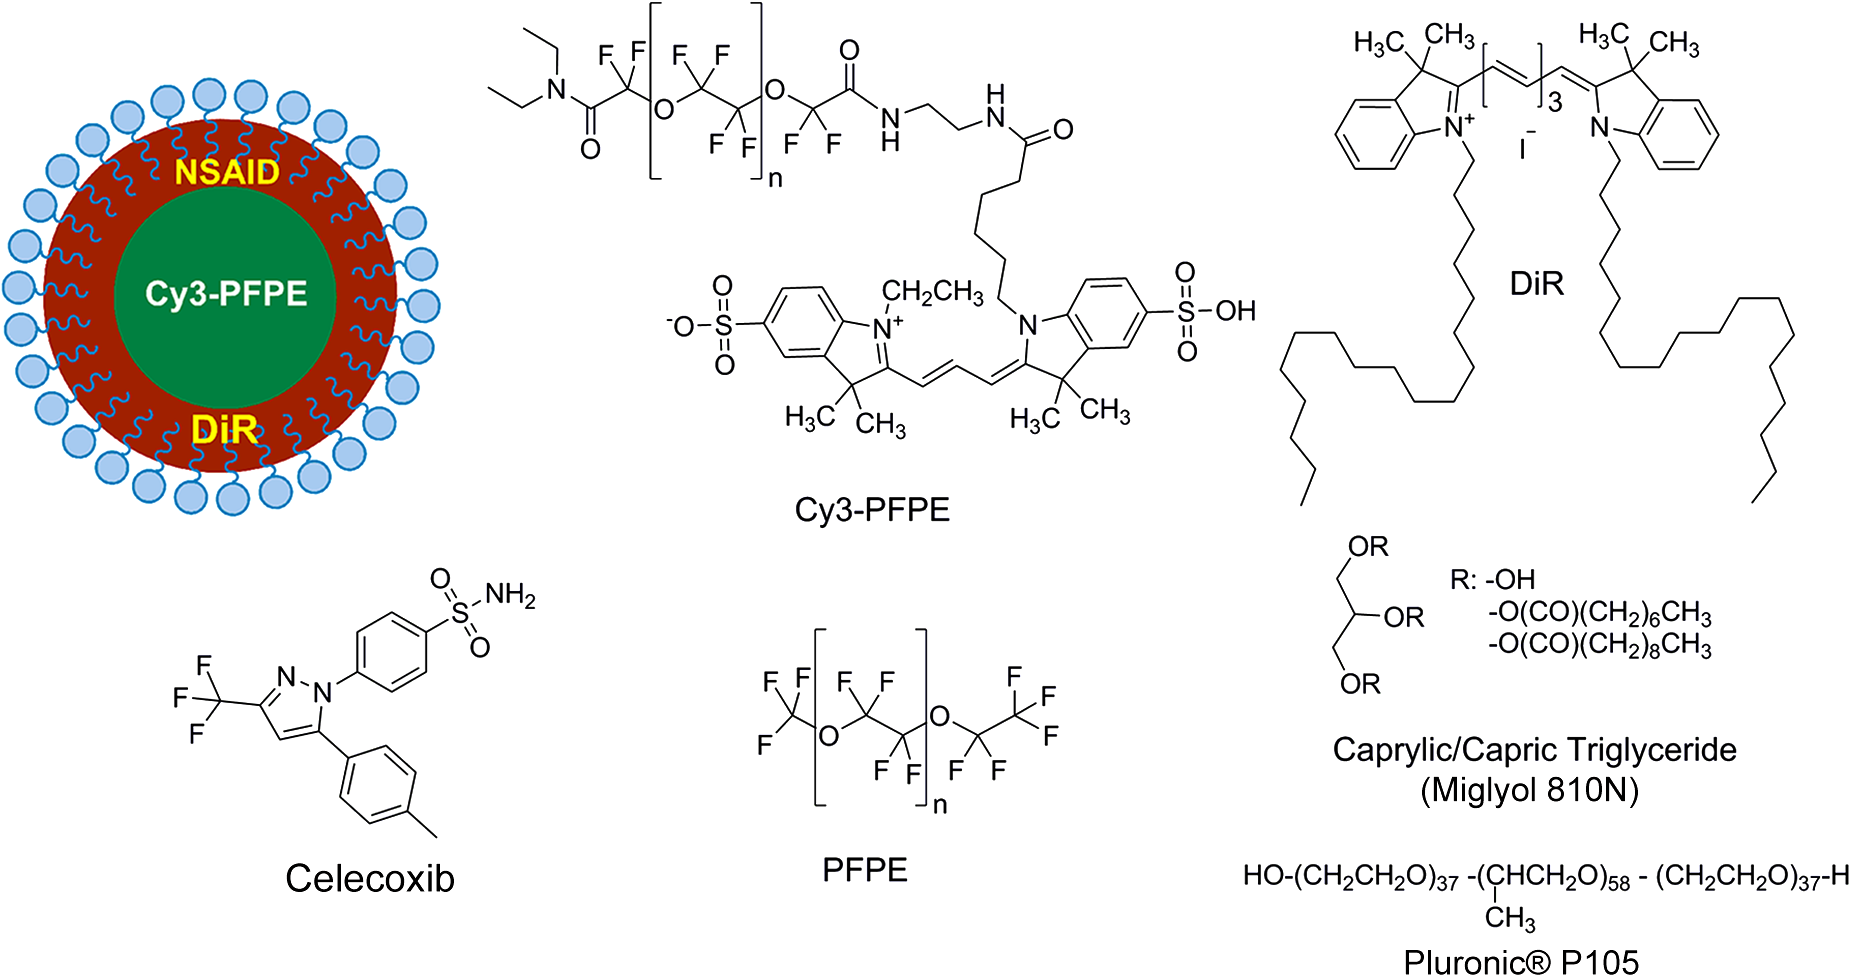
1.IntroductionPerfluorocarbons (PFCs) have emerged in recent years as powerful tools for highly specific and quantitative magnetic resonance imaging (MRI) of inflammatory cells’ responses to stress and changes in the body.1–5 Combination of PFCs with optical imaging provides exceptional advantage over using MRI alone. Near-infrared (NIR) fluorescence imaging overcomes potential issues in biodistribution studies that use detection alone in vivo, such as lack of access to a high field magnet, sensitivity, and cost. Several recent studies report PFC nanoemulsions labeled with NIR dyes and their use for combined MRI and NIR in vivo imaging.6,7 However, detailed in vitro studies of incorporated NIR dyes within the PFC nanoemulsions are lacking. This paper aims to address the need for a better understanding of how combining two (or three) imaging entities into a single nanosystem affects the in vitro performance of each modality. We also present discussion on why in vitro assessments are necessary to assure future optimal in vivo performance of the fluorescently labeled PFC nanoemulsions. Further, we aim to address a common problem associated with standard epifluorescent microscopy methods for cell and tissue imaging which use excitation lasers and filters that do not support NIR dye detection very well. In our earlier studies, we have found that in a cellular imaging experiment, full excitation of the NIR dye by standard 633 nm laser is difficult to achieve, which leads to low fluorescent signal from labeled cells and histological samples.6,8 In these studies, we resorted to using either lower wavelength dye or introducing an additional lipophilic tracer to the system. This approach is not without problems. Two dyes in the same environment have a higher chance for chemical and optical interaction. To avoid these issues, we opted for dual fluorescent labeling of the nanoemulsion by two distinct and mutually compatible fluorescent reporters introduced into distinct oil phases of the triphasic nanoemulsion. This new design approach promises to better support combination of NIR fluorescence imaging and MRI. In vivo NIR fluorescence gained popularity in recent years because it is safe, fast, and relatively easy to use. Optical imaging offers high sensitivity and low detection limits. In subcutaneous tumor models, NIR imaging has sufficient tissue penetration for imaging in most preclinical models9 and can complement MRI. Specifically, NIR fluorescence imaging offers low absorbance and scattering effects in living tissues. NIR imaging of cells and drug carrier biodistribution have also been assessed both in vitro and in vivo.6 MRI, on the other hand, is a noninvasive diagnostic tool with unlimited tissue penetration depth and exceptional selectivity. MR signal can be used to quantify externally administered organic in the body, while conventional MRI provides the anatomical context.4,5 Recently, we reported the combined use of MRI and NIR for in vivo imaging of tumor inflammation in a breast tumor model.6 PFCs are nontoxic organo-fluorine compounds that have been widely investigated as artificial blood substitutes and ultrasound contrast agents. In addition to being used as imaging agents, PFC nanoemulsions currently are being extensively studied as a versatile platform for theranostic nanomedicine development.8,10–12 Formulation of PFCs into biocompatible and stable nanoemulsions for in vivo applications is challenging. Pure PFCs are both lipophobic and hydrophobic, and do not incorporate into cell membranes on their own. Successful design and formulation of highly stable perfluoropolyether (PFPE) nanoemulsions have been recently reported by Janjic et al.13 and tested in a variety of animal models.14–16 These nanoemulsions use low amounts of surfactants and can be stabilized by steric effects. Due to their small droplet size, PFPE nanoemulsions are translucent and typically resistant to creaming and sedimentation. Nanoemulsion preparations using a microfluidization approach are highly reproducible and scalable, which is critical for future clinical application of PFC nanotheranostics.13 Patel et al.8 recently reported cyclooxygenase-2 (COX-2) inhibitor (celecoxib)-loaded PFC nanoemulsion, where PFC serves three distinct purposes: (1) as an inert drug carrier, (2) as an MRI tracer for in vivo monitoring of the drug delivery system biodistribution, and (3) as a MR imaging agent to monitor inflammation response to treatment due to nanoemulsion uptake by monocytes and macrophages. Now, we are focusing on extending this methodology to the monitoring and modulating of tumor-infiltrating immune cells in vivo. Building toward this goal, we also reported two distinct MR imaging-capable nonsteroidal anti-inflammatory drug-loaded nanoemulsions.8,17 Patel et al.8 demonstrated for the first time that a celecoxib-loaded PFPE nanoemulsion can dramatically suppress prostaglandin production in cultured macrophages. Following these results, we designed an improved drug loaded PFPE nanoemulsion that carries two distinct fluorescent reporters: a NIR fluorescent dye in the hydrocarbon (HC) layer and a highly stable visible fluorescent dye in the PFC core of the nanoparticle. Here, we report a two-color fluorescent PFC nanoemulsion formulated as a triphasic (PFC/HC/water) colloidal system, where each oil phase is distinctly labeled. To our knowledge, this is the first time such a formulation has been produced and tested in vitro. The key feature is the introduction of distinct fluorescent reporters to both the PFC phase (at the core of the nanodroplet) and the HC oil phase (drug-carrying layer) in a triphasic nanoemulsion system, Fig. 1. This new design offers several advantages. First, each oil phase can be visualized independently before and during processing in varied media. Second, distinct fluorescence dyes can be used to assess nanoemulsion integrity in cells and tissues. Third, the lower wavelength fluorescent reporter bound to the internal PFC phase in the nanoemulsion supports future histological studies as it is more likely to remain associated with PFC over time in vivo.13 Furthermore, the second reporter can also help monitor NIR dye long-term stability in biological samples. Finally, the study presented here explains in detail how a complex multimodal nanoemulsion needs to be evaluated in vitro to fully understand and assess its future in vivo applications. Our goal has been to present detailed experimental approaches that can be further applied to other multicolor fluorescent nanosystems and provide a model study for their in vitro assessment before their use for either imaging or drug delivery. 2.Materials and Methods2.1.MaterialsCelecoxib was purchased from LC Laboratories® (Woburn, MA, USA). Miglyol 810N was generously donated by Croda® International Plc. Pluronic® P105 and Cremophor® EL was purchased from Sigma–Aldrich. Perfluoropoly(ethylene glycol) ether (produced by Exfluor Research Corp., Roundrock, TX, USA) was generously provided by Celsense Inc., Pittsburgh, PA, USA. Cy3–PFPE conjugate was synthesized at Carnegie Mellon University per Patrick et al.18 and Janjic et al.13 synthetic methods and used without further purification. Briefly, Cy3 dye was conjugated to and after deprotection conjugated to PFPE ester to form fluorescent blended PFPE amides (FBPAs) oil.13,19 The Cy3–PFPE oil was combined with PFPE oxide as reported earlier13,19 and used in further emulsification as a fluorescent PFPE oil phase. DiR lipophilic tracer was purchased from Invitrogen and used without further purification. CellTiter-Glo® Luminescent Cell Viability Assay was obtained from Promega Corporation, WI, USA. MDA-MB-231 breast cancer cell line and mouse macrophage cell line (RAW 264.7) were obtained from American Type Culture Collection, Rockville, MD, USA and cultured according to the instructions. Dulbecco’s modified eagle medium (DMEM; GIBCO-BRL, Rockville, MD, USA) for macrophage culture experiments was supplemented with 10% fetal bovine serum (FBS), penicillin/streptomycin (1%), 200 mM l-glutamine (1%), 4-(2-hydroxyethyl)-1-piperazineethanesulfonic acid (HEPES) (2.5%), 100 mM sodium pyruvate (1%), and 45% d(+) glucose (1%). DMEM supplemented with 50% nutrient F-12 Ham (Sigma–Aldrich), 10% FBS, and 1% penicillin/streptomycin was used for MDA-MB-231 cell culture studies. All cells were maintained in 37°C incubator with 5% carbon dioxide. NMR analysis was performed on Bruker 300 MHz at Carnegie Mellon University. Fluorescence measurements were performed on Tecan Safire2 fluorescence plate reader at Carnegie Mellon University. NIR measurements were obtained on Li-COR Odyssey® imager at Duquesne University. All nanoemulsions were prepared on microfluidizer M110S (Microfluidics Corp., Newton, MA). dynamic light scattering (DLS) measurements were performed on Zetasizer Nano (Malvern, UK) using deionized water as dilution medium and at RT. 2.2.Nanoemulsion PreparationNanoemulsions were prepared at 25 g scale following Patel et al.8 method with some modifications. PFPE oxide (0.98 mL) and Cy3–PFPE (0.02 mL) were blended by vortex mixing in a 50 mL eppendorf tube. A mixture of 1 mL Miglyol 810N and 5 mM DiR dye (in absolute ethanol) was added to the Cy3–PFPE/PFPE mixture and vortex mixed. To this dispersion, 11.5 mL of mixed micelle solution ( CrEL/P105 ratio) followed by de-ionized water (6 mL) was added in portions and mixed with vortex. The remaining 5.5 mL de-ionized water was added during transfer to microfluidizer chamber (Microfluidics 110S). The dispersion was microfluidized for 30 pulses under recirculation mode at 6 bar inlet pressure. The obtained nanoemulsion was sterile-filtered using 0.22 μm syringe filter and the size recorded. For stability studies, samples were stored at 4°C. Bulk nanoemulsion was stored at 4°C until use. To prepare a drug containing nanoemulsion, 5 mg celecoxib was dissolved in Miglyol 810N by overnight stirring and the nanoemulsion prepared following above procedure. 2.3.Nanoemulsion CharacterizationNanoemulsions were characterized using reported procedures for determining droplet size, polydispersity, and zeta potential.8,13 NMR was recorded for nanoemulsions on Bruker 300 MHz NMR instrument with aqueous trifluoroacetic acid as the standard. The amount of PFPE in the nanoemulsion was calculated using a previously reported procedure.13 Fluorescence measurements were performed on a Tecan plate reader using a 10 nm bandwidth. Nanoemulsions were diluted 20 μL 480 μL () de-ionized water and 150 μL of the diluted sample was measured. Excitation spectra were obtained with an emission wavelength of 590 nm for Cy3 and 790 nm for DiR. The excitation wavelengths were scanned with a 2 nm step from 400 to 570 nm for Cy3 and 400 to 770 nm for DiR. Emission spectra were obtained with an excitation wavelength of 530 nm for Cy3 and 730 nm for DiR, and emission wavelengths were scanned with a 2 nm step from 550 to 850 nm for Cy3 and 750 to 780 nm for DiR. Fluorescence signal stability measurements were determined by fluorescence synchronous scan (excitation 500 to 830 nm, with emission at a 20 nm offset and 4 nm step) using samples prepared as above in duplicate. Detector gain setting was automatically calculated by the instrument for the first time point and the same value kept for follow-up measurements. Correlation of fluorescence signals with nanoemulsion concentration was determined by preparing successive dilutions of nanoemulsion in de-ionized water and using 100 μL of the sample in triplicate for fixed Ex/Em wavelength measurements at (Cy3) and (DiR). 2.4.Cell Culture Tests2.4.1.Cell viabilityThe effect of nanoemulsions on cell viability was tested in human breast cancer (MDA-MB-231) cells. Cells were seeded in a 96-well plate at and incubated for 48 h. Nanoemulsions with and without drug (diluted in medium) were added at different doses and incubated at 5% and 37°C. After 24 h, 50 μL of CellTiter-Glo® analyte was added to each well and the plate shaken for 20 min at RT in dark for cell lysis. The lysate (100 μL) was transferred to a 96-well opaque plate and luminescence was recorded on plate reader (Perkin-Elmer Victor 2 Microplate Reader). 2.4.2.Confocal microscopyTo visualize the cellular uptake of nanoemulsion, confocal microscopy was recorded for nanoemulsion-labeled macrophages (RAW 264.7). Briefly, 0.1 million macrophages were seeded in a 6-well plate and incubated at 5% and 37°C. After 48 h, the medium was aspirated, and cells were washed with PBS. Macrophages were exposed to nanoemulsion containing medium at concentration of PFPE. Dye-free nanoemulsion was used as treatment control, and macrophages that were not exposed to nanoemulsions were treated as negative control. Confocal imaging was achieved with 543 nm excitation and emission detection from 550 to 625 nm on a Leica SP2 spectral confocal for the detection of the Cy3 dye. DiR was detected with 633 nm excitation and emission detection from 650 to 850 nm with simultaneous acquisition of transmitted DIC images of the cells. Multicolor merge was achieved with Leica image software version 2.3 and the image contrast/brightness was adjusted in Adobe® Photoshop CS6. 3.Results3.1.Design and Formulation of a Two-Color Fluorescent and MR-Detectable TheranosticWhen designing a multimodal imaging nanosystem, it is crucial all functional components provide optimal signal to at least the same level as each modality alone. This is especially critical for optical imaging systems which provide two or three distinct wavelengths. PFC nanoemulsions have been labeled by fluorescent dyes before, either by introducing the fluorescent dye into the surfactant layer7 or the fluorocarbon core of the PFC nanodroplet.13 In the presented PFC nanoemulsion, two fluorescent dyes are introduced, Cy320 and NIR carbocyanine dye, DiR, into two distinct oil phases in the triphasic nanoemulsion system.21 Cy3 is conjugated directly to the PFPE core and DiR was added to the HC layer during nanoemulsion processing. Janjic et al.13 reported earlier that diverse fluorescent dyes can be directly conjugated to PFPEs, and these fluorescent PFPEs could be formulated into stable nanoemulsions capable of labeling a variety of cells in vitro. These new PFC constructs were named FBPAs.13 In this study, Cy3 was also conjugated directly to the PFPE and the fluorescently labeled oil was used for nanoemulsion preparation. Briefly, the fluorescent dye carrying an aliphatic amine handle () was introduced into the PFPE oils by direct conjugation to PFPE ester at low molar ratio (0.5 mol. %) via amide linkage and “capping” the remaining PFPE ester end groups as tertiary amides.19 The presence of two fluorine atoms next to the carbonyl PFPE end group and their strong electron withdrawing effect results in high reactivity of PFPE alkyl ester end groups toward various nucleophiles, including primary and secondary amines.22–25 Cy3–PFPE is then blended with PFPE oxide into unique fluorous phase as earlier reported.13 Fluorescent dye conjugated to the PFPE chain remains entrapped in the PFPE core of the nanoemulsion droplet throughout processing, following typical fluorous phase colloidal behavior.13,26 To explore drug carrying capacity of the triphasic two-color nanoemulsion, we introduced a model poorly soluble drug, celecoxib. The drug was dissolved in Miglyol 810N HC oil phase and incorporated during the pre-emulsification step.8 Briefly, the nanoemulsions are formed by high shear dispersion of two immiscible oils (PFPE and Miglyol) into nanodroplets stabilized with nonionic surfactants in water. The Miglyol oil phase carries the NIR tracer (DiR) and the drug (celecoxib), whereas the PFPE phase carries the conjugated cyanine dye (Cy3). Blended Cy3-FBPA/PFPE oil was added to Miglyol oil followed by mixed surfactant solution and the mixture was stirred at RT The resulting coarse pre-emulsion was microfluidized as described previously.13 Figure 1 show components and schematic representation for the triphasic structure of the PFPE theranostic nanoemulsion. Figure 1 demonstrates a certain level of complexity of the nanoemulsion formulation. However, the combination of two dyes in two distinct phases leads to overall processing simplification in comparison to approaches that utilize surface-conjugation of the dyes. Purification steps to separate conjugated dyes are avoided as one of the dyes is conjugated to PFPE prior to processing whereas the other is dissolved in the HC oil, and the two are brought together during the nanoemulsion assembly under high shear. In principle, the presented formulation strategy can be used to introduce multiple dyes in either phase and brought together for multicolor fluorescence imaging. We hope the nanoemulsion discussed here can serve as a good example for future designs and help expand the applicability of fluorescence imaging to process analysis and pharmaceutical development of nanoemulsions for both drug delivery and diagnostic applications. 3.2.Characterization of Fluorescently Labeled Triphasic NanoemulsionsWe present here a unique triphasic system (PFC/HC/water). The presence of three layers (PFPE, HC, and surfactant) in the system allows for introduction of multifunctional features, leading to true theranostic capabilities. The presented nanoemulsion is designed to serve two roles, the carrier of COX-2 inhibitors to macrophages and a triple-imaging agent (fluorescent in vitro imaging of labeled cells and tissues, in vivo NIR and MR imaging). The critical balance between imaging capabilities and drug loading must be achieved for the theranostic to be useful as a research tool or as a future therapeutic agent. For a PFC theranostic to be useful in studying macrophage behavior in inflammation, the following conditions must be satisfied: (1) the drug-free theranostic causes no effect on cellular health and growth; (2) macrophages take up the nanoemulsion; (3) the content of organic atoms is sufficient for in vivo MRI; (4) NIR signal is sufficient for optical in vivo imaging; and (5) fluorescence remains stable during processing and use for histology of excised tissues. Figure 2 shows the colloidal characteristics of the two-color fluorescently labeled triphasic nanoemulsion. The presence of celecoxib does not significantly affect the droplet size, polydispersity, and zeta potential of the nanoemulsion. Average droplet size was around 175 nm and DLS either by introducing a drug [Fig. 2(b)] or upon storage [Fig. 2(d)]. In earlier studies, we observed negative zeta potential values for PFPE nanoemulsions and found no adverse effects on cellular labeling.8,13,19 Fig. 2(a) DLS measurement of droplet size and polydispersity for drug-free nanoemulsion and celecoxib-loaded nanoemulsion stored at 4°C. (b) Size distribution by intensity comparison of drug-loaded and drug-free theranostic nanoemulsion. (c) Zeta potential measurement for drug loaded and drug-free nanoemulsion: average zeta potential is and conductivity was . There was no significant difference observed between drug-free and drug-loaded theranostic nanoemulsion. (d) Zeta potential measurements for drug-loaded measured at the time of production (day 0) and after 30 days of storage at 4°C.  3.2.1.Colloidal stability of fluorescently labeled triphasic nanoemulsionsThe PFPE oil can be stabilized in water using nonionic surfactants and formulated as two phase PFC/water emulsion, either dye free or with a fluorescent dye directly conjugated to PFPE.13 PFPE nanoemulsions are typically more stable than nanoemulsions prepared with small molecular weight PFCs.26 The more complex triphasic system reported here carries two fluorescent dyes (Cy3 and DiR), and a poorly water-soluble drug (celecoxib). Our recently reported triphasic nanoemulsion remained stable with no significant changes in droplet size and PDI for 70 days.8 Nanoemulsions reported here were stored at 4°C and followed for at least 45 days by DLS and zeta potential measurements. No significant change in droplet size, PDI or zeta potential were observed during that period, Fig. 2(a). 3.2.2.Optical stability of fluorescently labeled triphasic nanoemulsionsIn future applications of the nanoemulsion for macrophage behavior studies in tumor inflammation and other inflammatory diseases, fluorescent signal is as critical as MR. Most of the in vivo studies include post-imaging, post-mortem histological analysis of excised tissues, and organs. Therefore, we performed several tests to evaluate the stability and functionality of the two fluorescent dyes present in the nanoemulsion. Many nanoparticles have been reported to carry fluorescent dyes; however, literature reports on the detailed evaluation of fluorescent signal stability over time are rare. Our goal was to assure that the entire formulation remains stable over time, including all three imaging modalities, to assure reproducibility of in vivo studies. Triphasic nanoemulsions with and without the drug, and containing both dyes (Cy3 in the PFC core and DiR in the HC layer), were stored at three different temperatures, 4°C, RT, and 37°C. Storage at higher temperatures (RT and 37°C) led to loss of DiR fluorescence, Fig. 3(a) (top). NIR imaging was performed in triplicate using nanoemulsion samples with and without the drug on a Li-COR Odyssey® imager at an 800 nm emission wavelength. Fig. 3Optical assessment of the two-color triphasic PFC/HC/water nanoemulsions. (a) NIR fluorescence image of nanoemulsions stored at different temperatures taken at 800 nm emission using Li-COR Odyssey® NIR imager (top). Representative photo of the nanoemulsion samples stored at three temperatures showing changes in color resulting from DiR changes (bottom). (b) Synchronous EX/EM scan of Cy3 and DiR in nanoemulsions with and without the drug. (c) Representative excitation and (d) emission spectra showing both dyes in the nanoemulsion.  Figure 3(a) (bottom) shows visual color differences in representative nanoemulsion samples stored at the three different temperatures, indicating changes in the incorporated dyes. Synchronous excitation and emission scan measurements confirmed the presence of Cy3–PFPE, revealed some DiR conversion into a lower wavelength emitting product, DiI-(5) (peak around 650 nm), and showed that the presence of celecoxib leads to a small decrease in DiR fluorescence, Fig. 3(b). However, Fig. 3(c) and 3(d) show retention of normal spectral behavior of both dyes when incorporated into the nanoemulsion as measured 48-h post production and emulsions stored at 4°C. Excitation and emission maxima of the dyes in the nanoemulsion are 552 and 564 nm for Cy3, and 750 and 768 nm for DiR, Fig. 3(c) and 3(d). The high stability of the bound Cy3–PFPE is important for future in vivo work, and in assuring a high level of correlation between histological data and in vivo imaging. Most NIR dyes have stability issues27 and for histological assessments post emulsion-treatment in animals, Cy3 being covalently bound to the PFPE layer provides two advantages: (1) unambiguous correlation to MR signal in tissues, since the Cy3 dye remains tightly bound to PFPE and (2) a stable fluorescent internal standard to correlate NIR ex vivo measurements performed with DiR. This combination is therefore an improvement to our earlier reported approaches using single NIR dye for dual mode MR imaging.8,17 Fluorescence measurements show that nanoemulsions stored at 4°C retained fluorescence signals for both Cy3 and DiR dyes, Fig. 4(a) and 4(b). Fluorescent signals of Cy3 dye covalently bound to PFPE in the core of the emulsion barely decreased (4%) upon storage for 49 days at 4°C, Fig. 4(a). However, DiR showed a reduced fluorescence of 23% compared to day 0. To compare the fluorescence signals of both dyes over time, the ratio of DiR/Cy3 is shown in Fig. 4(c). A 19% decrease in the ratio was seen over 49 days. It is well known that NIR dyes are more susceptible to chemical and photo-instability than their visible counterparts. However, the percent loss of DiR fluorescence is still within an acceptable and usable range even after 49 days of storage. This result was encouraging, and demonstrated that by carefully storing the nanoemulsion, we can retain imaging capacity at a high level for all of the imaging agents involved (PFPE, Cy3, and DiR). However, due to the differences in fluorescence stability, the fluorescence contribution of each dye should be measured prior to experiments that rely on accurate fluorescence quantification. Fig. 4Fluorescence stability of the drug-loaded triphasic two-color nanoemulsion upon storage at 4°C. (a) Stability of fluorescence upon storage at 4°C for Cy3 (EX/EM 548/568) nm and (b) DiR (EX/EM 750/770 nm). (c) Fluorescence ratio of DiR/Cy3 over time using average fluorescence intensities from measurements shown in panels a and b.  3.3.In Vitro Evaluation of Triphasic Nanoemulsion Imaging FeaturesAs a dual imaging system, the reported PFPE theranostic nanoemulsions must satisfy several criteria: (1) sufficient content26 for future in vivo MR imaging of inflammation; (2) sufficient fluorescence signal for in vivo and ex vivo imaging; (3) no significant fluorescence interference or chemical interactions between the dyes and the drug; (4) concentration-dependent MR and optical signals; and (5) the nanoemulsion labels the cells and has no effect on cell viability and proliferation. In this study, optical and MR properties of triphasic theranostic nanoemulsions were evaluated in vitro. NMR was used to measure PFPE content in nanoemulsions as reported previously.13 The content of triphasic theranostic emulsions shows linear correlation with nanoemulsion concentration consistent with our earlier studies.6,8 In order to use fluorescence and MRI as complementary imaging techniques, a linear correlation between imaging signals and nanoemulsion concentration is expected. As shown in Fig. 5, we observed a linear relationship between nanoemulsion concentration and atoms, DiR, and Cy3 fluorescence signal intensities. Further, linear correlation between fluorescence signal and PFPE nanoemulsion exists in a range of concentrations (data not shown here), as we have reported in the past for other fluorescent PFPE nanoemulsions.8,13 Lack of this relationship would potentially render the theranostics inflexible in utilizing the imaging techniques interchangeably. 3.4.Triphasic Nanoemulsion Theranostic Evaluation in CellsTheranostic nanoemulsions must be biologically inert aside from the effects of the incorporated drug. The nanoemulsions were tested for their effects on cell proliferation, and no significant change was observed upon nanoemulsion exposure for 24 h in MDA-MB-231 cancer cells, Fig. 6(a). Fluorescence microscopy was performed on RAW 264.7 macrophages labeled in culture for 24 h with a celecoxib-loaded dual fluorescent nanoemulsion and a dye-free nanoemulsion. As shown in Fig. 6(b), confocal images show the presence of nanoemulsion droplets in the cytoplasm of macrophages. In the transmitted light (DIC) image [Fig. 6b (bottom row)], macrophages labeled with emulsions showed granularity in the cytoplasm, compared to untreated macrophages (no emulsion), confirming the uptake of nanoemulsion droplets. Fig. 6(a) Viability of MDA-MB-231 cancer cells upon 24 h exposure assessed by CellTiter-Glo® assay, . (b) Confocal fluorescence images of RAW 264.7 macrophages exposed to culture medium (left column), nanoemulsion with no dyes (middle), and dual fluorescent celecoxib nanoemulsion (right). Cells exposed to emulsion exhibit a granular particulate cytoplasm, which is not evident in control cells not exposed to emulsion. Emulsion with dyes exhibit fluorescence for Cy3 and DiR. . (c) Merged Cy3 and DiR for the cell marked with asterisk. .  Macrophages with dye-free nanoemulsion did not show fluorescence, although granularity was observed in the DIC image [Fig. 6b (middle)]. Macrophages labeled with the dual fluorescent nanoemulsion showed fluorescence corresponding to DiR and Cy3 dyes [Fig. 6b (right column)]. It appears that Cy3 and DiR fluorescent signals are co-localized for most of the nanodroplets, observed by merging both channel images [Fig. 6(c)]. This could potentially indicate that Cy3 and DiR dyes are co-present in the nanodroplets, while separation of dye signals may indicate different intracellular fates of the PFPE and oil-soluble dye components. Microscopic images clearly indicate that macrophages were able to take up nanoemulsion and exhibit fluorescence corresponding to both dyes. 4.ConclusionsWe have developed a dual fluorescent, multimodal imaging-capable nanoemulsion which incorporates celecoxib as therapeutic moiety. The reported triphasic PFC/HC/water nanoemulsions showed good colloidal stability for at least 45 days. Nanoemulsions stored at 4°C showed minimal loss of fluorescence for 49 days. As expected for NIR dyes, DiR fluorescence showed a 23% drop compared to day 0. The spectral characteristics of the two dyes in the nanoemulsion were retained following processing and storage at low temperatures. We were able to detect both dyes in the nanoemulsion and cells. To the best of our knowledge, this is the first two-color PFC nanoemulsion, and the first to show extensive optical and colloidal stability evaluation in vitro. Further, the reported theranostic nanoemulsion offers flexibility for in vitro and in vivo inflammation imaging and histological analysis using three distinct imaging functionalities (visible and NIR fluorescence, and MR). Finally, the extensive in vitro evaluation methods for theranostic nanoemulsions including NMR, optical measurements, and microscopy reported here can be used as a model for future theranostic development. AcknowledgmentsJ.M.J. and J.A.P. are supported by Pittsburgh Tissue Engineering Initiative Seed Grant. J.M.J. is supported by Commonwealth Universal Research Enhancement (CURE) program from the Pennsylvania Department of Health and Duquesne University Faculty Development Funds. M.J.P. is supported through NMR Center for Biomedical Research funded by National Institutes of Health (P41 EB001977). Special thanks go to Gayathri Withers for NMR measurements performed on NMR instruments partially supported by NSF (CHE-0130903 and CHE-1039870) at the NMR Facility of the Department of Chemistry, Carnegie Mellon University. We would like to thank Professor Rehana Leak (Duquesne University) for providing access and technical support on Li-COR Odyssey®. ReferencesT. K. Hitchenset al.,
“19F MRI detection of acute allograft rejection with in vivo perfluorocarbon labeling of immune cells,”
Magn. Reson. Med., 65
(4), 1144
–1153
(2011). http://dx.doi.org/10.1002/mrm.22702 MRMEEN 0740-3194 Google Scholar
A. Balducciet al.,
“Visualizing arthritic inflammation and therapeutic response by fluorine-19 magnetic resonance imaging (19F MRI),”
J. Inflammation (London, U. K.), 9
(1), 24
–34
(2012). http://dx.doi.org/10.1186/1476-9255-9-24 JOINFB 1476-9255 Google Scholar
D. K. Kadayakkaraet al.,
“Assaying macrophage activity in a murine model of inflammatory bowel disease using fluorine-19 MRI,”
Lab. Invest., 92
(4), 636
–645
(2012). http://dx.doi.org/10.1038/labinvest.2012.7 LAINAW 0023-6837 Google Scholar
G. M. Lanzaet al.,
“1H/19F magnetic resonance molecular imaging with perfluorocarbon nanoparticles,”
Curr. Top. Dev. Biol., 70 57
–76
(2005). http://dx.doi.org/10.1016/S0070-2153(05)70003-X CTDBA5 0070-2153 Google Scholar
P. M. Winteret al.,
“Emerging nanomedicine opportunities with perfluorocarbon nanoparticles,”
Expert Rev. Med. Devices, 4
(2), 137
–145
(2007). http://dx.doi.org/10.1586/17434440.4.2.137 1743-4440 Google Scholar
A. Balducciet al.,
“A novel probe for the non-invasive detection of tumor-associated inflammation,”
Oncoimmunology, 2
(2), 1
–11
(2013). http://dx.doi.org/10.4161/onci 2162-4011 Google Scholar
Y. T. Limet al.,
“Multifunctional perfluorocarbon nanoemulsions for (19)F-based magnetic resonance and near-infrared optical imaging of dendritic cells,”
Chem. Commun., 45 6952
–6954
(2009). http://dx.doi.org/10.1039/b914006a 1359-7345 Google Scholar
S. K. Patelet al.,
“Cyclooxgenase-2 inhibiting perfluoropoly (ethylene glycol) ether theranostic nanoemulsions—in vitro study,”
PLoS One, 8
(2), e55802
(2013). http://dx.doi.org/10.1371/journal.pone.0055802 1932-6203 Google Scholar
J. V. Frangioni,
“In vivo near-infrared fluorescence imaging,”
Curr. Opin. Chem. Biol., 7
(5), 626
–634
(2003). http://dx.doi.org/10.1016/j.cbpa.2003.08.007 COCBF4 1367-5931 Google Scholar
N. R. Somanet al.,
“Molecularly targeted nanocarriers deliver the cytolytic peptide melittin specifically to tumor cells in mice, reducing tumor growth,”
J. Clin. Invest., 119
(9), 2830
–2842
(2009). http://dx.doi.org/10.1172/JCI38842 JCINAO 0021-9738 Google Scholar
H. Panet al.,
“Post-formulation peptide drug loading of nanostructures for metered control of NF- signaling,”
Biomaterials, 32
(1), 231
–238
(2011). http://dx.doi.org/10.1016/j.biomaterials.2010.08.080 BIMADU 0142-9612 Google Scholar
J. Myersonet al.,
“Thrombin-inhibiting perfluorocarbon nanoparticles provide a novel strategy for the treatment and magnetic resonance imaging of acute thrombosis,”
J. Thromb. Haemostasis, 9
(7), 1292
–1300
(2011). http://dx.doi.org/10.1111/jth.2011.9.issue-7 JTHOA5 1538-7933 Google Scholar
J. M. Janjicet al.,
“Self-delivering nanoemulsions for dual fluorine-19 MRI and fluorescence detection,”
J. Am. Chem. Soc., 130
(9), 2832
–2841
(2008). http://dx.doi.org/10.1021/ja077388j JACSAT 0002-7863 Google Scholar
D. K. Kadayakkaraet al.,
“In vivo observation of intracellular oximetry in perfluorocarbon-labeled glioma cells and chemotherapeutic response in the CNS using fluorine-19 MRI,”
Magn. Reson. Med., 64
(5), 1252
–1259
(2010). http://dx.doi.org/10.1002/mrm.v64:5 MRMEEN 0740-3194 Google Scholar
D. K. Kadayakkaraet al.,
“Inflammation driven by overexpression of the hypoglycosylated abnormal mucin 1 (MUC1) links inflammatory bowel disease and pancreatitis,”
Pancreas, 39
(4), 510
–515
(2010). http://dx.doi.org/10.1097/MPA.0b013e3181bd6501 PANCE4 0885-3177 Google Scholar
B. M. Helferet al.,
“Functional assessment of human dendritic cells labeled for in vivo (19)F magnetic resonance imaging cell tracking,”
Cytotherapy, 12
(2), 238
–250
(2010). http://dx.doi.org/10.3109/14653240903446902 CYTRF3 1465-3249 Google Scholar
C. E. O’Hanlonet al.,
“NIR-labeled perfluoropolyether nanoemulsions for drug delivery and imaging,”
J. Fluorine Chem., 137 27
–33
(2012). http://dx.doi.org/10.1016/j.jfluchem.2012.02.004 JFLCAR 0022-1139 Google Scholar
M. J. Patricket al.,
“Intracellular pH measurements using perfluorocarbon nanoemulsions,”
J. Am. Chem. Soc.,
(2013). JACSAT 0002-7863 Google Scholar
R. B. Mujumdaret al.,
“Cyanine dye labeling reagents: sulfoindocyanine succinimidyl esters,”
Bioconjugate Chem., 4
(2), 105
–11
(1993). http://dx.doi.org/10.1021/bc00020a001 BCCHES 1043-1802 Google Scholar
“Tracers for membrane labeling,”
The Molecular Probes® Handbook-A Guide to Fluorescent Probes and Labeling Technologies, 618
–629 11th ed.Life Technologies(2010). Google Scholar
C. TonelliP. GavezottiE. Strepparola,
“Linear perfluoropolyether difunctional oligomers: chemistry, properties and applications,”
J. Fluorine Chem., 95
(1–2), 51
–70
(1999). http://dx.doi.org/10.1016/S0022-1139(98)00298-X JFLCAR 0022-1139 Google Scholar
C. TonelliA. Di MeoE. Barchiesi,
“Perfluoropolyether alkyl diesters: structure effects of the alkyl group on the kinetics of the hydrolysis reactions,”
J. Polym. Sci., Part A: Polym Chem, 40
(23), 4266
–4280
(2002). http://dx.doi.org/10.1002/(ISSN)1099-0518 JPACEC 0887-624X Google Scholar
C. Tonelliet al.,
“Perfluoropolyether functional oligomers: unusual reactivity in organic chemistry,”
J. Fluorine Chem., 118
(1–2), 107
–121
(2002). http://dx.doi.org/10.1016/S0022-1139(02)00207-5 JFLCAR 0022-1139 Google Scholar
F. PiacentiM. Camaiti,
“Synthesis and characterization of fluorinated polyetheric amides,”
J. Fluorine Chem., 68
(2), 227
–235
(1994). http://dx.doi.org/10.1016/0022-1139(93)03045-N JFLCAR 0022-1139 Google Scholar
J. M. JanjicE. T. Ahrens,
“Fluorine-containing nanoemulsions for MRI cell tracking,”
Wiley Interdiscip. Rev.: Nanomed. Nanobiotechnol., 1
(5), 492
–501
(2009). http://dx.doi.org/10.1002/wnan.35 Google Scholar
G. A. CasayD. B. ShealyG. Patonay,
“Near-infrared fluorescent probes,”
Topics in Fluorescence Spectroscopy: Volume 4: Probe Design and Chemical Sensing, 183
–217 Plenum Press, New York
(1994). Google Scholar
|