|
|
1.IntroductionInjury is the leading cause of death for people aged 1 to 44 year(s) in the United States. It results in 31 million Emergency Department (ED) visits each year and accounts for approximately a third of all ED visits and 8% of all hospital stays.1 Injury is a worldwide problem, and it results in 5.8 million deaths annually, many of which can be prevented.2 When a patient loses a large volume of blood due to an injury, their blood pressure drops causing poor perfusion and oxygen delivery to the tissue. This lack in perfusion results in anaerobic metabolism that causes tissue acidosis, which can lead to the failure of multiple vital organs, known as multiple organ dysfunction syndrome (MODS). To avoid MODS, treatment usually starts by controlling the bleeding and volume resuscitation before operating on any of the primary injuries.3,4 The oxygen deprivation period is commonly known as shock. Longer shock periods result in a higher tissue oxygen debt, which usually requires longer resuscitation time even after some of the vital signals (i.e., heart rate, blood pressure, etc.) of the patient are back to normal levels. During that period, the tissue oxygen uptake/consumption and perfusion are elevated to accommodate for tissue needs. Consequently, normal oxygen consumption has been proposed as the safe end-point of resuscitation.5 The current standard of care for the resuscitation end-point relies on systemic indicators such as blood pressure, urine output, and heart rate. After these parameters are normalized, up to 85% of patients are still in “compensated shock,” and they still have tissue acidosis.3 Monitoring tissue perfusion and oxygen consumption in real time can provide clinicians with a more clear and safe end-point of resuscitation.5 Some functional imaging modalities, such as magnetic resonance imaging, can provide information about perfusion and oxygen consumption; however, they are not cost efficient and have a low throughput, and thus, they are not appropriate for continuous monitoring.6 Optical techniques can potentially provide a real-time, cost-efficient, and minimally invasive way for monitoring perfusion and oxygenation changes in tissue.7–13 Currently, the gold standards for tissue perfusion and flow monitoring in operating rooms are thermal diffusion, laser Doppler, and transit-time ultrasound flowmetry.13–16 Although these techniques can provide continuous, real-time reading of microcirculation perfusion changes and/or vascular flow levels, they do not provide any data on the oxygen uptake, which is critical to assess the adequacy of perfusion and tissue stress. Traditional oxygenation measurement techniques, such as catheterization and blood draws, are invasive and not suitable for long-term, continuous monitoring of oxygenation changes. Optical techniques remain the gold standard for noninvasive monitoring of tissue oxygen saturation because of hemoglobin’s optical properties that change depending on its oxygenation state, as shown in Fig. 1 (Ref. 17 and 18). Near-infrared spectroscopy (NIRS) is perhaps the most common of these techniques.7,19,20 The technique delivers multiple NIR wavelengths of light to the tissue, and the diffusely reflected light is collected and analyzed. The difference in attenuation between the optical bands is measured and can be used to track the changes in reduced hemoglobin (Hb), oxygenated hemoglobin (), total hemoglobin (HbT), and other chromophores of interest. A measure of the light-path length is required to get quantitative information, which can be accomplished by multiple techniques such as NIRS in the frequency domain (FD-NIRS) or in the time domain (TD-NIRS).21 FD-NIRS uses a modulated light source for illumination, and the phase information of the collected wave is used to calculate the path length. TD-NIRS employs pulsed light illumination and detects the shape of the pulse after propagation through tissue to calibrate the measurements. NIRS measures tissue hemodynamics, but it cannot separate arterial and venous contributions. Fig. 1Extinction coefficient of reduced hemoglobin (Hb, in blue) and oxygenated hemoglobin (, in red). Multiple isobestic points can be seen in the visible and NIR ranges. The NIR isobestic point around 800 nm is the most commonly used for near-infrared spectroscopy (NIRS) and photoplethysmography (PPG) sensors (plot based on data from Ref. 18).  Photoplethysmography (PPG) is another optical technique, which is based on measuring fluctuations in tissue blood volume due to the arterial pulsatility and information about pulse pressure at a certain wavelength can be extracted and correlated with perfusion levels.22 The principle of PPG can be combined with that of spectroscopy by measuring the PPG signal at multiple wavelengths (typically two). This can be used to obtain a measure of arterial oxygen saturation, which is the basis of pulse oximetry. Pulse oximetry is the most widely accepted technique for monitoring oxygenation noninvasively.11 Pulse oximeters measure peripheral oxygen saturation which, in the case of severely injured patients, does not always correlate with tissue oxygenation in vital organs. Moreover, pulse oximetry, in its basic form, measures only arterial oxygen saturation and does not provide any information about venous oxygenation or oxygen extraction/consumption. However, PPG can be modified to measure venous and arterial saturations, which can then be used to calculate tissue oxygen consumption.8 In addition, if the sensor is designed to operate in reflection mode, it can be used to monitor splanchnic organs.9,23 Moreover, PPG has been shown to have the ability to track changes in perfusion and oxygenation independently.22,24–26 The aforementioned optical techniques commonly employ long visible and NIR wavelengths (660 to 940 nm), due to the relative transparency of biological tissue in that range.27,28 Compared with visible light, this allows a higher-penetration depth (several millimeters) and a larger probing volume that is typically desired to increase the hemoglobin signal. For that same reason, large source to detector separations ( to 50 mm) are typically used to probe deep tissue and to avoid superficial poorly vascularized regions.29–32 However, in the case of monitoring trauma patients during resuscitation, particularly abdominal trauma, it is of paramount importance to monitor perfusion and oxygen uptake in the intestines which are relatively thin and transparent to light.33,34 The human jejunum is 3.5 to 4 mm in thickness, and probing it with conventional NIR probes leads to high background signals and causes strong motion artifact from the lumen of the intestine and/or other tissue surrounding it.35 This is problematic for any optical technique, and in particular to PPG sensors that measure the inherently weak arterial pulsatile signal (0.2% to 5.2%), which can sometimes be overridden by these motion artifacts.36 In addition, because of the small volume of probed tissue, the hemoglobin signal is usually weak. Previous studies by Hickey et al. showed that using shorter source to detector separations can lead to better PPG signals from the splanchnic organs such as the bowel and stomach.37,38 However, wavelength selection was not discussed, which is essential to maximize the signal-to-background ratio from the small-probed volume. Moving to the visible wavelengths range (where hemoglobin absorption is an order of magnitude higher than in its NIR counterpart) increases the sensitivity to hemoglobin changes. In this article, a thorough theoretical analysis of the problems in monitoring perfusion and oxygenation using NIR light in the intestine are presented. Monte Carlo (MC) simulations to support the findings as well as potential solutions are also proposed and tested. Finally, the results are verified with preliminary in vivo porcine studies with a sensor based on the PPG technique. 2.Materials and MethodsIn order for an optical sensor to succeed in monitoring perfusion and oxygenation changes in the intestine, it has to satisfy a few conditions: (1) High sensitivity to hemoglobin concentration changes, (2) optical contrast between the two oxygenation states of hemoglobin at the selected wavelength(s), and (3) penetration depth that is sufficient to satisfy conditions (1) and (2), but that does not exceed the thickness of the probed tissue (). In the following sections, the methods used to adjust these parameters to conform to the proposed criteria are presented. The two main independent variables are illumination wavelengths and source to detector separation. 2.1.Perfusion and Oxygenation SignalHemoglobin absorption is the main source of contrast in monitoring perfusion and oxygenation changes. To study the strength of the signal at different wavelengths, we look at the absorption coefficient dynamic range due to perfusion and oxygenation changes. This is followed by MC simulations (Sec. 2.3) that consider the contribution of both the absorption and the scattering of light in tissue. The oxygenation signal is mainly a result of the change in the absorption properties of hemoglobin when it switches between its oxygenated and deoxygenated state ( and Hb respectively). A typical pulse oximeter would operate two red-NIR wavelengths of light: one that is more sensitive to oxy-hemoglobin, and the other more sensitive to deoxy-hemoglobin. Most sensors employ a third wavelength at an isobestic point that has optical properties independent of the oxygenation state. This wavelength is typically used to measure and/or separate the contribution of other hemoglobin forms (met-hemoglobin and carboxy-hemoglobin) as well as other confounder chromophores and dyes in the selected spectral region.39,40 A common method for studying the oxygenation signal as a function of wavelength is to look at the differences between the optical properties of oxy- and deoxy-hemoglobin. These differences are mainly due to the absorption coefficient, since the scattering properties of blood have been shown to be relatively independent of its oxygen content.17 Equation (1) was used to look at the oxygenation signal at each wavelength. Note that the zero crossings of that equation correspond to isobestic points. In Eq. (1), is the difference signal and and are the absorption coefficient of deoxy- and oxy-hemoglobin, respectively. The perfusion signal is a result of the change in blood volume in the tissue. To simulate that signal, the full dynamic range due to changes in blood volume is examined. This is quantified by the difference in absorption coefficient between normally perfused tissue and unperfused (ischemic) tissue [Eq. (2)]. This quantity, designated , has the same trend as the signal-to-background ratio (blood to total signal). Further details on Eqs. (1) and (2) are described in the Appendix. These simplified equations served as a guide for the simulations. Specifically, they provided information regarding which wavelengths are viable candidates for determining appropriate oxygenation and perfusion signals and which ones are less sensitive to hemodynamic changes. The performance of the wavelengths of interest guided by the above two equations was modeled using MC simulations as described in Sec. 2.3. 2.2.Penetration DepthThe penetration depth properties were assessed using the equations derived by Weiss et al. based on a random walk model.41 The first quantity of interest is the mean penetration depth (). This symbolizes the average penetration depth of a group of photons launched into a medium. This quantity is a function of the optical properties ( and ) of the medium, which in turn depend on the wavelength of light and the distance from the source to detector () used to collect these photons [Eq. (3)]. In Eq. (3), and are the absorption coefficient and the reduced scattering coefficient of the medium (perfused tissue), respectively. In addition, is the source to detector separation. Although it is important to describe, on average, how deep the photons propagate in the medium, the mean penetration depth () described above provides neither the full picture to understand the probing volume nor what percentage of photons are probing the intestine lumen and/or surrounding tissue. To obtain that information, the probability density function () of the penetration depth is calculated as described in Eq. (4).41 This equation describes the distribution of the collected photons over depth in which represents the depth in tissue which is different from the mean penetration depth . Note that Eqs. (3) and (4) assume a homogeneous infinite medium of perfused tissue. The optical properties are also considered to be the weighted average of tissue and fully oxygenated blood (), and all of these equations [Eqs. (1)–(4)] are evaluated in MATLAB (Mathworks Inc., Natick, Massachusetts). 2.3.Monte Carlo ModelFor the MC simulations, the Monte Carlo in multilayered tissues program developed by Wang et al. was employed.42 The medium was considered as a single layer of homogeneous tissue. The optical properties were varied to model changes in the perfusion and oxygenation state, as shown in Table 1. Eight commercially available light-emitting diode (LED) wavelengths were selected for the simulations. The optical properties used for the intestine tissue were reported by Chan et al.34 The tissue refractive index and anisotropy factor were assumed to be 1.4 and 0.9, respectively. There are numerous references for the optical properties of blood, but the ones used in this work were based on the data reported by Prahl18 and Friebel et al.17 The refractive index of blood was assumed to be constant at 1.4. Previous work has shown that the changes in whole blood refractive index are minimal and that the refractive index ranges between 1.375 and 1.4 for the wavelength range of interest.43 Every MC simulation consisted of 10 million photon packets. Table 1Optical properties of the human jejunum and oxygenated and deoxygenated blood. The absorption and scattering coefficients are all in cm−1.
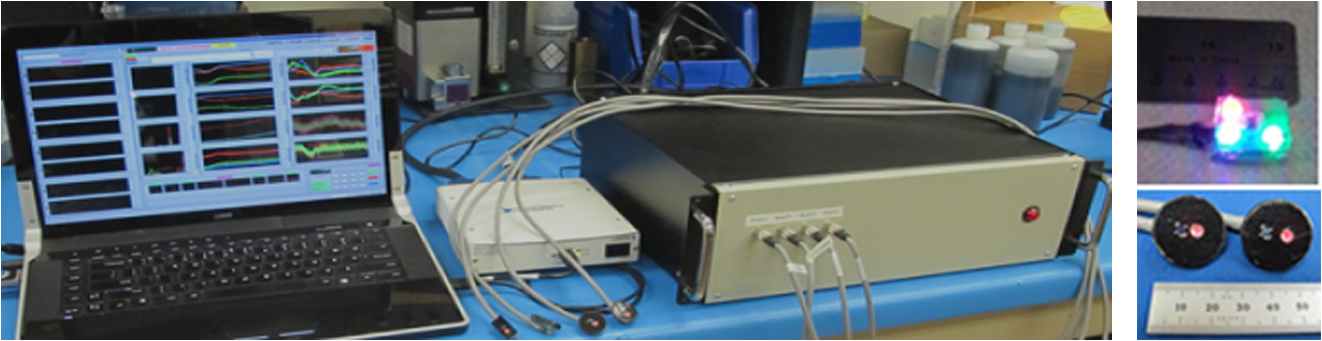
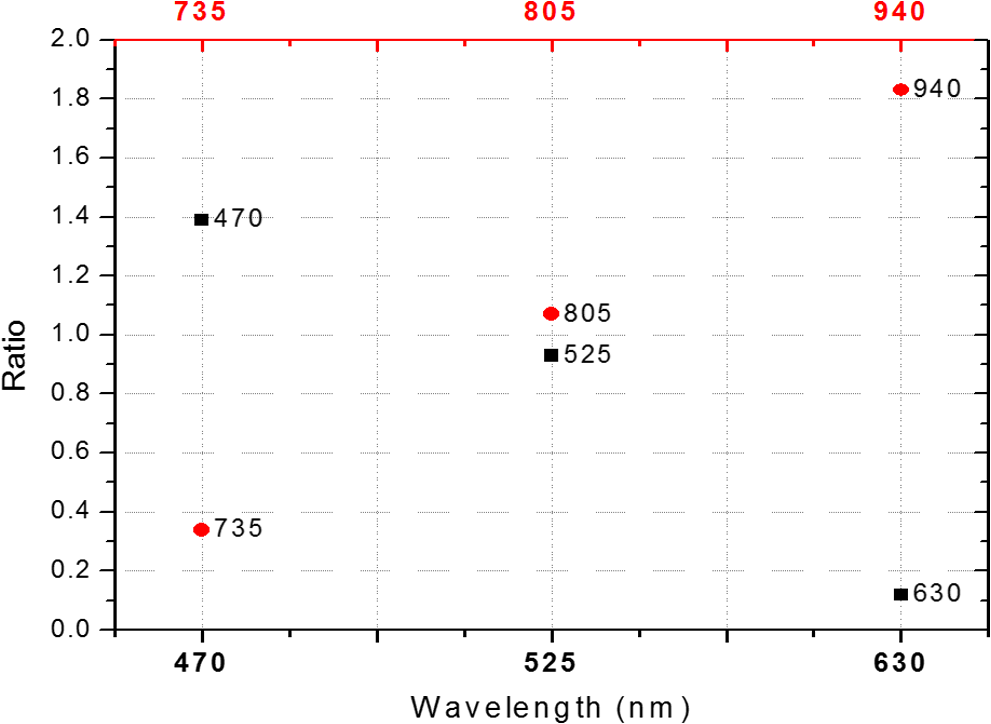
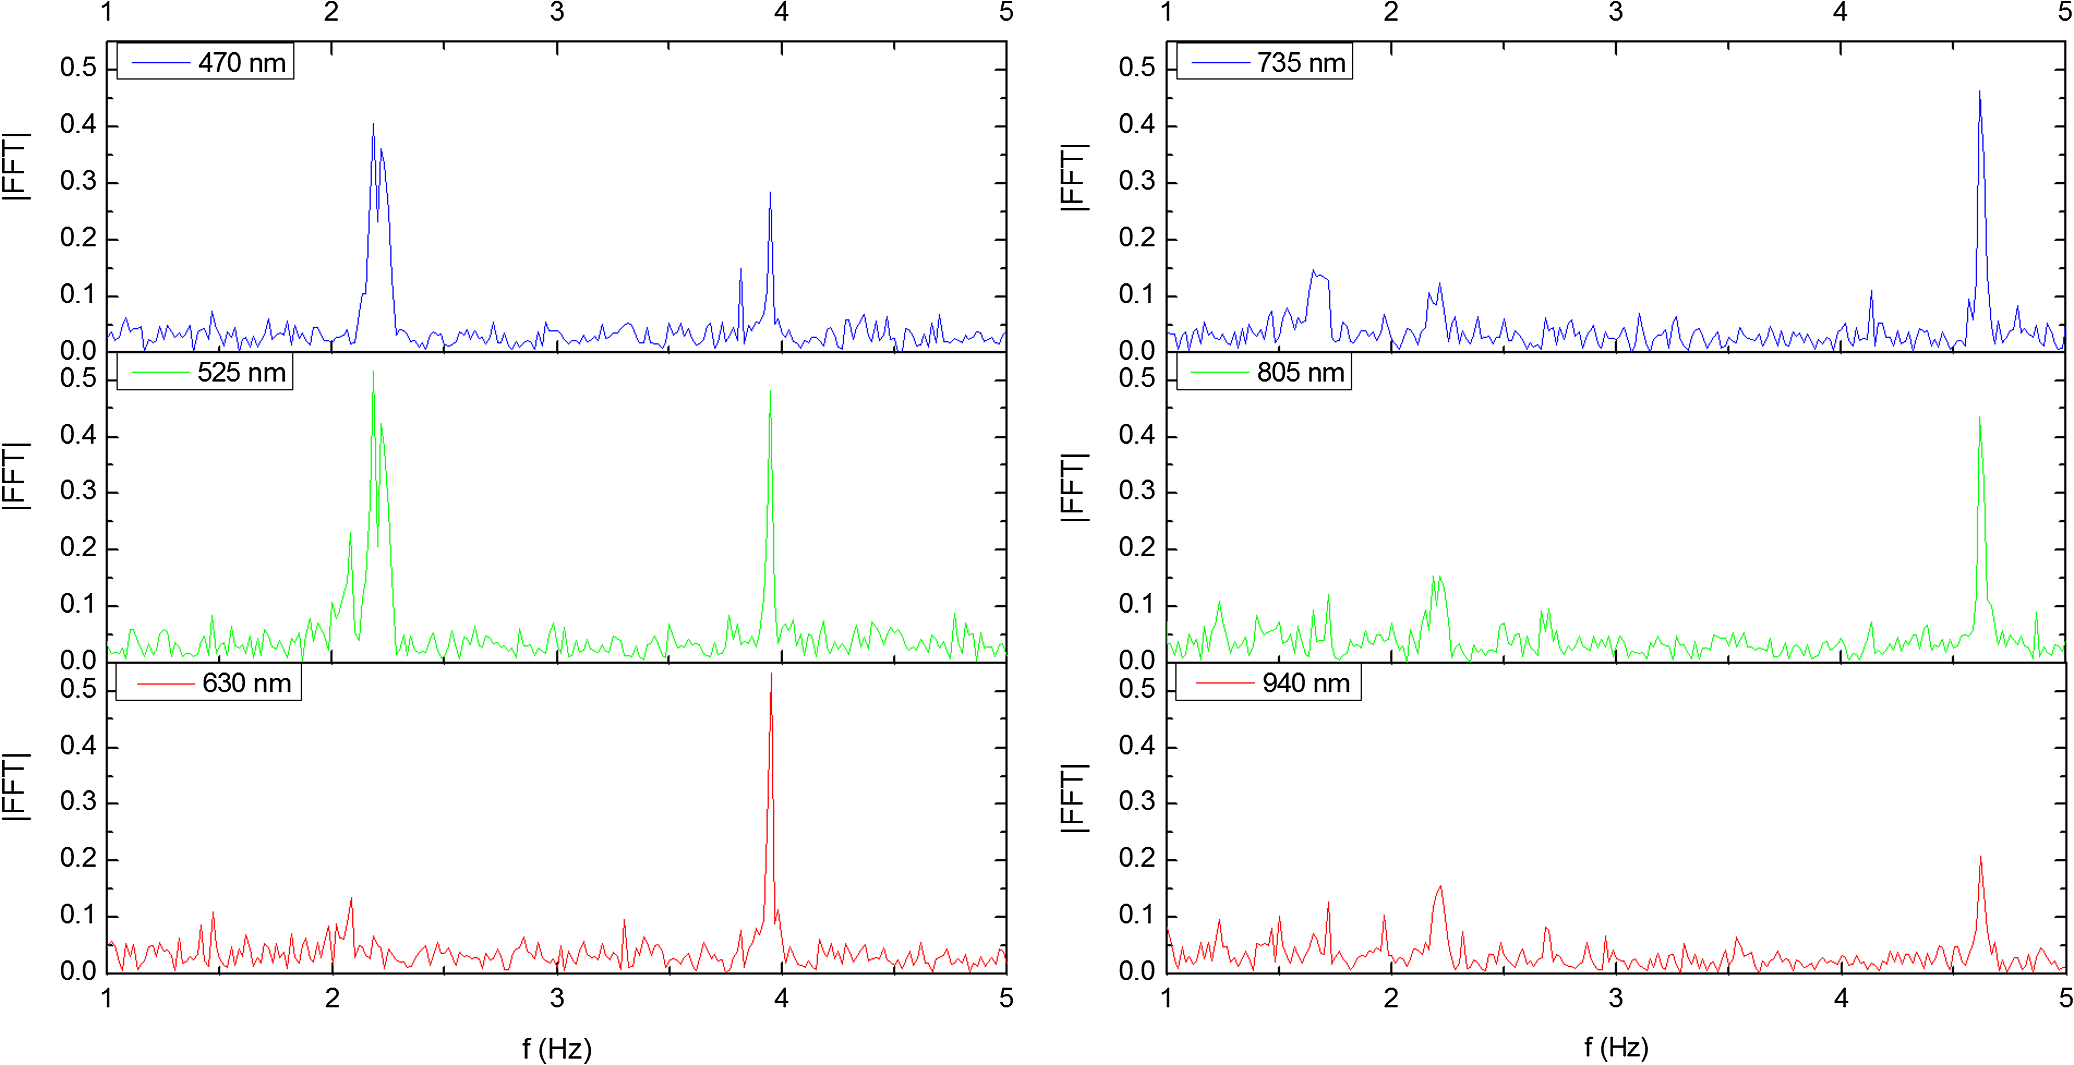
In the case of perfused tissue, the medium was considered homogeneous, and the optical properties were set to the weighted average of the two (tissue and blood). Skinner and O’Brien reported that the percentage of vasculature within the mucosa of the colon tissue varies between 7.7% and 13.4% depending on the exact location (proximal, mid, and distal colon).44 This number should be a fair estimate of the percentage of vasculature in the small intestine. In the model, 12% was used as the percentage of vasculature. 2.4.InstrumentationTo verify the results of the model, data was collected using a PPG sensor system developed by our group. The instrumentation has been previously described in detail, and the performance of the system has been validated on phantoms and liver tissue.9,24,45–47 In brief, the sensor system interface board has four channels each of which can drive a three wavelength PPG probe. The wavelengths are time multiplexed, and the reflected light is collected using a single photodetector. The collected signal from each sensor, after passing through a pre-amp, is split into two channels. The first channel, the AC channel, has a band-pass filter with cutoff frequencies () at 0.15 and 15 Hz. It should be noted that the high-pass cutoff frequency in the band-pass filter was set at 0.15 Hz to separate the DC level from the AC signal. The pulsatile AC signal is known to be around 0.2% to 5.2% of the total collected signal36 and requires high-gain amplification; however, it is essential that the DC signal can be eliminated from the amplification channel to avoid saturation and that is the role of the 0.15-Hz cutoff filters. In the new generation of this device, the cutoff frequency is set at 0.55 Hz to eliminate the respiratory motion. The filtered AC signal passes through a variable gain amplifier that allows for eight gain settings in the range of 1 to . In the second channel, the DC channel, the signal passes through a low-pass filter with a 3-dB cutoff frequency at 0.15 Hz. The same process is applied to all three wavelengths of each sensor resulting in a total of 24 channels (four sensors, three wavelengths each, AC and DC signals). All channels are digitized and sent to a computer for processing via a USB-6529 (National Instruments Corporation, Austin, Texas). Two types of probes were used in the in vivo porcine study. The NIR probes, which our group has used in the past to measure perfusion and oxygenation in liver tissue, consist of three wavelengths, 735, 805, and 940 nm (L660/735/805/940-40B42, Epitex Inc., Japan).9,24,46 All three wavelengths are packaged in the same lens to probe the same location and to avoid problems associated with tissue perfusion heterogeneity. The second set of probes was fabricated for the sole purpose of this study and consists of visible wavelengths bands centered at 465, 525, and 639 nm (part number LED528EHP, LED465E, and LED630E respectively, Thorlabs Inc., Newton, New Jersey). Each of the wavelengths is a separate LED with a separate lens. The three LEDs were placed at three corners of the photodetector to insure the source to detector spacing is the same for all wavelengths. Both probes used the same silicon photodetector (S2833-01, Hamamatsu, Bridgewater, New Jersey). The edge to edge separation on all probes used in this work was approximately 2 mm (equivalent to 6 to 7 mm center-to-center separation). The visible probes were coated with polydimethylsiloxane to protect the circuitry from the wet tissue. Figure 2 shows the sensor interface and the probes. 2.5.In Vivo Porcine StudyAll animal studies were performed under an animal use protocol (AUP #2010-257) approved by the Institutional Animal Care and Use Committee at Texas A&M University. The study was performed on a pig (body weight 27.5 kg). The pig was premedicated with Telazol 5 to . Buprenorphine 0.01 to was used as an analgesic. Both drugs were introduced intramuscularly 10 to 15 min prior to anesthesia induction. Initial anesthesia was induced via inhalation of 3% to 4% isoflurane in oxygen at . An endotracheal tube was placed and connected to a breathing circuit. Anesthesia was maintained by inhalation of isoflurane (0.5% to 4%) in oxygen (). Once the animal was anesthetized, a laparotomy was performed to get access to the intestine. The two PPG probes (NIR and VIS) were placed in adjacent spots on the serosal surface of the jejunum and sutured in place. Throughout the operation, the animal’s vital signals (, pressure, heart rate, temperature, and respiratory rate) were monitored and recorded. To alter the perfusion levels, the intestine was clamped for short durations () throughout the study. The PPG signals on both probes were recorded continuously before, during, and after the occlusions. At the end of the data collection, while still anesthetized, the animal was euthanized with a barbiturate derivative solution administered intravenously (80 to ). 3.Results and Discussion3.1.Perfusion and Oxygenation SignalsUsing Eq. (2), the changes in signal-to-background ratio as a function of wavelength (Fig. 3) were investigated. The visible wavelengths were shown to carry a higher signal from blood relative to tissue. The results of this equation (solid line in Fig. 3) were compared with the ratio of reflectance from the perfused and unperfused cases of an MC simulation (dots in Fig. 3). The two methods show the same trend indicating a higher perfusion signal from the visible wavelengths. The signal (reflectance ratio) is over an order of magnitude higher at 470 nm compared with the NIR wavelengths (735, 805, and 940 nm). Note that the three wavelengths of 470, 525, and 590 nm have similar levels of perfusion signal. This quantity was calculated for the case of oxygenated and deoxygenated blood, and the results are similar in both cases (data shown in the Appendix). In summary, at 470 nm the signal is higher in the oxygenated case, while for the 590-nm wavelength the signals are flipped, and the deoxygenated case shows a higher level of signal. The 525 nm showed the same levels of signal independent from the oxygenation level and can be used as an isobestic wavelength. Fig. 3Perfusion signal as a function of wavelength when the intestine is perfused with oxygenated blood. The solid lines show the SBR calculated from the change in the optical properties between perfused and ischemic tissues [Eq. (2)]. The dots are the Monte Carlo (MC) simulation results at the wavelengths of interest. The data show over an order of magnitude enhancement when moving from the NIR to VIS wavelengths. 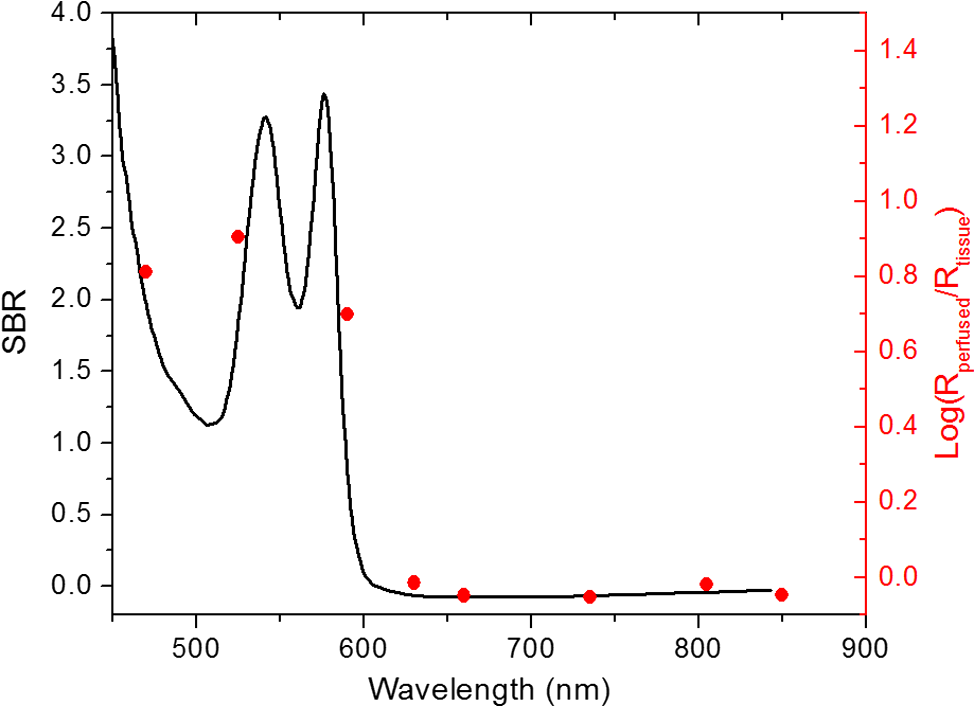 Equation (1) was used to better quantify the oxygenation signal. The zero crossings in that equation indicate isobestic points in the hemoglobin spectrum (Fig. 4, solid line). Since this equation is simplified and does not take into account the effects of scattering, tissue optical properties, and geometry, we compared the results to the change in reflectance measured from MC simulations (), as reflected by the red dots in Fig. 4. The results show that the level of the oxygenation signal is similar for both the visible and NIR wavelengths. Moreover, there are multiple wavelengths in the visible range that can be used as isobestic points. Note that the oxygenation signal defined in Eq. (1) and shown in Fig. 4 describes the sensitivity of the sensor to oxygenation changes, since it measures the total change in signal over the full range of oxygenation (from 0% to 100% saturation). Fig. 4Oxygenation signal as calculated by Eq. (1) (solid line) and through MC simulations (red dots). Note the multiple isobestic points in the visible range and the bands of oxygenation-sensitive wavelengths. 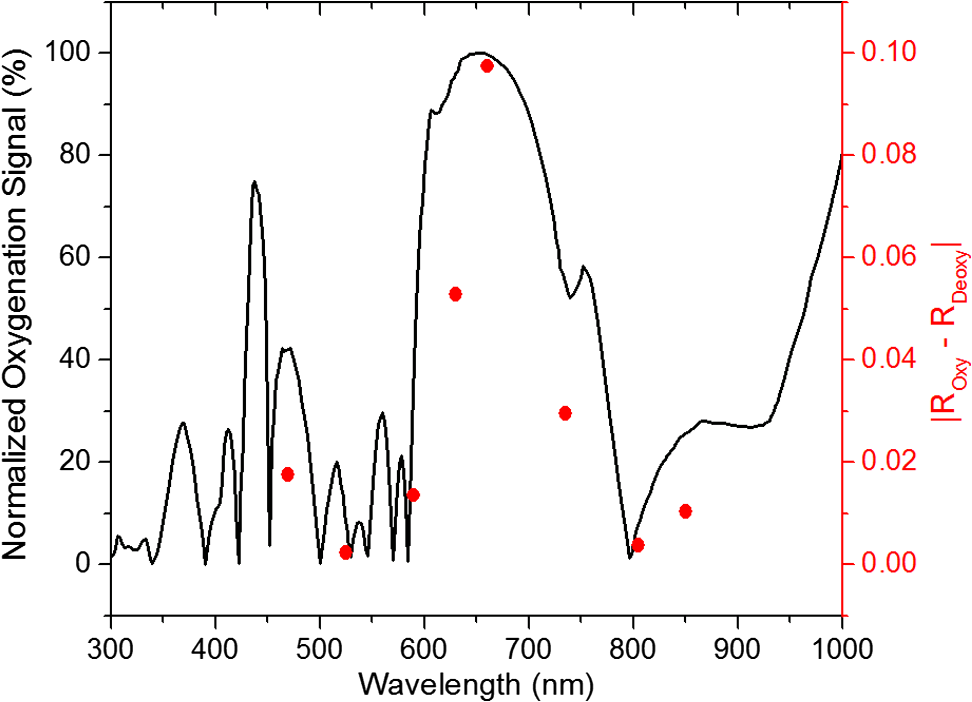 One possible issue in using the visible wavelengths is the narrowness of the oxygen sensitive bands which might pose a problem when using LEDs. To test that, the extinction coefficient of hemoglobin over the wavelength band of commercially available LEDs was integrated, and the ratio of extinction coefficient of oxy- and deoxy-hemoglobin over these bands for both the NIR and visible wavelengths were explored. This ratio shows the change in hemoglobin absorption coefficient with the change in its oxygenation state indicating whether or not a wavelength is sensitive to hemoglobin’s oxygen saturation levels. The specifications of the LEDs are based on the datasheets of Epitex LEDs (part # L470-30M32, L525-30T52, L590-35D32, and L660/735/805/940-40B42) and the full-width-half-maximum ranged between 14 and 45 nm. The results shown in Fig. 5 indicate that the 525 and 805-nm LEDs can both be considered as isobestic points, and their absorption coefficients are independent of the oxygenation level (ratio close to 1). The other wavelengths showed similar levels of change (40% to 80% change in optical properties) depending on the oxygenation state. The 470 and 940-nm wavelength bands are more sensitive to oxy-hemoglobin, while the 590 and 735-nm wavelength bands are more absorbed by deoxy-hemoglobin. 3.2.Penetration DepthThe simulation results presented in the previous section show that some visible wavelength bands (i.e., 470, 525, and 590 nm) carry enough perfusion and oxygenation information to be used in a PPG sensor. However, the simulation results do not answer the concerns about motion artifacts from the lumen of the intestine and adjacent tissue. To study the effects of motion, the mean penetration depth described in Eq. (3) was explored. As shown in Fig. 6, the mean penetration depth depends on the illumination wavelength and the source to detector separation. (A plot of mean penetration depth versus source to detector separation is provided in the Appendix.) There is a clear increase in the penetration depth when moving from visible to NIR wavelengths, and that is why this region of NIR is sometimes referred to as the therapeutic window. Note that even for a 16-mm separation, the mean penetration depth of NIR wavelength is still less than 3 mm. However, different photons penetrate to different depths in tissue, and the mean penetration depth is only the average and does not represent the maximum penetration of photons. Fig. 6Mean penetration depth for different source to detector separations as a function of wavelength. This caption shows the corresponding source to detector separation for each line (in case colors are not available, note that the caption is in the same order as the lines appear on the graph). 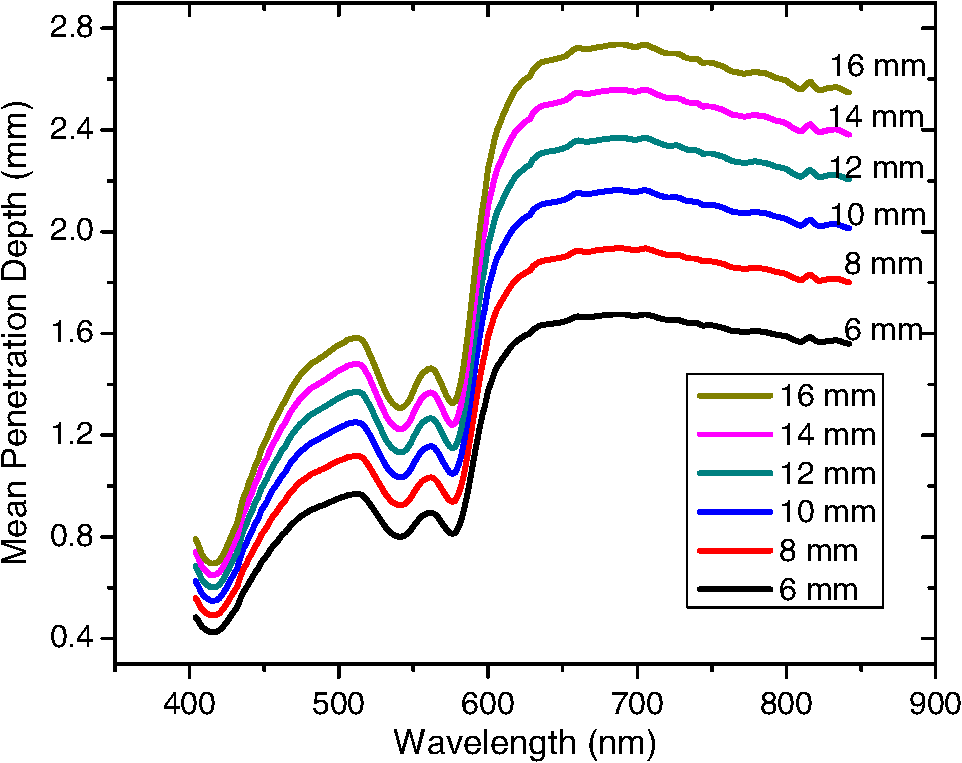 Although the mean penetration depth provides insight into the relationship between the penetration depth and the wavelengths and source to detector separation, it does not tell the full story. To assess the amount of light probing the background, the probability distribution of the penetration depth given by Eq. (4) is investigated. Below is an example of the probability distribution for the two studied isobestic points (525 and 805 nm). The mean wall thickness used for the human small intestine is 4 mm.35 This number varies across patients and even across different areas of the intestine of the same patient; however, the serosal side of the intestine is where perfusion should be monitored, and the penetration depth should be limited to around 3 mm. Anything past that limit is assumed to contribute to the background signal. The data in Fig. 7 show that approximately 25.25% of photons probe the background when using NIR wavelengths and a 16-mm separation. This can be reduced by either limiting the source to detector separation to for the NIR wavelengths or using visible wavelengths with separations up to 20 mm. As mentioned earlier, most NIR-based sensors utilize separations that are greater than 10 mm. Furthermore, if the sensor is utilizing regular LEDs and photodiodes, the average diameter of each is approximately 5 mm, which constrains the source to detector separation, measured from center-to-center, to 5 mm or more. Moving to the visible wavelengths gives more flexibility in the geometry of the probe. Fig. 7Probability density function of the photon penetration depth for the visible and NIR isobestic wavelengths (525 and 805 nm) for multiple source to detector separations. 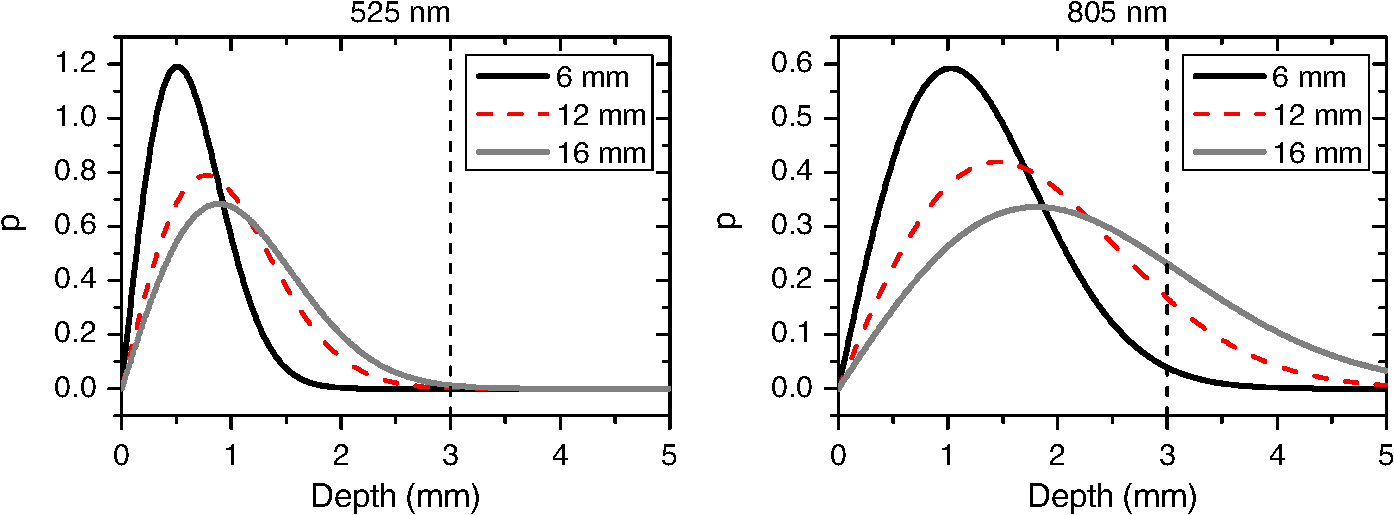 Figure 8 shows the transmittance and reflectance data from the MC simulation. Transmittance is the amount of light that was transmitted through the wall relative to the light that was incident on the tissue. It is 3 to 7 orders of magnitude lower for visible wavelengths compared with their NIR counterparts. Furthermore, this decrease in the transmittance does not reduce the reflectance substantially. The reflectance is the light intensity collected at the surface of the tissue relative to the intensity coming from the source. Fig. 8Transmittance (squares) and reflectance (dots) as a function of wavelength as calculated by MC simulations. Note that the -data is shown on a log scale. 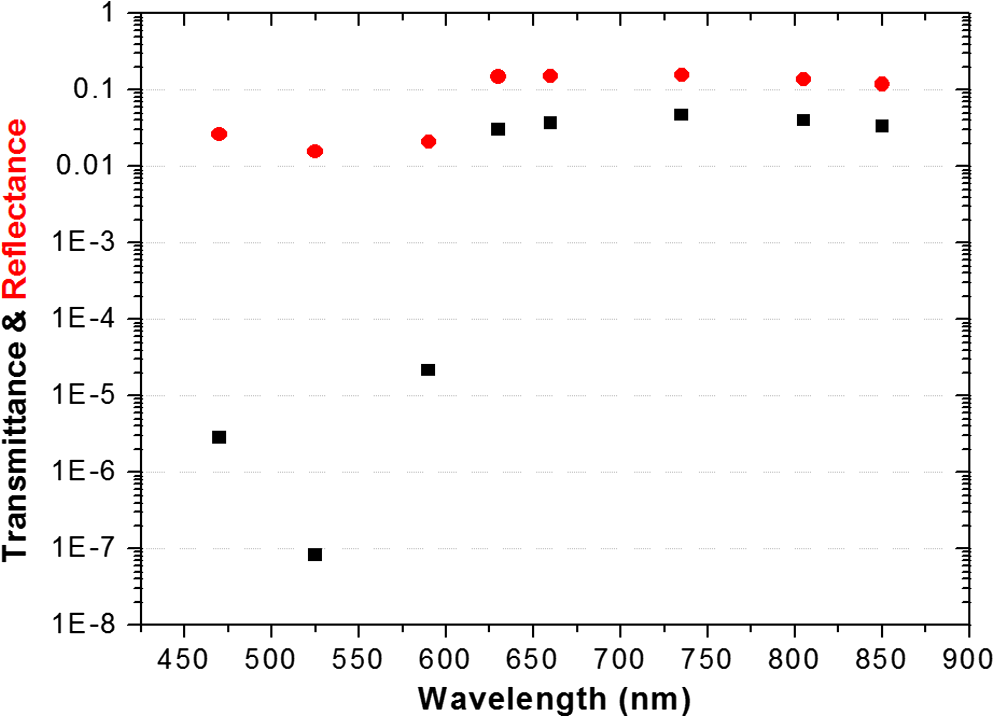 In summary, the modeling indicates that the visible wavelengths (470, 525, and 590 nm) have a better perfusion signal with similar oxygenation signal compared with their NIR counterparts. The green (525 nm) wavelength can be used as an isobestic point if needed. Moreover, all three visible wavelengths have similar perfusion signal levels and similar penetration depths. This is imperative to insure similar probing volumes and to avoid problems associated with perfusion heterogeneity that can lead to erroneous oxygenation results.27 In addition, at typical separation distances, NIR wavelengths penetrate through the wall of the intestine to probe its lumen and sometimes its neighboring tissue. This results in high background signals that can vary tremendously with motion artifact. In the following section, preliminary in vivo results are presented that validate and fortify these theoretical findings. 3.3.In Vivo Porcine StudyData was collected from the jejunum using two probes simultaneously. One of the probes had three NIR wavelengths (735, 805, and 940 nm), while the second probe had three visible wavelengths (470, 525, and 630 nm). As shown in the modeling results in the previous section, the red LED (630 nm) used in the visible probe for these experimental results was not optimal, since it would pick up a strong background. However, at the time of the study, the 590-nm LED was not available so the 630-nm LED was used as a reference, since it uses the same photodetector as the other visible wavelengths and is probing the same tissue. Figure 9 shows the time domain PPG waveform collected on each of the wavelengths (on right) and the corresponding fast Fourier transform (FFT) (on left). Three peaks can be seen in the spectra: (1) 0.25 Hz which corresponds to the respiratory rate (), (2) 2.18 Hz corresponding to the cardiac cycle peak (), and (3) 3.95 Hz that corresponds to a nonthermoregulatory shivering motion. Note that the body temperature was closely monitored and controlled throughout the study. Multiple reports discuss the nonthermoregulatory shivering, which is common in an anesthetized animal but still not completely understood.48,49 This high-frequency motion peak was slightly shifted on the NIR probe (4.61 Hz) compared with the VIS probe (3.95 Hz), which might be due to the different wavelengths probing different locations or different depths. Fig. 9The time domain (right column) PPG signal collected in vivo and the corresponding fast Fourier transform (FFT) spectrum (left column) for VIS and NIR wavelengths. In Fig. 14 in the Appendix, the 1 to 5-Hz region is zoomed in showing the cardiac cycle and high-frequency motion peaks. 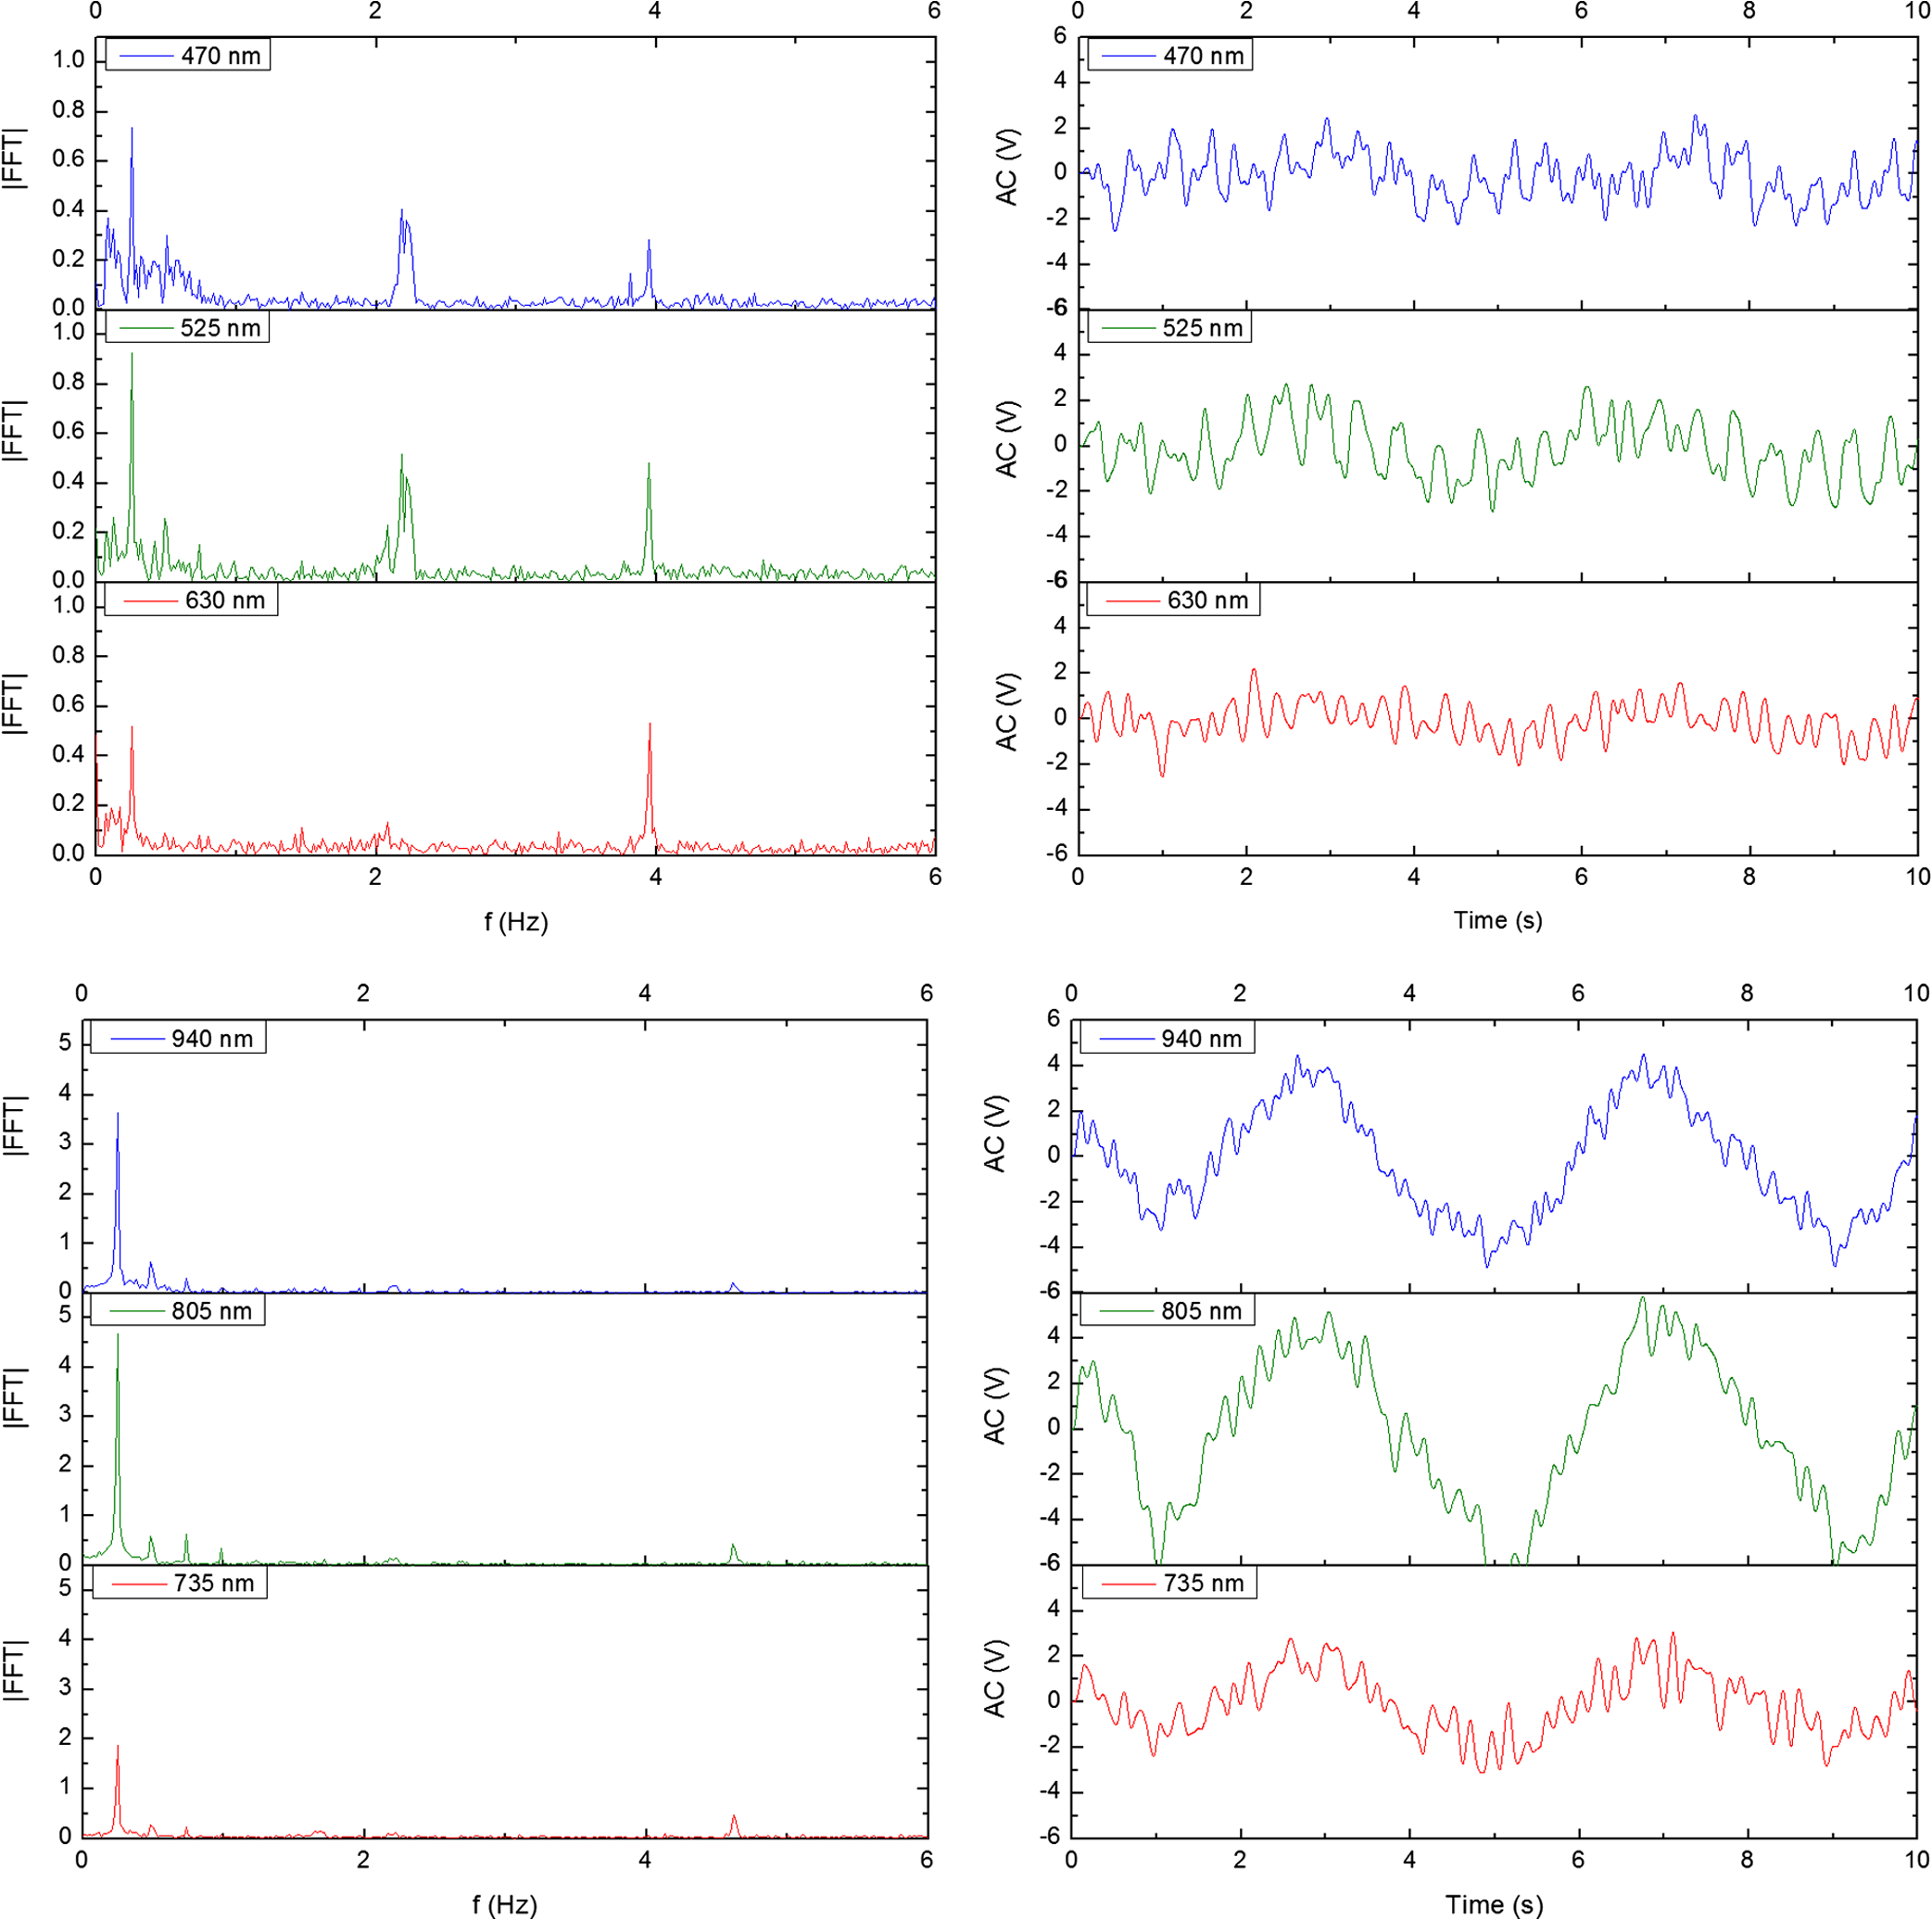 In Fig. 9, it was shown that the NIR wavelengths have a much greater background at low frequency. In addition, the cardiac cycle peak, which carries information about arterial blood, is higher for the visible wavelengths (see zoomed in 1 to 5-Hz range in Fig. 14 in the Appendix). These findings indicate that the visible wavelengths have higher blood signal and lower background levels and verify the modeling from the previous section. To quantify the signal-to-background enhancement, the ratio from these spectra is plotted, as shown in Fig. 10. The signal-to-background ratio is defined as the ratio of the cardiac cycle peak to the highest background frequency component above 0.15 Hz (DC excluded). Compared with the signal-to-background ratio from the MC simulations (red dots), it can be seen that both quantities follow the same trend and show a better performance for the visible wavelength range compared with the traditional NIR wavelength range. Note that the MC simulations assumed monochromatic sources, while the in vivo data were collected with LEDs that had a bandwidth [full-width half-maximum (FWHM) to 45 nm]. This accounts for some of the discrepancy in the results for the 630-nm wavelength that falls on the tail of the decaying SBR graph. The LED data show a higher SBR for that wavelength compared with the model, in part because it is integrating over that tail. Fig. 10The signal-to-background ratio from the in vivo porcine data (black squares) compared with the MC simulations results (red dots). 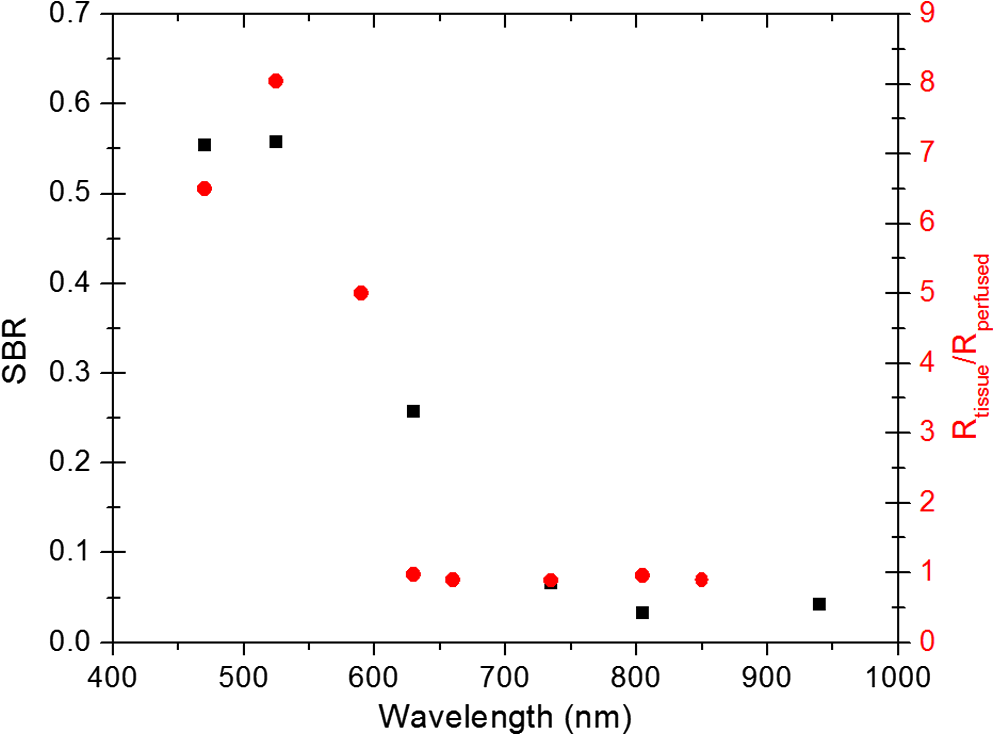 To verify that the cardiac cycle peak is not motion artifact and is in fact probing the microvasculature, the part of the small intestine that had the optical probes was occluded for short periods of time (). The probes recorded data continuously throughout the process (four occlusions and four baselines). The FFT was applied to a sliding window (25 s in width and shifted 10 s for every data point), and the cardiac cycle peak was detected using an automated program implemented in MATLAB (Mathworks, Inc.). The cardiac cycle peak was monitored during baseline and occlusion periods (Fig. 13, Appendix). Figure 11 shows the change in the peak amplitude due to the drop in perfusion during occlusions at the two visible wavelengths (470 and 525 nm). The data show that the peaks correlate well with perfusion changes and can discriminate the baseline and occlusion state (, two pair student -test). The goal of these studies was to assure that the detected signal was due to the microvasculature perfusion. In the future, the sensor will be optimized, and quantitative studies comparing its performance to other monitors (i.e., laser Doppler) will be conducted to assess the accuracy, sensitivity, and resolution of the sensor to perfusion and oxygenation changes. The inspired oxygen level was maintained constant during these studies. The modulation ratio () was calculated using the data from the two visible wavelengths (470 and 525 nm), as shown in Fig. 13 in the Appendix. Fig. 11In vivo porcine occlusion study data. (a) The change in time of the FFT peak on the two wavelengths of interest. The gray areas correspond to the occlusion periods. (b) The average of the FFT peaks during baseline and occlusion periods.  The findings presented in this paper can be applied to other cases where limited penetration depth is desired. One example is monitoring skin oxygenation and perfusion, which is of interest in cases such as wound healing and critical limb ischemia.50,51 As discussed earlier, current perfusion and oxygenation systems are optimized to probe relatively deep tissue and when sensors are applied to the skin, the collected signal is mainly probing muscle vasculature and reflects muscle rather than skin hemodynamics, which is a desired property when studying muscle physiology.29,52,53 The reported findings can be applied to measure skin perfusion and oxygenation changes for the aforementioned applications or can be coupled with NIRS measurements of muscle hemodynamics to correct small variations in the muscle signal due to skin perfusion. 4.ConclusionsIn this work, the use of a custom PPG sensing system using both visible and NIR wavelengths was modeled and measured for using as an intestinal perfusion and oxygenation sensor. This type of sensing system, once optimized and reduced in size, could be a critical improvement for monitoring trauma patients during resuscitation. By modeling the signal in the visible wavelength range (i.e., 470, 525, and 590 nm), it was shown that the perfusion signal could be increased and the background signal could be reduced, while keeping the same levels of oxygenation sensitivity as traditional NIR sensors. In addition, it was shown that by using small source to detector separations (6 mm or less), the background signals collected from the lumen of the intestine and/or surrounding tissue can be decreased by limiting the probing depth. These findings were confirmed in an in vivo porcine study by comparing NIR and VIS LED-based probes. VIS wavelengths had a higher signal-to-background ratio than NIR wavelengths. In addition, we used the sensor to monitor perfusion changes during in vivo occlusion studies and showed that the signal correlates with the perfusion state. AcknowledgmentsThis research was funded by a bioengineering research partnership (BRP) grant from NIH (#5R01-GM077150). AppendicesAppendixAccording to the Beer–Lambert law, the collected intensity on the surface of the tissue can be expressed in a simplified case by the following equation: Diffuse reflectance is the ratio of the collected light at the surface of the tissue () to the light from the light source () in whichA1.Oxygenation SignalTo look at the oxygenation signal, the ratio of the diffuse reflectance is considered in the cases where tissue is perfused with oxygenated and deoxygenated blood. These two cases represent the extreme in oxygenation changes and can be used to study the dynamic range of oxygenation changes which correlates to the sensitivity of the sensor. This quantity can be positive or negative depending on the wavelength used. The oxygenation signal is defined as the absolute value of this quantity, in order to have a comparison of the sensitivity across the spectrum without being affected by the direction of change in the signal. The above equation corresponds to Eq. (1). This equation makes the assumption that the optical pathlength does not change between the cases of oxygenated and deoxygenated blood perfusion. Although this is not exactly true, it can be used as a simplified theory to guide the more accurate MC models. A2.Perfusion SignalSimilar to the derivation of the oxygenation signal, the diffuse reflectance ratio of the ischemic tissue () to the normally perfused tissue can be defined. In ischemic tissue, there is no blood and . In normally perfused tissue, blood constitutes 12% of the total volume, and thus, and the signal-to-background is Assuming that the product of the chromophores concentration and the pathlength stays the same, the SBR can be reduced to Although these equations have many assumptions, for this article they were adequate to build hypotheses that were verified through the more accurate MC simulations and in vivo data. A3.Mean Penetration DepthIn the article, the change in the mean penetration depth was shown as a function of wavelength for multiple source to detector separations (Fig. 6). In Fig. 12, the mean penetration depth versus source to detector separation for multiple wavelengths is shown. Data in this figure were generated using Eq. (3) based on the work of Weiss et al.41 A4.In Vivo DataThe modulation ratio () was calculated using the equation below. This ratio is typically used in pulse oximetry to measure oxygen saturation changes. In this study, the inhaled oxygen levels were maintained constant, and we did not expect any significant changes in oxygen saturation levels. The modulation ratio was measured to see how stable the signal was. Figure 13 shows the modulation ratio as a function of time and the detected heart rate for the two wavelengths (470 and 525 nm). The modulation ratio shows a stable level during baseline indicating stable oxygenation levels. During the occlusions, the modulation ratio shows an increase which can indicate an increase in oxygenation. However, the pulse almost disappeared during these occlusions, which sometimes leads to erroneous oxygenation and heart rate data. Fig. 13Heart rate (a) and modulation ratio (b) measured from the visible wavelengths data. The gray segments indicate the occlusion periods during which the monitored section of the intestine was clamped. 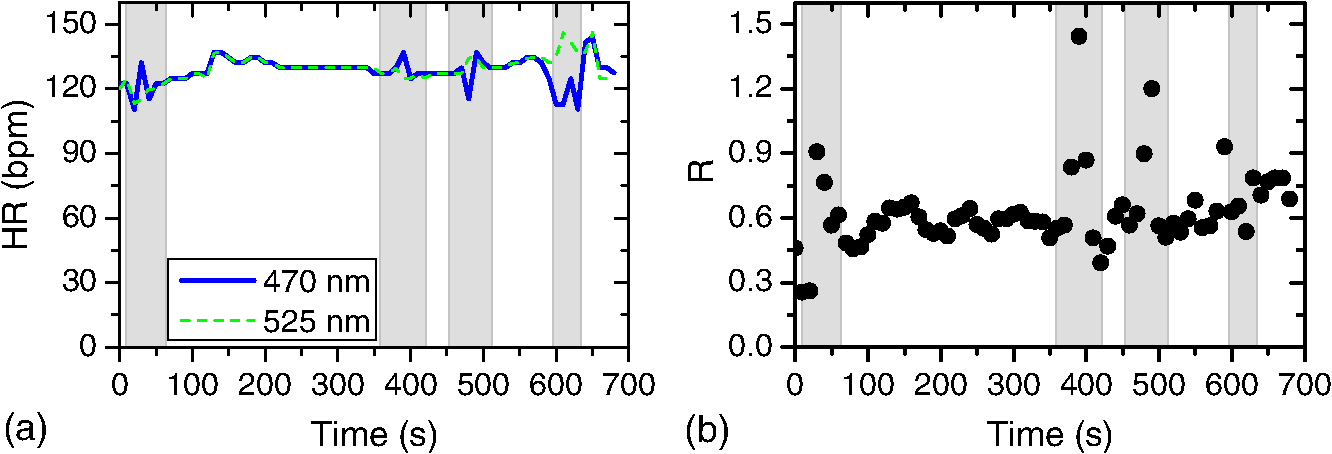 Due to the high amplitude of the noise peak on the NIR wavelengths, it is difficult to visualize the cardiac cycle peak and the high frequency motion in the spectra of Fig. 9. Figure 14 shows the 1- to 5-Hz range of the spectra for comparison of the signal peaks. It can be seen that the cardiac cycle peak is four to five times higher on the visible wavelengths (470 and 525 nm) compared with the NIR wavelengths. References, Injury in the United States: 2007 Chartbook,
(2013) www.cdc.gov/traumacare January 2013). Google Scholar
Injuries and Violence: The Facts, World Health Organization, Geneva
(2010). Google Scholar
S. A. Tishermanet al.,
“Clinical practice guideline: endpoints of resuscitation,”
J. Trauma, 57
(4), 898
–912
(2004). http://dx.doi.org/10.1097/01.TA.0000133577.25793.E5 JOTRA5 0022-5282 Google Scholar
C. A. FriesM. J. Midwinter,
“Trauma resuscitation and damage control surgery,”
Surgery (Oxford), 28
(11), 563
–567
(2010). http://dx.doi.org/10.1016/j.mpsur.2010.08.002 0263-9319 Google Scholar
S. M. Cohnet al.,
“Tissue oxygen saturation predicts the development of organ dysfunction during traumatic shock resuscitation,”
J. Trauma, 62
(1), 44
–54
(2007). http://dx.doi.org/10.1097/TA.0b013e31802eb817 JOTRA5 0022-5282 Google Scholar
R. S. Lanzmanet al.,
“Quantification of renal allograft perfusion using arterial spin labeling MRI: initial results,”
Eur. Radiol., 20
(6), 1485
–1491
(2010). http://dx.doi.org/10.1007/s00330-009-1675-0 0938-7994 Google Scholar
T. Hamaokaet al.,
“Near-infrared spectroscopy/imaging for monitoring muscle oxygenation and oxidative metabolism in healthy and diseased humans,”
J. Biomed. Opt., 12
(6), 062105
(2007). http://dx.doi.org/10.1117/1.2805437 JBOPFO 1083-3668 Google Scholar
M. Nogawaet al.,
“Development of a tissue oxygen consumption measurement method based on near-infrared photoplethysmography,”
in Conf. Proc. IEEE Eng. Med. Biol. Soc.,
2227
–2230
(2004). Google Scholar
T. J. Aklet al.,
“Optimizing probe design for an implantable perfusion and oxygenation sensor,”
Biomed. Opt. Express, 2
(8), 2096
–2109
(2011). http://dx.doi.org/10.1364/BOE.2.002096 BOEICL 2156-7085 Google Scholar
M. N. Ericsonet al.,
“Implantable sensor for blood flow monitoring after transplant surgery,”
Minim. Invasive Ther. Allied Technol., 13
(2), 87
–94
(2004). http://dx.doi.org/10.1080/13645700410027866 1364-5706 Google Scholar
T. Aoyagi,
“Pulse oximetry: its invention, theory, and future,”
J. Anesth., 17
(4), 259
–266
(2003). http://dx.doi.org/10.1007/s00540-003-0192-6 0913-8668 Google Scholar
L. Gagnonet al.,
“Investigation of diffuse correlation spectroscopy in multi-layered media including the human head,”
Opt. Express, 16
(20), 15514
–15530
(2008). http://dx.doi.org/10.1364/OE.16.015514 OPEXFF 1094-4087 Google Scholar
A. Humeauet al.,
“Laser Doppler perfusion monitoring and imaging: novel approaches,”
Med. Biol. Eng. Comput., 45
(5), 421
–435
(2007). http://dx.doi.org/10.1007/s11517-007-0170-5 MBECDY 0140-0118 Google Scholar
H. F. BowmanT. A. Balasubramaniam,
“A new technique utilizing thermistor probes for the measurement of thermal properties of biomaterials,”
Cryobiology, 13
(5), 572
–580
(1976). http://dx.doi.org/10.1016/0011-2240(76)90150-4 CRYBAS 0011-2240 Google Scholar
M. B. Khotet al.,
“Thermal diffusion probe analysis of perfusion changes in vascular occlusions of rabbit pedicle flaps,”
Plast. Reconstr. Surg., 115
(4), 1103
–1109
(2005). http://dx.doi.org/10.1097/01.PRS.0000156546.45229.84 PRSUAS 0032-1052 Google Scholar
J. Laustsenet al.,
“Validation of a new transit time ultrasound flowmeter in man,”
Eur. J. Vasc. Endovasc. Surg., 12
(1), 91
–96
(1996). http://dx.doi.org/10.1016/S1078-5884(96)80282-6 1078-5884 Google Scholar
M. Friebelet al.,
“Influence of oxygen saturation on the optical scattering properties of human red blood cells in the spectral range 250 to 2000 nm,”
J. Biomed. Opt., 14
(3), 034001
(2009). http://dx.doi.org/10.1117/1.3127200 JBOPFO 1083-3668 Google Scholar
S. Prahl, Optical Absorption of Hemoglobin,
(2011) http://omlc.ogi.edu/spectra/hemoglobin January ). 2011). Google Scholar
R. Boushelet al.,
“Monitoring tissue oxygen availability with near infrared spectroscopy (NIRS) in health and disease,”
Scand. J. Med. Sci. Sports, 11
(4), 213
–222
(2001). http://dx.doi.org/10.1034/j.1600-0838.2001.110404.x SMSSEO Google Scholar
G. J. Beilmanet al.,
“Near-infrared spectroscopy measurement of regional tissue oxyhemoglobin saturation during hemorrhagic shock,”
Shock, 12
(3), 196
–200
(1999). http://dx.doi.org/10.1097/00024382-199909000-00005 SAGUAI 1073-2322 Google Scholar
M. FerrariV. Quaresima,
“A brief review on the history of human functional near-infrared spectroscopy (fNIRS) development and fields of application,”
NeuroImage, 63
(2), 921
–935
(2012). http://dx.doi.org/10.1016/j.neuroimage.2012.03.049 NEIMEF 1053-8119 Google Scholar
J. Allen,
“Photoplethysmography and its application in clinical physiological measurement,”
Physiol. Meas., 28
(3), R1
–R39
(2007). http://dx.doi.org/10.1088/0967-3334/28/3/R01 PMEAE3 0967-3334 Google Scholar
M. N. Ericsonet al.,
“Development of an implantable oximetry-based organ perfusion sensor,”
in Conf. Proc. IEEE Eng. Med. Biol. Soc.,
2235
–2238
(2004). Google Scholar
T. J. Aklet al.,
“In vitro performance of a perfusion and oxygenation optical sensor using a unique liver phantom,”
Proc. SPIE, 8229 822904
(2012). http://dx.doi.org/10.1117/12.908645 PSISDG 0277-786X Google Scholar
H. Subramanianet al.,
“Real-time separation of perfusion and oxygenation signals for an implantable sensor using adaptive filtering,”
IEEE Trans. Biomed. Eng., 52
(12), 2016
–2023
(2005). http://dx.doi.org/10.1109/TBME.2005.857667 IEBEAX 0018-9294 Google Scholar
M. Sandberget al.,
“Non-invasive monitoring of muscle blood perfusion by photoplethysmography: evaluation of a new application,”
Acta Physiol. Scand., 183
(4), 335
–343
(2005). http://dx.doi.org/10.1111/aps.2005.183.issue-4 APSCAX 0001-6772 Google Scholar
P. D. Mannheimeret al.,
“Wavelength selection for low-saturation pulse oximetry,”
IEEE Trans. Biomed. Eng., 44
(3), 148
–158
(1997). http://dx.doi.org/10.1109/10.554761 IEBEAX 0018-9294 Google Scholar
Y. YamashitaA. MakiH. Koizumi,
“Wavelength dependence of the precision of noninvasive optical measurement of oxy-, deoxy-, and total-hemoglobin concentration,”
Med. Phys., 28
(6), 1108
–1114
(2001). http://dx.doi.org/10.1118/1.1373401 MPHYA6 0094-2405 Google Scholar
M. FerrariL. MottolaV. Quaresima,
“Principles, techniques, and limitations of near infrared spectroscopy,”
Can. J. Appl. Physiol., 29
(4), 463
–487
(2004). http://dx.doi.org/10.1139/h04-031 CJAPEY 1066-7814 Google Scholar
M. Niwayamaet al.,
“Quantitative measurement of muscle hemoglobin oxygenation using near-infrared spectroscopy with correction for the influence of a subcutaneous fat layer,”
Rev. Sci. Instrum., 71
(12), 4571
–4575
(2000). http://dx.doi.org/10.1063/1.1322578 RSINAK 0034-6748 Google Scholar
C. PujaryM. SavageY. Mendelson,
“Photodetector size considerations in the design of a noninvasive reflectance pulse oximeter for telemedicine applications,”
in Proc. IEEE 29th Annual Northeast Bioengineering Conf.,
148
–149
(2003). Google Scholar
J. ReussD. Siker,
“The pulse in reflectance pulse oximetry: modeling and experimental studies,”
J. Clin. Monit. Comput., 18
(4), 289
–299
(2004). http://dx.doi.org/10.1007/s10877-005-2909-6 1387-1307 Google Scholar
L. B. Hiltebrandet al.,
“Dynamic study of the distribution of microcirculatory blood flow in multiple splanchnic organs in septic shock,”
Crit. Care Med., 28
(9), 3233
–3241
(2000). http://dx.doi.org/10.1097/00003246-200009000-00019 CCMDC7 0090-3493 Google Scholar
E. ChanT. MenovskyA. J. Welch,
“Effects of cryogenic grinding on soft-tissue optical properties,”
Appl. Opt., 35
(22), 4526
–4532
(1996). http://dx.doi.org/10.1364/AO.35.004526 APOPAI 0003-6935 Google Scholar
K. Johanssonet al.,
“Tissue penetration and measuring depth of laser Doppler flowmetry in the gastrointestinal application,”
Scand. J. Gastroenterol., 22
(9), 1081
–1088
(1987). http://dx.doi.org/10.3109/00365528708991962 SJGRA4 0036-5521 Google Scholar
C. De Feliceet al.,
“The pulse oximeter perfusion index as a predictor for high illness severity in neonates,”
Eur. J. Pediatr., 161
(10), 561
–562
(2002). http://dx.doi.org/10.1007/s00431-002-1042-5 EJPEDT 0340-6199 Google Scholar
M. Hickeyet al.,
“Measurement of splanchnic photoplethysmographic signals using a new reflectance fiber optic sensor,”
J. Biomed. Opt., 15
(2), 027012
(2010). http://dx.doi.org/10.1117/1.3374355 JBOPFO 1083-3668 Google Scholar
M. HickeyP. A. Kyriacou,
“Optimal spacing between transmitting and receiving optical fibres in reflectance pulse oximetry,”
J. Phys. Conf. Ser., 85
(1), 012030
(2007). http://dx.doi.org/10.1088/1742-6596/85/1/012030 1742-6588 Google Scholar
V. Kamat,
“Pulse oximetry,”
Indian J. Anaesth., 46
(4), 261
–268
(2002). IJANBN 0019-5049 Google Scholar
M. Y. ShamirA. AvramovichT. Smaka,
“The current status of continuous noninvasive measurement of total, carboxy, and methemoglobin concentration,”
Anesth. Analg., 114
(5), 972
–978
(2012). http://dx.doi.org/10.1213/ANE.0b013e318233041a 0003-2999 Google Scholar
G. H. WeissR. NossalR. F. Bonner,
“Statistics of penetration depth of photons re-emitted from irradiated tissue,”
J. Mod. Opt., 36
(3), 349
–359
(1989). http://dx.doi.org/10.1080/09500348914550381 JMOPEW 0950-0340 Google Scholar
L. H. WangS. L. JacquesL. Q. Zheng,
“MCML—Monte-Carlo modeling of light transport in multilayered tissues,”
Comput. Methods and Programs Biomed., 47
(2), 131
–146
(1995). http://dx.doi.org/10.1016/0169-2607(95)01640-F CMPBEK 0169-2607 Google Scholar
H. LiL. LinS. S. Xie,
“Refractive index of human whole blood with different types in the visible and near-infrared ranges,”
Proc. SPIE, 3914 517
–521
(2000). http://dx.doi.org/10.1117/12.388073 PSISDG 0277-786X Google Scholar
S. A. SkinnerP. E. O'Brien,
“The microvascular structure of the normal colon in rats and humans,”
J. Surg. Res., 61
(2), 482
–490
(1996). http://dx.doi.org/10.1006/jsre.1996.0151 JSGRA2 0022-4804 Google Scholar
T. J. Aklet al.,
“Optimizing source detector separation for an implantable perfusion and oxygenation sensor,”
Proc. SPIE, 7906 790605
(2011). http://dx.doi.org/10.1117/12.875731 PSISDG 0277-786X Google Scholar
T. J. Aklet al.,
“Performance assessment of an opto-fluidic phantom mimicking porcine liver parenchyma,”
J. Biomed. Opt., 17
(7), 077008
(2012). http://dx.doi.org/10.1117/1.JBO.17.7.077008 JBOPFO 1083-3668 Google Scholar
M. Ericsonet al.,
“A custom electronics platform for implantable perfusion sensor development,”
in Future of Instrumentation International Workshop (FIIW), 2011,
63
–66
(2011). Google Scholar
E. P. Hornet al.,
“Non-thermoregulatory shivering in patients recovering from isoflurane or desflurane anesthesia,”
Anesthesiology, 89
(4), 878
–886
(1998). http://dx.doi.org/10.1097/00000542-199810000-00012 ANESAV 0003-3022 Google Scholar
R. S. Pozoset al.,
“Human studies concerning thermal-induced shivering, postoperative “shivering,” and cold-induced vasodilation,”
Ann. Emerg. Med., 16
(9), 1037
–1041
(1987). http://dx.doi.org/10.1016/S0196-0644(87)80756-4 AEMED3 0196-0644 Google Scholar
J. J. Castronuovo Jr.et al.,
“Skin perfusion pressure measurement is valuable in the diagnosis of critical limb ischemia,”
J. Vasc. Surg., 26
(4), 629
–637
(1997). http://dx.doi.org/10.1016/S0741-5214(97)70062-4 0741-5214 Google Scholar
H. M. Aderaet al.,
“Prediction of amputation wound healing with skin perfusion pressure,”
J. Vasc. Surg., 21
(5), 823
–828
(1995). http://dx.doi.org/10.1016/S0741-5214(05)80014-X 0741-5214 Google Scholar
G. A. TewA. D. RuddockJ. M. Saxton,
“Skin blood flow differentially affects near-infrared spectroscopy-derived measures of muscle oxygen saturation and blood volume at rest and during dynamic leg exercise,”
Eur. J. Appl. Physiol., 110
(5), 1083
–1089
(2010). http://dx.doi.org/10.1007/s00421-010-1596-2 EJAPFN 1439-6319 Google Scholar
M. FerrariM. MuthalibV. Quaresima,
“The use of near-infrared spectroscopy in understanding skeletal muscle physiology: recent developments,”
Philos. Trans. R. Soc. A, 369
(1955), 4577
–4590
(2011). http://dx.doi.org/10.1098/rsta.2011.0230 PTRMAD 1364-503X Google Scholar
|
|||||||||||||||||||||||||||||||||||||||||||||||||||||||||||||||||||||||||||||||||||||||||||||||||||