|
|
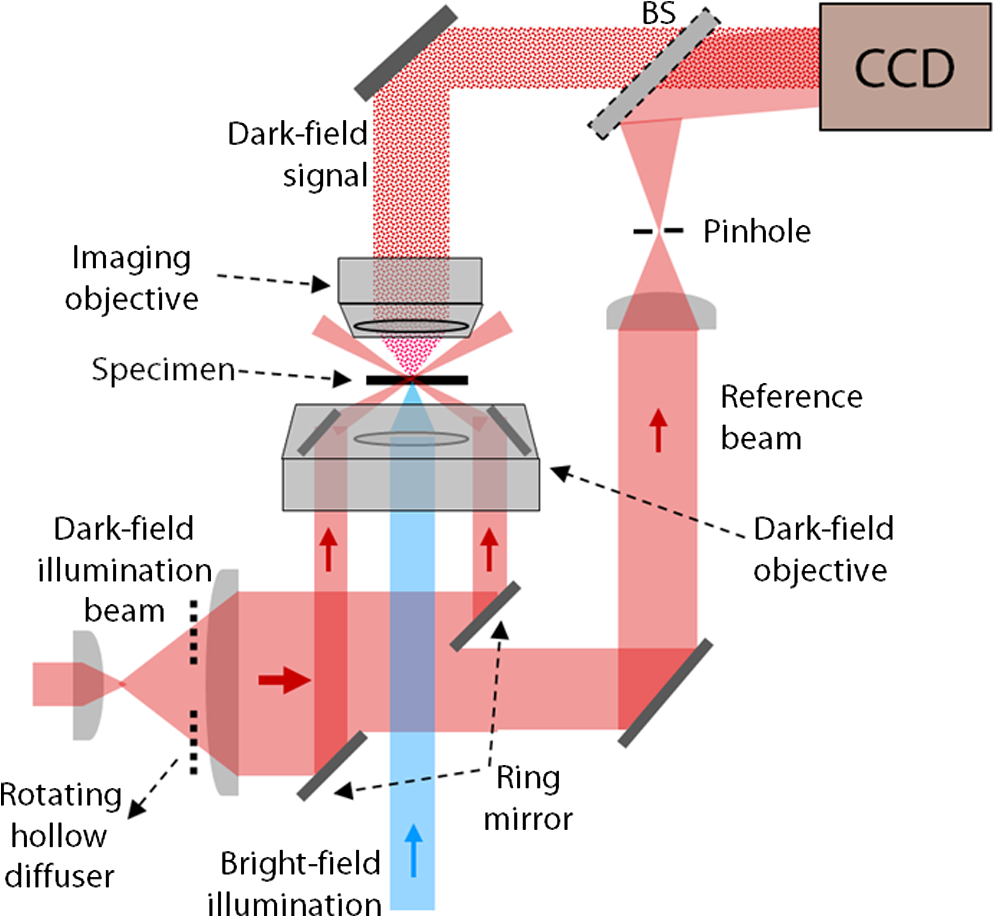
1.IntroductionImaging through various layers of a biological specimen is a demanding technology in the field of biology and biomedicine. Many improvements have been done using scanning fluorescence techniques for three-dimensional (3-D) imaging of micro- and sub-millimeter organisms. Confocal fluorescence microscopy has been shown to be promising in creating a 3-D image of a specimen using point by point scanning through different stacks of the specimen.1 Other scanning techniques like 4pi microscopy,2 stimulated emission depletion microscopy3 and structured illumination microscopy4 have been developed to improve the lateral and/or axial resolution in cellular fluorescence microscopy. Different imaging approaches, like selective plane illumination microscopy5 and double-sided plane illumination6 were aimed at imaging larger organisms. Although these fluorescence methods have enhanced the resolution, they have some limitations, like being able to image only stained particles inside the organism. To investigate biological samples for which no marker or dye is introduced, or staining is not of interest for the given investigation, some label-free 3-D microscopy methods have been developed based on auto-fluorescence or scattering properties, like optical projection tomography7 and spontaneous Raman scattering.8 However, either the weak auto-fluorescence for different materials or the presence of pump background reduces the contrast in these methods. In coherent anti-Stokes Raman scattering microscopy,9 the signal yield is a few orders of magnitude higher than what can be obtained through the spontaneous Raman scattering process and it is also possible to remove the background using stimulated Raman scattering.10 Later on, the technique was improved by Ozeki et al.11 and made it possible to record high contrast 3-D images of cells. Dark-field microscopy was also shown to be an effective approach in contrast and resolution enhancement.12 Lee et al. took advantage of this approach and combined it with optical sectioning microscopy to achieve a high contrast 3-D image of a biological specimen.13 The dark-field approach was also shown to be promising in the contrast enhancement in optical coherence microscopy by suppressing low spatial frequencies and increasing the signal for high spatial frequencies.14 Nevertheless, like the fluorescence techniques, the mentioned 3-D methods need to scan over the sample, which makes them impractical in imaging many dynamic processes and moving organisms. Being a scan-less and also a label-free technique, digital holographic microscopy (DHM) can be used to extract the 3-D information of the organism using a single image (digital hologram).15–17 In this technique, the quantitative phase and amplitude information of the object wave-front can be digitally obtained along the depth of the object from the recorded hologram, which makes it possible to digitally focus on different layers of the specimen any time later and reconstruct a 3-D profile of the optical thickness of the organism using the quantitative phase value.18–20 A short-coherence light source21–23 and the spatial coherence effect24 have been utilized to reduce the coherent noise and improve the image contrast. Park et al. showed that the contrast can be enhanced in DHM using speckle-field illumination.25 Dubois et al.26 and Verpillat et al. 27 both implemented dark-field approach in a digital holographic system to image and track nanoparticles. Because of having no background in dark-field imaging, the noise coming from the coherent light in the background is suppressed, leading to a significant contrast enhancement. Unlike imaging nanoparticles, due to the speckle noise coming from the scattered light, performing dark-field DHM for imaging larger organisms seems to be challenging. In this paper, we present an imaging system utilizing various speckle-fields to overcome the speckle noise and enhance the contrast. Employing the presented system, a multilayer imaging of the organism has been performed without scanning the specimen using digital refocusing. Adult sea urchins of the species Arbacia lixula have been selected as a sample organism.28 The samples have been provided by the Institute for Zoology at the University of Stuttgart.29 To avoid movement of the larvae for the current investigation, they were fixed first with formaldehyde and then immersed in water. 2.Method2.1.Dark-Field MicroscopyTo achieve a high contrast image of the specimen, a dark-field approach has been utilized. Generally, in dark-field microscopy, the specimen is illuminated with a hollow cone of light and therefore, the zero diffraction order, which falls out of the view of the imaging objective, is absent in the image, leading to a dark background. Hence, the highly diffracted orders, being scattered from the fine structures of the specimen, make the main contribution in the image formation (Fig. 1). Collecting only the high diffraction orders, the system delivers a higher resolution. On the other hand, due to the absence of the bright background, the small structures are visible with an enhanced contrast. 2.2.Speckle-Field IlluminationIn spite of transferring high spatial frequency, the scattered light creates a strong speckle noise in the case of using a coherent source for illumination. The created speckle pattern reduces the image quality and the high frequency information will be lost in the image. Therefore, implementing the dark-field approach in a coherent microscopic system seems to be challenging. We took advantage of the speckle noise itself to improve the image contrast. In this method, instead of using a uniform spot for illumination, the specimen is illuminated with a speckle-field (the experimental setup is illustrated in detail in the following subsection). Figure 2 represents the images of a given sea urchin larva recorded with different illumination conditions. A bright-field image of the larva is shown in Fig. 2(a), illuminated by a short coherence source (55 μm) with a wavelength of 405 nm. Figure 2(b) was obtained by illuminating the larva with the same light source as Fig. 2(a), but with 200 different speckle-fields and by averaging over the fields. Although a short coherence source has been utilized, Fig. 2(a) still suffers from the presence of coherence noise, which can be improved using a speckle-field illumination approach [Fig. 2(b)]. Figure 2(c) represents a dark-field image of the same larva illuminated by a 660 nm laser diode with a coherence length of . Due to the long coherence length, the speckle noise is dominant in the image, which is apparent in the enlarged section of Fig. 2(c). For the image shown in Fig. 2(d), the larva was illuminated in the dark-field mode with 200 speckle-fields and the final image has been derived by averaging over the fields. In the enlarged section of Figs. 2(c) and 2(d), one can clearly realize the contrast enhancement after illuminating with and averaging over various speckle-fields. Fig. 2(a) Bright-field image of a sea urchin larva illuminated by a short coherence source (405 nm). (b) The bright-field image obtained by illuminating the larva with 200 different speckle-fields and averaging over the fields. (c) The dark-field image of the same larva illuminated by a 660 nm laser diode. (d) The dark-field image taken after averaging over 200 speckle-field illuminations. The images are taken by a bright/dark-field objective (, ).  2.3.Dark-Field Digital Holographic SetupFigure 3 represents a schematic of the dark-field digital holographic microscope. For dark-field illumination, a Nikon bright/dark-field objective with the magnification of and the numerical aperture of 0.45 has been utilized. The objective has the ability to operate both in dark-field and bright-field modes. An off-axis holographic setup has been arranged for the experiment. The blue colored (in the online version) beam path shows the capability of bright-field holographic microscopy. For simplicity, the reference beam path is only shown for the dark-field mode in the scheme. The illumination beam is redirected toward the dark-field objective using a ring-shaped mirror. The portion of the beam which passes through the center of the ring mirror is used as the reference beam. A pinhole is placed in the reference path to create a uniform reference wavefront. A laser diode with the wavelength of 660 nm has been selected for the dark-field illumination, as the biological tissue has a relatively higher scattering rate in this region of the visible spectrum. A short coherence (55 μm) laser diode operating at 405 nm was used for the bright-field mode. A SVCam-ECO charged coupled devices camera (SVS-VISTEK GmbH, Seefeld, Germany) with the pixel size of () and the maximum frame rate of 10 fps captured the holograms. To create a speckle-field, a diffuser was placed in the dark-field illumination path. The diffuser was being rotated by a stepper motor to produce different fields for each capturing shot. A hole in the middle of the diffuser allows the passage of the central portion of the beam that goes to the reference path, without being altered by the diffuser. 3.Results and Discussion3.1.Image ReconstructionA dark-field hologram of a larva is shown in Fig. 4(a); the interference fringes can be seen in the magnified inset image. This hologram was taken using a single speckle-field illumination. An angular spectrum algorithm has been used to perform image reconstruction and digital refocusing.30 Figure 4(b) shows the Fourier transform (FT) of the given hologram. One of the lobes of the first-order FT was selected (highlighted by a square) to reconstruct the intensity image [Fig. 4(c)]. Because of using the diffuser, the specimen has a random phase distribution and due to the dark background, the rest of the image shows a noisy phase distribution [Fig. 4(d)]. In addition, because of the nature of dark-field microscopy (i.e., having no light without any specimen), it is not possible to take a reference hologram and compensate for the phase contribution of the optical elements. As a result, the derived phase does not provide us with valuable quantitative information and is only used for wave-front propagation and digital focusing. To extract the 3-D profile (optical thickness) of the specimen from the phase distribution, the bright-field mode can be used. The bright-field hologram of the larva and the reconstructed phase distribution are shown in Figs. 4(e) and 4(f), respectively. Fig. 4(a) A dark-field hologram of a sea urchin larva taken using a single speckle-field illumination and, (b) its Fourier transform. (c) The reconstructed dark-field intensity and, (d) phase image. (e) A bright-field hologram of the same larva and, (f) the corresponding phase distribution. The inset figures in (a) and (e) shows the magnified fringe patterns in the given hologram.  3.2.Optimal Number of Speckle Fields for Real-Time ImagingAs previously mentioned, several holograms should be captured using different speckle fields to reconstruct a high contrast intensity image. To be able to apply the technique for the imaging of living organisms, the optimal number of speckle-fields that is required to achieve a desired contrast has been evaluated. For this purpose, 100 holograms have been recorded for a given larva and the correlation between images, obtained by averaging over the different number of speckle-fields, have been plotted in two different ways. In the first case, the correlation between the image obtained from 100 speckle-fields, and the image obtained from number of fields, has been plotted [Fig. 5(a)]. From the inset figure of the plot, it can be seen that images obtained using more than 60 speckle fields have a correlation factor of more than 0.99 with the image derived from 100 fields. For the second case, the correlation between the image obtained from and () speckle-fields has been plotted [Fig. 5(b)]. After the 30th averaging, the correlation factor seems to follow a flat trend and, as shown in the inset figure, for 60 speckle-fields it reaches a value of 0.9996. It should be noted that to obtain a more accurate value of the correlation factor, the dark background of the images in which the specimen has no contribution, has been eliminated in the calculation. Otherwise, unrealistically high correlation factors would be obtained. Fig. 5(a) Correlation between the images, obtained using speckle-field illuminations, and the image, obtained using 100 speckle-fields. (b) Correlation between the images, obtained using speckle-field illuminations, and the images, obtained using speckle-fields. For each case, the inset figure represents a magnified appearance of the data for . 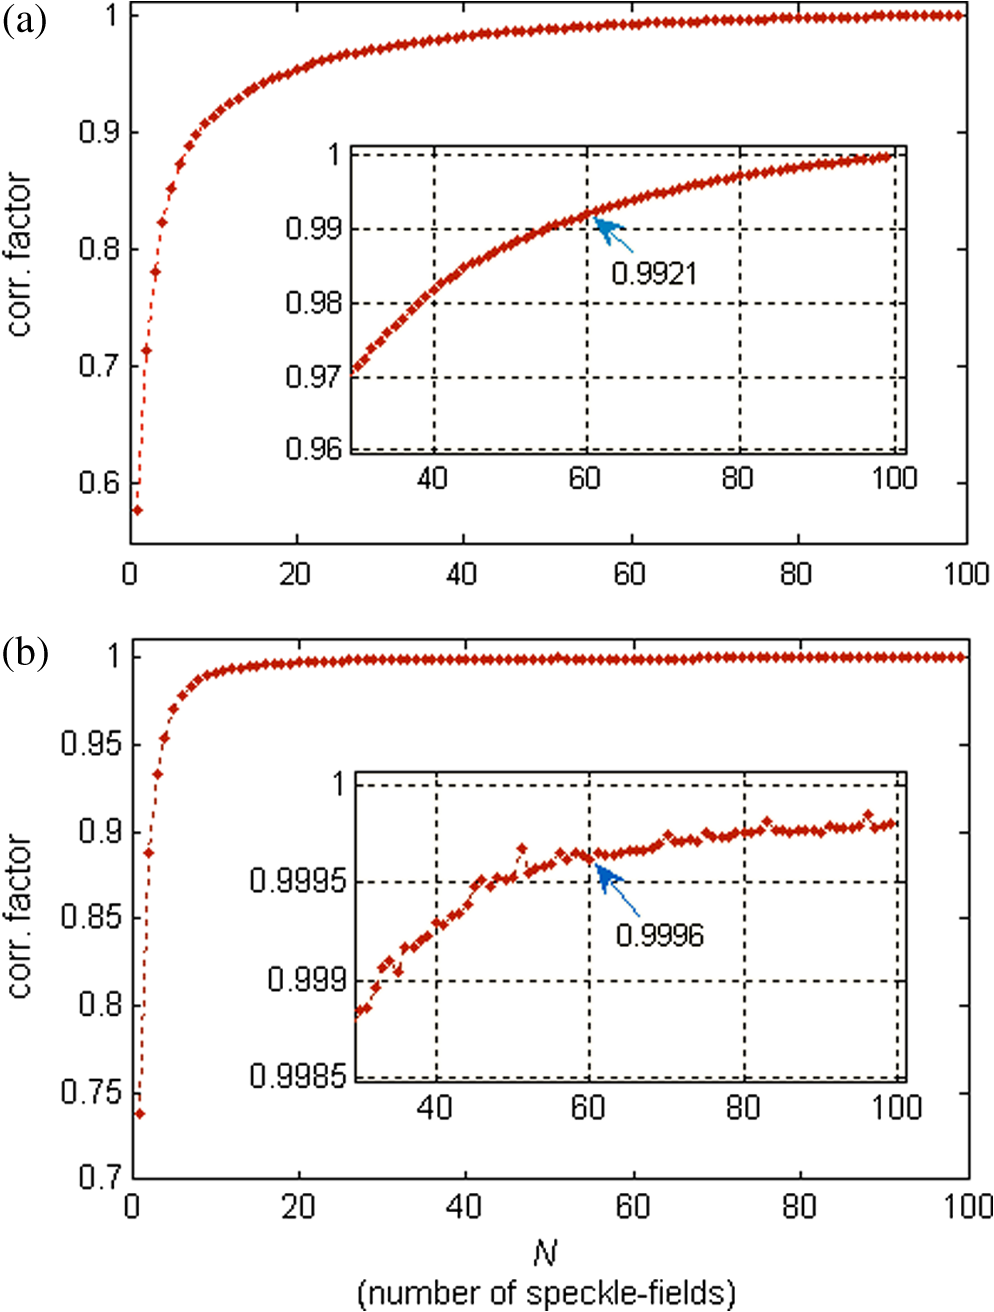 To better demonstrate the resolution and contrast enhancement, a negative United States Air Force (USAF) test target has been utilized and the corresponding images have been presented in Fig. 6(a). The finest structure of the target, which is highlighted and magnified in the figure, has a resolution of . The magnified subimages, placed below the main image, were obtained by averaging over a different number of speckle-fields, indicated below each subimage. The subimages demonstrate how the image quality improves by increasing the number of speckle-fields in terms of resolution, especially compared to the case of using uniform dark-field coherent illumination [first subimage from left in Fig. 6(a)]. Summing over a given number of speckle-fields, the speckle contrast, , and the signal-to-noise ratio, , have been expressed by Goodman31 as, in which is the variance and is the mean value of the total intensity. The plot, shown in Fig. 6(b), represents and versus the number of speckle-fields, , which has been calculated for the image shown in Fig. 6(a).Fig. 6(a) The image of a negative USAF test target. The finest structure of the target, which is highlighted and magnified in the subimages, has a resolution of . The magnified subimages, were obtained by averaging over different number of speckle-fields, indicated below each subimage (SF: speckle-fields); including the image taken with normal illumination and introducing no speckle-field (first subimage from bottom-left). (b) The plot shows the improvement of the signal-to-noise ratio, , (right axis) and the reduction of speckle contrast, , (left axis) by increasing the number of averaging speckle fields, , which has been calculated for the given USAF target.  To perform real-time imaging, the number of required holograms should be adapted to the movement speed of the specimen and the desired signal-to-noise ratio. Based on correlation factor and calculations, an optimal number of 60 speckle-fields or more is suggested to achieve a desirably high contrast. However, referring to Fig. 6, a fewer number of speckle-fields may be selected if the corresponding resolution and satisfies the requirement for a specific purpose of study. Selecting the given number of speckle-fields, , the minimum required time to capture these holograms is limited to the frame rate of the camera, fps, by . 3.3.Digital FocusingDue to the variant phase distribution of the diffuser for each speckle-field, the fringe pattern is different in each hologram. Therefore, it is not possible to combine all holograms at first and then perform the image reconstruction using a coherently superimposed hologram. Thus, each hologram should be analyzed separately and the corresponding intensity image should be reconstructed. The final image will be obtained by incoherent averaging over the reconstructed images. Figure 7 shows the superimposed reconstructed intensity image of the larva for different focus planes, illuminated using 60 speckle-fields. Video 1 represents the digital refocusing process for this larva. In the video, the reconstructed images were obtained from 60 speckle-fields. Sequential frames have been reconstructed by propagating the wavefront for 1 mm for each frame toward infinity. The parameter in the video represents the axial position of the object plane relative to the initially focused plane for which the hologram has been recorded. A thin lens equation has been applied to calculate the axial position. The axial separation between the frames is limited to the depth of focus of the utilized objective (1.6 μm, according to the manufacturer information), meaning that the object layers within this distance are all in focus on the camera plane and the separation of the layers cannot be distinguished. Figure 8 and Video 2 show another two neighboring larvae in the same medium. Like Fig. 7, this figure also represents different focus planes for the given larvae. It can be seen that in each subfigure, different parts of the larva skeleton, along with the internal structure of the specimen, is in focus that results in more accurate 3-D information of the skeleton. Fig. 7Different focus planes for a larva with the axial position of (a) 19.9 μm, (b) 9.65 μm, (c) , and (d) relative to the plane for which the hologram has been recorded. The intensity images have reconstructed using 60 sequential holograms, taken with different speckle-field illuminations.  Fig. 8Different focus planes for two neighboring larvae with the axial position of (a) , (b) , (c) , and (d) relative to the plane for which the hologram has been recorded. The intensity images have reconstructed using 60 sequential holograms, taken with different speckle-field illuminations.  Video 1The video shows the digital refocusing process for a sea urchin larva immersed in water. The parameter in the video represents the axial position of the object plane relative to the initially focused plane for which the hologram has been recorded (1.4 MB, MPG) [URL: http://dx.doi.org/10.1117/1.JBO.18.8.086009.1].  Video 2The video shows the digital refocusing process for two neighboring sea urchin larvae immersed in water. The parameter in the video represents the axial position of the object plane relative to the initially focused plane for which the hologram has been recorded (1.9 MB, MPG) [URL: http://dx.doi.org/10.1117/1.JBO.18.8.086009.2].  4.ConclusionIn summary, we introduced a scan-less multilayer imaging of a biological organism. The high contrast images have been obtained by implementing a dark-field approach in a digital holographic microscope. The speckle noise has been removed by acquiring sequential holograms with various speckle-fields and incoherently superimposing the final reconstructed images. The presented speckle-field illumination technique has been shown to be practical in regaining the contrast, which is achievable in conventional dark-field microscopy. The 3-D information of the organism was extracted without moving the specimen or performing any other mechanical scanning, by only capturing sequential holograms and performing digital refocusing. The imaging process can be performed in a short time, utilizing a high speed camera that provides researchers with the opportunity to image all layers of a live specimen without being required to fix it, making it possible to investigate internal structural interactions and to track particles inside the organism with a high contrast. Unlike fluorescence or optical sectioning techniques, the out-of-focus planes of the specimen introduce a background and we are continuing our investigation by designing an opposed-view dark-field DHM system to derive more accurate 3-D information of the specimen and developing an algorithm to remove the background imposed by the out-of-focus planes. AcknowledgmentsThe authors would like to acknowledge the support of the DFG-Deutsche Forschungsgemeinschaft (German Research Foundation) under grant No. OS 111/33-1. The authors would like to gratefully acknowledge Ms. Julia Maxi Kanold and Prof. Franz Brümmer at the Department of Zoology, Biological Institute, University of Stuttgart, to provide the biological samples. ReferencesHandbook of Biological Confocal Microscopy, Springer, Berlin
(2006). Google Scholar
K. BahlmannS. JakobsS. W. Hell,
“4Pi-confocal microscopy of live cells ultramicroscopy,”
Ultramicroscopy, 87
(3), 155
–164
(2001). http://dx.doi.org/10.1016/S0304-3991(00)00092-9 ULTRD6 0304-3991 Google Scholar
S. W. HellJ. Wichmann,
“Breaking the diffraction resolution limit by stimulated emission,”
Opt. Lett., 19
(11), 780
–782
(1994). http://dx.doi.org/10.1364/OL.19.000780 OPLEDP 0146-9592 Google Scholar
L. Schermellehet al.,
“Subdiffraction multicolor imaging of the nuclear periphery with 3D structured illumination microscopy,”
Science, 320
(5881), 1332
–1336
(2008). http://dx.doi.org/10.1126/science.1156947 SCIEAS 0036-8075 Google Scholar
J. Huiskenet al.,
“Optical sectioning deep inside live embryos by selective plane illumination microscopy,”
Science, 305
(5686), 1007
–1009
(2004). http://dx.doi.org/10.1126/science.1100035 SCIEAS 0036-8075 Google Scholar
H. U. Dodtet al.,
“Ultramicroscopy: three-dimensional visualization of neuronal networks in the whole mouse brain,”
Nat. Methods, 4
(4), 331
(2007). http://dx.doi.org/10.1038/nmeth1036 1548-7091 Google Scholar
J. Sharpeet al.,
“Optical projection tomography as a tool for 3D microscopy and gene expression studies,”
Science, 296
(5567), 541
–545
(2002). http://dx.doi.org/10.1126/science.1068206 SCIEAS 0036-8075 Google Scholar
G. TurrellJ. Corset, Raman Microscopy: Developments and Applications, Academic Press, San Diego
(1996). Google Scholar
T. Hellereret al.,
“Monitoring of lipid storage in Caenorhabditis elegans using coherent anti- Stokes Raman scattering (CARS) microscopy,”
PNAS, 104
(37), 14658
–14663
(2007). http://dx.doi.org/10.1073/pnas.0703594104 PNASA6 0027-8424 Google Scholar
C. W. Freudigeret al.,
“Label-free biomedical imaging with high sensitivity by stimulated Raman scattering microscopy,”
Science, 322
(5909), 1857
–1861
(2008). http://dx.doi.org/10.1126/science.1165758 SCIEAS 0036-8075 Google Scholar
Y. Ozekiet al.,
“Stimulated Raman scattering microscope with shot noise limited sensitivity using subharmonically synchronized laser pulses,”
Opt. Express, 18
(13), 13708
(2010). http://dx.doi.org/10.1364/OE.18.013708 OPEXFF 1094-4087 Google Scholar
B. Bodermannet al.,
“New methods for measurements on photomasks using dark field optical microscopy,”
in Proc. 19th Eur. Mask Conf. on Mask Tech. for integrated Circuits and Micro-components, GMM-Fachbericht,
47
–52
(2003). Google Scholar
C. W. Leeet al.,
“Morphological studies of living cells using gold nanoparticles and dark-field optical section microscopy,”
J. Biomed. Opt., 14
(3), 034016
(2009). http://dx.doi.org/10.1117/1.3147390 JBOPFO 1083-3668 Google Scholar
M. VilligerC. PacheT. Lasser,
“Dark-field optical coherence microscopy,”
Opt. Lett., 35
(20), 3489
–3491
(2010). http://dx.doi.org/10.1364/OL.35.003489 OPLEDP 0146-9592 Google Scholar
G. PedriniS. SchedinH. Tiziani,
“Aberration compensation in digital holographic reconstruction of microscopic objects,”
J. Mod. Opt., 48
(6), 1035
–1041
(2001). http://dx.doi.org/10.1080/09500340108230973 JMOPEW 0950-0340 Google Scholar
W. Xuet al.,
“Digital inline holography for biological applications,”
PNAS, 98
(20), 11301
–11305
(2001). http://dx.doi.org/10.1073/pnas.191361398 PNASA6 0027-8424 Google Scholar
P. Marquetet al.,
“Digital holographic microscopy: a noninvasive contrast imaging technique allowing quantitative visualization of living cells with subwavelength axial accuracy,”
Opt. Lett., 30
(5), 468
–470
(2005). http://dx.doi.org/10.1364/OL.30.000468 OPLEDP 0146-9592 Google Scholar
A. AnandV. K. ChhaniwalB. Javidi,
“Imaging embryonic stem cell dynamics using quantitative 3-D digital holographic microscopy,”
IEEE Photon. J., 3
(3), 546
–554
(2011). http://dx.doi.org/10.1109/JPHOT.2011.2158637 1943-0655 Google Scholar
B. Kemperet al.,
“Label-free quantitative cell division monitoring of endothelial cells by digital holographic microscopy,”
J. Biomed. Opt., 15
(3), 036009
(2010). http://dx.doi.org/10.1117/1.3431712 JBOPFO 1083-3668 Google Scholar
B. KemperG. von Bally,
“Digital holographic microscopy for live cell applications and technical inspection,”
Appl. Opt., 47
(4), A52
–A61
(2008). http://dx.doi.org/10.1364/AO.47.000A52 APOPAI 0003-6935 Google Scholar
L. Martinez-LeonG. PedriniW. Osten,
“Applications of short-coherence digital holography in microscopy,”
Appl. Opt., 44
(19), 3977
–3984
(2005). http://dx.doi.org/10.1364/AO.44.003977 APOPAI 0003-6935 Google Scholar
A. Faridianet al.,
“Nanoscale imaging using deep ultraviolet digital holographic microscopy,”
Opt. Express, 18
(13), 14159
–14164
(2010). http://dx.doi.org/10.1364/OE.18.014159 OPEXFF 1094-4087 Google Scholar
S. Witteet al.,
“Short-coherence off-axis holographic phase microscopy of live cell dynamics,”
Biomed. Opt. Express, 3
(9), 2184
–2189
(2012). http://dx.doi.org/10.1364/BOE.3.002184 BOEICL 2156-7085 Google Scholar
F. Duboiset al.,
“Partial spatial coherence effects in digital holographic microscopy with a laser source,”
Appl. Opt., 43
(5), 1131
–1139
(2004). http://dx.doi.org/10.1364/AO.43.001131 APOPAI 0003-6935 Google Scholar
Y. Parket al.,
“Speckle-field digital holographic microscopy,”
Opt. Express, 17
(15), 12285
–12292
(2009). http://dx.doi.org/10.1364/OE.17.012285 OPEXFF 1094-4087 Google Scholar
F. DuboisP. Grosfils,
“Dark-field digital holographic microscopy to investigate objects that are nanosized or smaller than the optical resolution,”
Opt. Lett., 33
(22), 2605
–2607
(2008). http://dx.doi.org/10.1364/OL.33.002605 OPLEDP 0146-9592 Google Scholar
F. Verpillatet al.,
“Dark-field digital holographic microscopy for 3D-tracking of gold nanoparticles,”
Opt. Express, 19
(27), 26044
–26055
(2011). http://dx.doi.org/10.1364/OE.19.026044 OPEXFF 1094-4087 Google Scholar
B. R. JasnyB. A. Purnell,
“The glorious sea urchin,”
Science, 314
(5801), 938
(2006). http://dx.doi.org/10.1126/science.314.5801.938 SCIEAS 0036-8075 Google Scholar
L. Marie-Louiseet al.,
“Low Mg/Ca ratio alters material properties in sea urchin larvae skeleton,”
Bioinspired Biomimetic Nanobiomater., 2
(1), 28
–34
(2013). http://dx.doi.org/10.1680/bbn.12.00016 BBNIA7 2045-9866 Google Scholar
M. K. Kim,
“Principles and techniques of digital holographic microscopy,”
SPIE Rev., 1
(1), 018005
(2010). http://dx.doi.org/10.1117/6.0000006 SRPEAW 1946-3251 Google Scholar
J. W. Goodman, Speckle Phenomena in Optics: Theory and Applications, Roberts and Company Publishers, Greenwood Village
(2007). Google Scholar
|