|
|
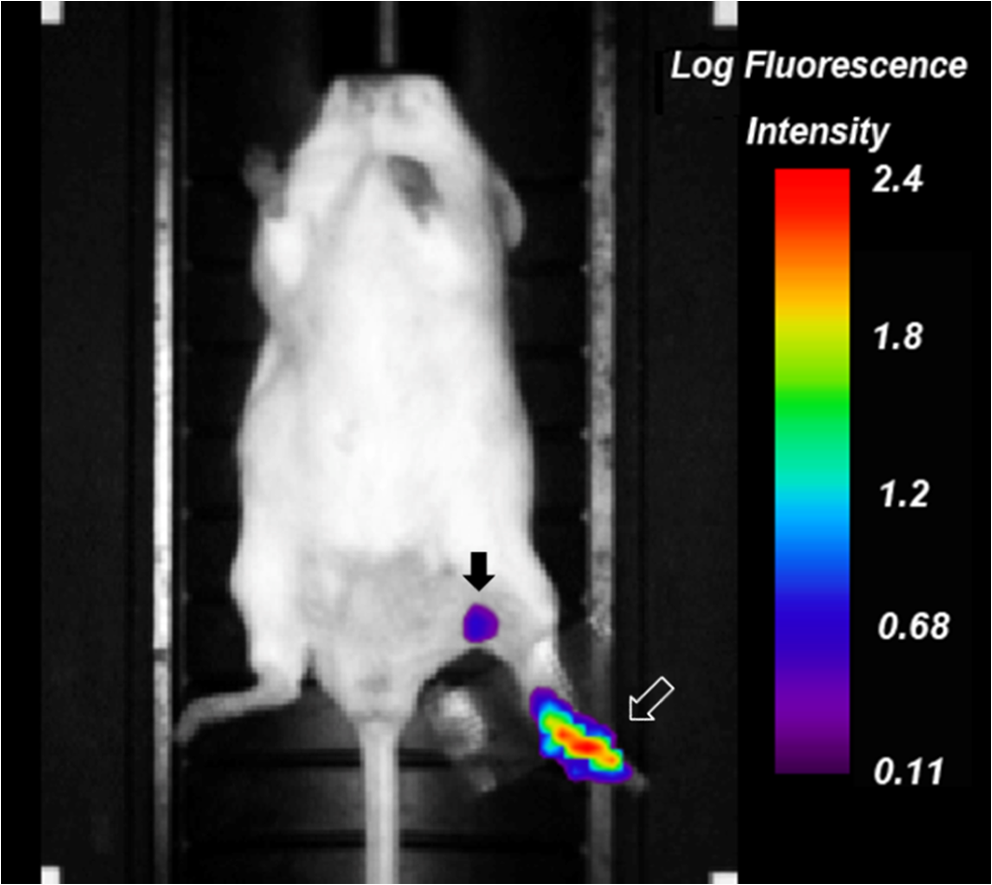
1.IntroductionA sentinel lymph node (SLN) is defined1 as the first lymph node that receives lymph from a tumor. Consequently, the SLN is the first tissue to trap malignant cells that have metastasized from the primary cancer. To exploit this biological phenomenon, surgeons localize the SLN using a vital blue dye,2 a radiopharmaceutical,3 or both.4 If, after a thorough pathologic examination, the SLN is free of tumor cells, the surgeon can conclude that the cancer has not spread. If the patient is a woman with breast cancer, the surgeon will reduce the extent of the surgery by not excising the remaining lymph nodes.5 If the SLN is draining a melanoma, an SLN that is free of tumor cells is predictive of a better prognosis.6 Technetium-99m-labeled tilmanocept,7 also known as []-diethylenetriaminepentaacetic acid (DTPA)-mannosyl-dextran,8 is a receptor-targeted radiopharmaceutical designed for SLN detection. Using an “instant kit” formulation9 with the tradename Lymphoseek, a series of phase 1,10,11 phase 2,12 and phase 313,14 clinical trials, using intradermal, subareolar, and periturmoral administrations, demonstrated rapid SLN accumulation, high SLN retention, high concordance with vital blue dye, and no adverse events related to the radiopharmaceutical. Technetium-99m-labeled tilmanocept was approved for clinical use by the U.S. Food and Drug Administration in March 2013.15 Recent clinical trials16,17 using a mixture of indocyanine green (ICG),18 a low-molecular weight fluorescent dye that emits a near-infrared (NIR) photon, and Nanocoll,19,20 a -labeled microaggregate of albumin, have demonstrated the potential of SLN detection based on multimodal imaging. Assuming high affinity of ICG for albumin, the patient is first imaged with a single photon emission computed tomography, which is usually attenuation-corrected based on a computed tomography (CT) image. Guided by these preoperative images, the surgeon intraoperatively detects the SLNs using endoscopic imaging of the ICG fluorescence. We recently proposed9 multimodal SLN detection based on imaging with positron emission tomography (PET) with CT-based attenuation correction. PET provides higher spatial resolution, increased sensitivity, more accurate attenuation correction, and better scatter correction. After radiolabeling tilmanocept with , a generator-produced positron-emitting radionuclide, canine pelvic SLNs were imaged 1 h after a transrectal injection into the prostate gland.21 Covalent attachment of Cy7, a cyanine fluorescent dye, to tilmanocept resulted in an NIR fluorescent-tagged tilmanocept,22,23 which retained the properties exhibited by tilmanocept without the fluorescent tag. Fluorescent-labeled tilmanocept exhibited sub-nanomolar receptor affinity () to a macrophage cell line that expresses the receptor (CD206), as well as in vivo behavior consistent with SLN receptor-mediated accumulation. Here we introduce a series of new dextran conjugates with different dye densities. The dyes are covalently conjugated to the dextran backbone. And the average number of dyes per dextran was measured via nuclear magnetic resonance (NMR). The specific fluorescence brightness was evaluated for the selection of the best imaging probe. Finally, was labeled to the fluorescent-tilmanocept and the feasibility of SLN PET and fluorescence imaging in a mouse model was demonstrated. To the best of our knowledge, this is the first example of dual-modality SLN-targeted nonparticulate imaging with and an NIR dye, IRDye 800CW. 2.Methods2.1.Synthesis: Conjugation of IRDye 800CW to TilmanoceptConjugation of the optical reporter, a cyanine dye, to tilmanocept proceeded in a manner previously described.24 The NIR dye was covalently coupled to the amino-terminated leashes on the dextran backbone of DTPA-mannosyl-dextran (tilmanocept, Navidea Biopharmaceuticals, Ohio). The mean number of DTPA, mannose, and amines per dextran of the tilmanocept preparation was 4.4, 16.8, and 5.5, respectively. The mean molecular weight was and Stokes radius was 7.7 nm. Conjugates with different IRDye 800CW to tilmanocept ratios were prepared. Briefly, tilmanocept (0.25 μmol) was combined with varying amounts (molar excess of 1 to 10 equivalents) of IRDye 800CW-NHS-ester (LI-COR Biosciences, Nebraska) in 1.1 ml dimethyl sulfoxide. After brief vortexing, the mixture was incubated overnight on a rolling rotor at 30°C. After diluting the reaction mixture with deionized water, IRDye 800CW-tilmanocept (800CW-tilmanocept) was purified by centrifuging the product through an ultrafiltration system (Ultra 15, Amicon Corp., Maryland, 3 kDa molecular weight cut-off). After five times of centrifugation, deionized water was added to the concentrated retentate and a sample was removed for analysis of purity. The centrifugation was repeated until no free IRDye 800CW could be detected in the retentate as measured by high-performance liquid chromatography (HPLC) with fluorescence detection. The product was lyophilized, weighed, and redissolved in phosphate-buffered saline (PBS) to form a stock solution with a final concentration of . Purity of the final product was confirmed by size exclusion (TSKgel G2000SWxl, Tosoh Bioscience LLC, Tokyo, Japan) HPLC (System Gold, Beckman-Coulter, California) using 0.9% saline as the mobile phase. The eluate was monitored by UV absorbance and fluorescence (L-7480, Hitachi America, Ltd., Michigan). 2.2.Quantification of Fluorophore DensityNMR spectroscopy was performed to measure the average number of conjugated IRDye 800CW molecules attached to each tilmanocept molecule. Purified 800CW-tilmanocept was dissolved in to form a concentrated solution. The sample was analyzed on a 500 MHz NMR spectrometer (ECA 500, JEOL Corp, Ohio). The fluorophore density , the average number of dyes per dextran backbone, was calculated using Eq. (1): where equals the area under the peak designated at 7.7 ppm and equals the area under the two peaks designated at 4.8 and 5.2 ppm.2.3.Statistical Analysis of IRDye 800CW Density DistributionWe employed a statistical model to predict the distribution of IRDye 800CW attached to each tilmanocept. The model was previously used to predict the distribution of iodine atoms after radiolabeling of proteins25 and was later applied by Meares and Goodwin26 to study the distribution of chelators after covalent attachment to antibody molecules. The quantity represents the theoretical fraction of 800CW-tilmanocept molecules with IRDye 800CW molecules covalently coupled to the amino-terminated leashes of the dextran backbone. The quantity is the maximum number of amino-terminated leashes in the tilmanocept molecule; we set equal to 6 based on the average number of free amino groups in the tilmanocept preparation. The average number of IRDye 800CW molecules per tilmanocept (IRDye 800CW density) is represented by the variable . We calculated values for 800CW-tilmanocept preparation having average 800CW densities of 0.25, 0.5, 1.0, 2.0, and . Equation (2) assumes that the IRDye 800CW-NHS-ester reacts with all of the amino-terminated leashes with equal probability and that attachment to an amino group renders the reaction site unreactive and does not alter the probability of a reaction to the remaining sites. Using conservation of mass, the fraction of tilmanocept molecules without any attached dye () can be calculated as2.4.Characterization of Optical PropertiesAbsorption spectra (Varian Carey 3E, Agilent Technologies, CA) were obtained between 650 and 850 nm (1 nm slit width, 1 nm step size) for both IRDye 800CW-NHS-ester and five 800CW-tilmanocept conjugates with a different dye density each. Samples were dissolved in PBS followed by brief shaking. The solutions were diluted with PBS to five concentrations and measured in a cuvette with a 10 mm path length. Emission spectra (Fluorolog 3, Horiba Jobin Yvon Inc., New Jersey) were obtained for each 800CW-tilmanocept conjugate and unconjugated IRDye 800CW-NHS-ester. Samples were excited at 758, 780, and 805 nm, respectively, and emission spectra (750 to 850 nm, 5 nm slit width) were acquired. The molar absorptivities () of unconjugated IRDye 800CW and 800CW-tilmanocept conjugates were calculated in the following manner. Absorption at 758, 780, or 805 nm was measured for each sample at five different dilutions. All absorbance values were below 0.05. When the absorbance was plotted as a function of the IRDye 800CW concentrations, equaled the gradient of the regression line. The standard errors for were generated from the linear regression. Quantum yields () for free IRDye 800CW-NHS-ester and 800CW-tilmanocept were calculated in the following manner. Applying a similar method outlined by Williams et al.,27 the integral of the corrected fluorescence spectrum over 760 to 850 nm of each sample dilution was plotted against the absorbance at the individual excitation wavelength. The gradient yielded the relative quantum yield of each sample. The standard errors for were generated from the linear regression. The absolute value of the quantum yield and standard error for unconjugated IRDye 800CW were obtained from three measurements on an integrating sphere Quanta-phi (HORIBA Scientific, New Jersey). The relative quantum yield values for each of the 800CW-tilmanocept conjugates were scaled to the absolute values by multiplying the ratios of the relative quantum yield of each 800CW-tilmanocept to IRDye 800CW, and the absolute quantum yield of the IRDye 800CW. We calculated fluorescent brightness per molecule of IRDye 800CW and per molecule of 800CW-tilmanocept. The brightness per molecule of IRDye 800CW was calculated as the product of molar absorptivity () and the quantum yield (). The multiplication of and yielded the specific fluorescence brightness , which provided a measure for the contrast agent. This parameter was used as the design criterion for optimization of our fluorescent probe. The relative errors for the brightness values were generated as the quadratic sum28 of the relative errors of and . The standard deviation of dye density from three NMR measurements was of the absolute value. It was neglected in calculations of the errors for the specific fluorescence brightness. In vitro fluorescence intensity measurements of five 800CW-tilmanocept conjugates were performed on three different fluorescence imaging systems. Each imager represents a different experimental setting and uses a different set of excitation and emission wavelengths. The Optix MX (Advanced Research Technologies Inc., Montreal, Canada) uses an excitation wavelength of 758 nm and an emission filter set consisting of a 780 nm long-pass filter and a 782 nm bandpass filter with a 20 nm bandwidth. The Fluobeam 800 (Fluoptics, Grenoble, France) excites with a wavelength of 780 nm and employs a long-pass emission filter at 800 nm. The da Vinci SI surgical system (Intuitive Surgical Inc., California) uses an excitation laser of 805 nm and applies a long-pass emission filter at 830 nm. Solutions (640 μL) in eppendorf centrifuge tubes with the same concentration of 800CW-tilmanocept (781 nM) were placed under the cameras within the field-of-view. The same volume of PBS was used as a blank control. All samples were arranged in a manner to ensure uniform illumination. Images were acquired and a region of interest (ROI) was drawn within each sample to calculate the fluorescence signals; an ROI over the PBS represented the background noise. The signal-to-noise ratio (SNR) was calculated by dividing the signal from the ROI with the background noise. The maximum fluorescence intensity within each ROI was obtained using Optiview (Advanced Research Technologies Inc.) and ImageJ software (National Institutes of Health, Bethesda). For each of the three excitation wavelengths, the brightness and the ROI fluorescence intensity measurements of all 800CW-tilmanocept conjugates with different IRDye 800CW densities were compared. The molar brightness and ROI fluorescence intensity were normalized through dividing each measurement within a given wavelength by the highest value, which was provided by the conjugate for all three wavelengths. 2.5.Radiolabeling and Radiochemical PurityRadiolabeling of 800CW-tilmanocept with was performed using a previously described method.21 Briefly, a generator (IGG100, Eckert & Ziegler Isotope Products, Berlin, Germany) was eluted with 5 ml 0.1 N HCl. A volume (30 μL) containing 3 nmol of 800CW-tilmanocept was combined in a polypropylene vial with 50 μL of 2.0 M sodium acetate solution and 0.5 mL of the generator elute. The reaction mixture was allowed to stand at room temperature for 15 min. Finally, 0.5 mL PBS (pH 7.2, phosphate and chloride) was added to the reaction mixture to adjust the pH value to 7. Doses (40 μL) were drawn into insulin syringes with 28 gauge needles. Instant thin layer chromatography (ITLC) using Whatman-31ET (Whatman Ltd., Michigan) as the stationary phase and acetone as the mobile phase was performed using standard technique to measure the radiochemical purity. The radiolabeled product was characterized by HPLC using UV absorbance, fluorescence, and radioactivity detection (Model 170, Beckman-Coulter). 2.6.Fluorescent PurityPurity of fluorescent label was measured by scanning the -labeled 800CW-tilmanocept ITLC strips developed in (85/15, v/v) with the Optix MX fluorescence imaging system (, to 792 nm). An ITLC of free IRDye 800CW was also performed and scanned on the Optix MX. This sample was prepared by combining 100 nmol IRDye 800CW-NHS-ester in 1 mL PBS. After standing for at least 30 min at room temperature, a drop of the solution was applied to a silica gel ITLC strip (green label, Biodex Medical Systems, New York) and developed with (85/15, v/v). 2.7.In Vivo Sentinel Lymph Node Fluorescence ImagingIn vivo SLN mapping was performed using a healthy mouse model. After subcutaneous footpad injections, optical properties and the radioactivity profile of each popliteal lymph node was studied. Female Swiss Webster mice (18 to 24 g, five weeks old) were purchased from Charles River Labs. The in vivo procedures in this study were performed under a protocol approved by the Institutional Animal Care and Use Committee at University of California, San Diego. Three mice were imaged for each 800CW-tilmanocept conjugate with fluorophore densities of 0.7, 1.5, 2.3, 2.9, and 3.8. All mice were anesthetized by inhalation of 1 to 2% isoflurane during the study. After induction of anesthesia, the lower abdomen and both legs of each mouse were shaved and 40 μL -labeled 800CW-tilmanocept (0.11 nmol) was injected subcutaneously into one hind side of the footpad. Immediately after the injection, the footpad was massaged for 10 s. The mice were transferred to the imaging stage of the Optix MX for in vivo imaging, at 25 min postinjection. The footpad bearing the injection was taped onto the stage to avoid motion artifacts. The laser excitation and emission wavelengths were adjusted to the same values (, to 792 nm) as used to image the in vitro fluorescence intensity. An ROI was selected over the footpad and the SLN with a pixel size. The mice were euthanized 30 min postinjection. The popliteal and inguinal lymph nodes were excised. Images were viewed and analyzed with standard software (OptiView). 2.8.PET ImagingNuclear imaging was performed on a small-animal PET scanner (eXplore Vista DR, GE Healthcare, Wisconsin). Injections of -labeled 800CW-tilmanocept () were performed in mice as stated in Sec. 2.6. The syringes containing radioactivity were assayed in a dose calibrator CRC-15W (Capintec Inc., New Jersey) before and after injection for the accurate determination of the injected dose. Mice were placed on the stage in a supine position. PET acquisitions were conducted in list mode for a 25-min dynamic scan (400 to 700 keV energy window). Cross-sectional images were reconstructed into five 5-min frames. SNR was defined as dividing the radioactivity counts per pixel from the SLN by the radioactivity counts per pixel from the background outside of the animal. 2.9.Nuclear Counting and SLN IRDye 800CW CalculationThe excised lymph nodes were assayed for radioactivity using a 400 to 600 keV window (Gamma 9000, Beckman Instruments, California) and compared to a counting standard of a known dilution of the injectate. The percent of injected dose (%ID) of tilmanocept was calculated by comparison of the tissue counts with counts from the counting standard. Calculation of the amount of 800CW-tilmanocept within each SLN was based on the %ID of tilmanocept. The amount of IRDye 800CW within each SLN was calculated based on the amount of 800CW-tilmanocept and the IRDye 800CW density. The percent SLN extraction23 was calculated as the difference between the SLN and distal lymph node counts divided by the sum of the SLN and distal lymph node counts. 3.Results3.1.SynthesisThe chemical structure of -labeled 800CW-tilmanocept is illustrated in Fig. 1(a). The receptor-binding multimodal imaging probe is composed of NC units of amino-terminated leashes, ND units of DTPA, which chelate the nuclear imaging reporter , NDye units of the optical imaging reporter IRDye 800CW, and NM units of mannose, the receptor substrate. Figure 1(b) is the normalized absorbance and fluorescence spectra of free IRDye 800CW and an 800CW-tilmanocept preparation having a mean fluorophore density of 2.3 dyes per tilmanocept. The spectra demonstrated absorption and emission peaks of the conjugated product with a 6 nm visible red shift, compared to the unconjugated IRDye 800CW. A similar phenomenon was observed for Cy7-tilmanocept.23 Fig. 1Chemical structure of -labeled 800CW-tilmanocept and its normalized absorbance (open) and fluorescence (solid) spectra. (a) The receptor-binding multimodal imaging probe is composed of NC units of amino-terminated leashes, ND units of diethylenetriaminepentaacetic acid (DTPA) groups, which chelate the nuclear imaging reporter , NDye units of the optical imaging reporter IRDye 800CW, and NM units of mannose, the receptor substrate. (b) Attachment of IRDye 800CW to tilmanocept produces a 6 nm red shift and an increase in the nonradiative peak (800CW-tilmanocept: triangle; IRDye 800CW: circle).  The HPLC chromatograms of unconjugated IRDye 800CW molecule exhibited absorbance and fluorescence peaks with an elution volume of 28 mL. All conjugates exhibit absorbance and fluorescence peaks at an elution volume of 10 mL with no detectable peaks at 28 mL. 3.2.Calculation of Fluorophore DensityFigure 2 is a portion (4 to 8 ppm) of a proton NMR spectrum for 800CW-tilmanocept () in . represents 8 protons on IRDye 800CW molecules; describes protons on carbon of dextran backbone. There are three benzene rings on each IRDye 800CW molecule and six protons at the ortho- positions to the sulfonate, which are heavily deshielded due to the magnetic anisotropy of the ring. Two allylic protons close to the cyclohexenyl ring also have a far downfield chemical shift, as a result of the ring current from the phenoxy group. Thus, chemical shifts of those eight protons are at 7.7 ppm. The dextran backbone of tilmanocept is composed of 62 glucose molecules with α-1, 6 glycosidic linkages, with certain portion of branches by -1, 3 glycosidic linkages. Two neighboring oxygen atoms are in short range, resulting in deshielding effect toward the adjacent protons. As a result, the protons on the anomeric carbons have two unique chemical shifts at around 4.8 and 5.2 ppm. Fig. 2Proton NMR spectrum (4 to 8 ppm) for 800CW-tilmanocept in . represents eight protons on IRDye 800CW; represents protons on carbon of the dextran backbone. This spectrum was acquired from a conjugate with an average of 3.8 IRDye 800CW molecules per tilmanocept.  The fluorophore density could be controlled by the molar ratio of the coupling reactants, IRDye 800CW-NHS-ester and tilmanocept. Figure 3 demonstrates this ability, where the reactant ratios from 1 to 10 mole of IRDye 800CW-NHS-ester per mole of tilmanocept produced 800CW densities from 0.7 to 3.8 per tilmanocept. Five IRDye 800CW densities were prepared: 0.7, 1.5, 2.3, 2.9, and . 3.3.Statistical Analysis of IRDye 800CW Density DistributionTable 1 lists the percentage of 800CW-tilmanocept molecules composed of IRDye 800CW molecules for preparations with an average of 0.25, 0.50, 1.0, 2.0, and 3.0 800CWs per tilmanocept. Attachment of IRDye 800CW molecules to the tilmanocept macromolecule will result in a distribution of conjugates bearing different numbers of IRDye 800CW molecules per tilmanocept. For example, when a preparation contains a ratio of 0.25 IRDye 800CW molecules to one tilmanocept molecule, Eq. (2) predicts that 80% of the 800CW-tilmanocept molecules will exist as conjugates with a single IRDye 800CW attachment and that 18% of the 800CW-tilmanocept molecules will have two IRDye 800CW molecules attached to tilmanocept. When the average number of IRDye 800CW molecules per tilmanocept is 1.0, Eq. (2) predicts that an equal percentage (40%) of 800CW-tilmanocept molecules will consist of single and double substitutions. Table 1Percentage of 800CW-tilmanocept molecules composed of n IRDye 800CW molecules. 3.4.Characterization of Optical PropertiesCovalent attachment of IRDye 800CW to tilmanocept altered the absorbance spectra. Figure 4 is the absorbance spectra (dye concentrations of 150 nM) of unattached IRDye 800CW and 800CW-tilmanocept conjugates of different IRDye 800CW densities. The absorbance profile of 800CW-tilmanocept was significantly influenced by the fluorophore density. The ratio of nonradiative overtone hump at 710 nm (confirmed by comparison of excitation and absorption scans) to the peak at 780 nm increased when more dyes were attached. At same dye concentration, the conjugate with a mean density of 2.3 dyes per tilmanocept (green, hexagon) had the highest absorbance at 780 nm, while the conjugate with 0.7 dyes per tilmanocept (cyan, triangle) had the lowest absorbance. The conjugates with 1.5 (red, circle), 2.9 (blue, diamond), and 3.8 (pink, square) dyes per tilmanocept had intermediate absorbance values at 780 nm. All conjugates exhibited less absorbance at this wavelength compared to free fluorophore (black). Fig. 4Absorbance spectra (normalized to equal an IRDye 800CW concentration of 150 nM) of unattached IRDye 800CW and 800CW-tilmanocept conjugates with different IRDye 800CW densities: (black) IRDye 800CW-NHS-ester, (cyan, triangle) 0.7 dyes per tilmanocept, (red, circle) 1.5 dyes per tilmanocept, (green, hexagon) 2.3 dyes per tilmanocept, (blue, diamond) 2.9 dyes per tilmanocept, (pink, square) 3.8 dyes per tilmanocept.  The optical characteristics of the conjugates with different IRDye 800CW densities were determined at three excitation wavelengths. The molar absorptivity decreased dramatically after the attachment to tilmanocept at low fluorophore density (). With increasing fluorophore density, the absorptivity per mole of fluorophore increased to a peak value at 2.3 and then decreased [Fig. 5(a)]. The relative error of the molar absorptivity and quantum yield measurements were and 11%, respectively. The brightness and quantum yield per attached fluorophore were lower than the free fluorophore. For free IRDye 800CW, the molar absorptivity and quantum yield in PBS at 780 nm were measured to be and , respectively. The quantum yield decreased with increasing fluorophore density [Fig. 5(b)]. As a result of the changing molar absorptivity and quantum yield, the IRDye 800CW brightness [Fig. 5(c)] and the specific fluorescence brightness [Fig. 5(d)] exhibited peak values at fluorophore density of . At an excitation wavelength of 780 nm, the calculated specific fluorescence brightness for 2.3 800CW-tilmanocept conjugate was times higher than the 0.7 conjugate. The 800CW-tilmanocept brightness values at 780 nm were higher than 758 nm, and the lowest values were at 805 nm. Fig. 5Optical properties of five IRDye 800CW-tilmanocept (open symbols) conjugates at (circles) 758 nm, (triangles) 780 nm, and (squares) 805 nm. (a) Molar absorptivity (per mole of fluorophore). (b) Quantum yield . (c) Brightness of IRDye 800CW . (d) Specific fluorescence brightness of 800CW-tilmanocept conjugate (per mole of tilmanocept). The solid symbols represent unattached IRDye 800CW. 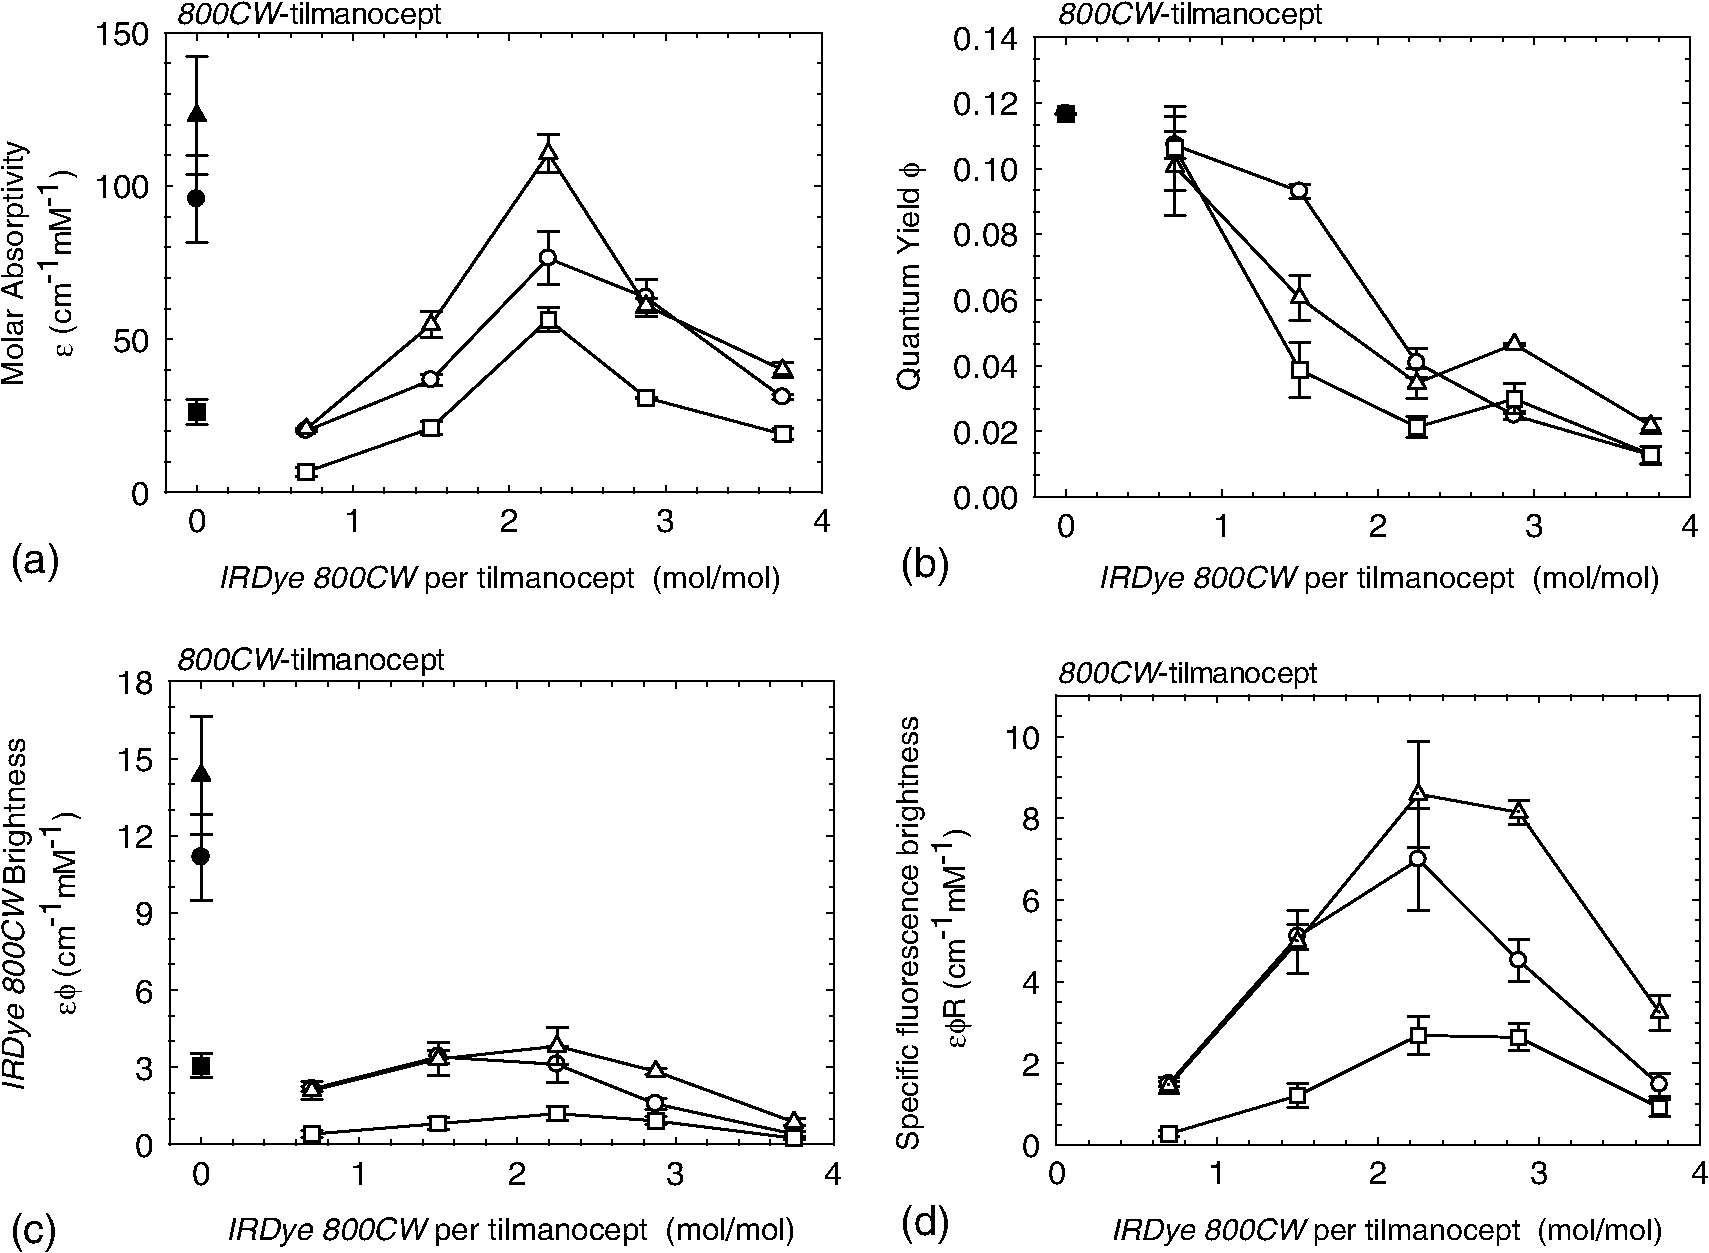 In vitro fluorescence images confirmed our specific fluorescence brightness calculations. Normalized 800CW-tilmanocept brightness when plotted against the IRDye 800CW density matched the normalized ROI intensities [Fig. 6(a), 6(c), and 6(e)]. Both parameters peaked at fluorophore density of for each of the three excitation wavelengths. The ROI intensity for the conjugate with fluorophore density of was the lowest. The ROI intensity of 800CW-tilmanocept with a density of was much stronger, by a factor of 3.5 for excitation at 758 nm, 5.0 for excitation at 780 nm, and 6.4 for excitation at 805 nm. Figure 6(b), 6(d), and 6(e) shows images from the Optix MX, Fluobeam 800, and Firefly endoscopic camera of the da Vinci SI robotic surgical system. The conjugate with the fluorophore density of 2.3 provided the highest fluorescent intensity in each of the three images, which exhibited SNR values of for the Optix MX, for the Fluobeam 800, and for the da Vinci SI robotic surgical system. Fig. 6The brightness calculations were confirmed by in vitro imaging. After normalization, the 800CW-tilmanocept (781 nM) specific fluorescence brightness and the ROI intensity from each fluorescence imaging system (Optix MX, Fluobeam 800, and Da Vinci SI surgical system) were compared. Normalized curves and fluorescence images at three excitation wavelengths: at 758 nm (a) and (b); at 780 nm (c) and (d); at 805 nm (e) and (f).  3.5.Radiolabeling and Radiochemical PurityThe radiolabeling yield and purity for the -labeled products were in excess of 98%. HPLC and ITLC demonstrated high radiochemical purity. The absorbance [Fig. 7(a)], fluorescence [Fig. 7(b)], and radioactivity [Fig. 7(c)] HPLC chromatograms exhibited a single component at the same elution volume. Radioactivity remained at the origin of the ITLC chromatograms [Fig. 7(d)], indicating high radiochemical purity for all -labeled 800CW-tilmanocept preparations. Gallium-68 DTPA compound, a possible impurity, travels to the solvent front. Fig. 7Radiochemical purity of all -labeled 800CW-tilmanocept preparations. . High performance liquid chromatography and instant thin layer chromatography (ITLC) revealed single components within each of the (a) absorbance (226 nm), (b) fluorescence (excitation 774 nm, emission 798 nm), (c) radioactivity, and (d) ITLC radioactivity chromatograms.  3.6.Fluorescent PurityThe fluorescent purity of all preparations was in excess of 98%. Fluorescence scans of the ITLCs of -labeled 800CW-tilmanocept demonstrated high purity of the conjugate with fluorescent tag. More than 98% of the fluorescence and radioactivity remained at the origin [Fig. 8(a) and 8(c)]. Unconjugated IRDye 800CW traveled to the solvent front [Fig. 8(b) and 8(d)]. Fig. 8Quality control of radiolabeling 800CW-tilmanocept with Ga-68. (a) Fluorescence image of a developed ITLC strip with -labeled 800CW-tilmanocept, and color map of normalized fluorescence intensity in units of counts· . (b) Fluorescence image of a developed ITLC strip with unconjugated IRDye 800CW. (c) Radioactivity (red, dash) and fluorescence (blue, solid) profile of an ITLC strip with -labeled 800CW-tilmanocept. (d) Fluorescence profile of an ITLC strip with unconjugated IRDye 800CW.  3.7.In Vivo Sentinel Lymph Node Fluorescence ImagingPopliteal SLNs were identified by their fluorescence intensity after footpad injection. No detectable signals were observed from distal lymph nodes. For all mice, the percentage extraction of popliteal nodes exceeded 99%, which was consistent with our previous observations with -labeled tilmanocept8 and -labeled Cy7-tilmanocept.23 Among the five preparations, the conjugate provided dramatically brighter signals than all other conjugates. In vivo imaging (Fig. 9) of the 800CW-tilmanocept conjugate showed a bright popliteal node close to the injection site in the left hind leg. The color map is logarithmic with a peak value of 56 kilocounts. Based on the ex vivo nuclear counting, of 800CW-tilmanocept molecules accumulated in the popliteal SLN. Consequently, the fluorescence signal with a peak intensity of 1.2 kilocounts in the SLN was originated from the 2.5 pmol of conjugated IRDye 800CW molecules. The right hind leg of the animal was scanned as a control, where no counts were observed above the background signal. When the same amount of 800CW-tilmanocept with dye density of was administrated to the mice, a similar amount of the conjugate was trapped in the popliteal node; however, the node was not identifiable against the background signal (image not shown). 3.8.PET ImagingSLNs were easily visualized by PET. As shown in Fig. 10, the popliteal lymph node was detected as a hot spot separated from the injection site on the coronal cross-section. This image was reconstructed from raw data acquired 15 min after injection; 0.94% of the injected dose () accumulated in the popliteal SLN. The percent extraction was . The color map represents the radioactivity counts. The SNR was 2922 for the popliteal SLN. The positioning of the hot node and the injection site was consistent to the relative locations of the fluorescence signals in optical images. 4.DiscussionA detailed optical characterization of a receptor-targeted fluorescence imaging probe is a critical step during translation into a phase 1 clinical trial. Receptor-targeted agents exhibit unique properties that offer increased sensitivity to changes in tissue function.29 However, these properties can also limit the amount of agent that can be accumulated in the tissue. This can occur because the number of receptors within the target tissue will determine the maximum number of imaging molecules that can accumulate within the tissue via a receptor-targeted mechanism. Consequently, the number of imaging reporters per amount of injected probe is an important design consideration. This is the motivation for our design criteria, specific fluorescence brightness, which is an index of brightness per mole of 800CW-tilmanocept. Specific fluorescence brightness is the optical equivalent of the specific activity for radiopharmaceuticals. The difference between the optical imaging probe and a radiopharmaceutical is that only a very small fraction of latter imaging agent is actually radiolabeled.30 For example, when 3.0 mg of Zevalin is radiolabeled with 5.0 mCi of , only 0.6% of the antibodies carry a radioactive atom, the imaging reporter. Unlike radioactive labels, the attachment of more fluorescent reporters to each targeting molecule will not necessarily yield a corresponding increase in the fluorescence signal. The goal of this work was to maximize the specific fluorescence brightness of 800CW-tilmanocept. Optimization of the IRDye 800CW loading on tilmanocept for maximum fluorescence brightness is crucial when designing the brightest conjugate. The in vitro brightness measurements permitted the selection of the brightest conjugate for in vivo studies. Fluorescence brightness trend at different wavelengths was first calculated based on absorbance and fluorescence data acquired on a spectrometer. Then this trend was further confirmed by fluorescence intensity measurements with three preclinical imaging systems. The optimal 800CW-tilmanocept conjugate peaked at the fluorophore density of . At the excitation wavelength of 758 nm, 800CW-tilmanocept with fluorophore density of exhibited 4.7-fold stronger brightness than the conjugate with fluorophore density of . The further increase in fluorophore density does not compensate the loss of the brightness per fluorophore, which results in an overall decrement of the brightness. The trends of in vitro fluorescence intensity for 800CW-tilmanocept with various dye densities in PBS buffer imaged with three imaging systems match the brightness measurements on the spectrometer, where coupling 2.3 IRDye 800CW molecules per tilmanocept provides the greatest fluorescence intensity. We evaluated the determining factors of the fluorescence brightness (), which is the product of molar absorptivity (), an index of how efficiently photons are absorbed, and quantum yield , an index of how efficiently absorbed photons are converted to fluorescence photons. More specifically, we optimized the specific fluorescence brightness of 800CW-tilmanocept, which was an index of brightness per mole of the contrast agent. Maximum dye-loading does not necessarily yield maximum brightness. At high dye concentrations, the molar absorptivity can vary from Beer’s law and the quantum yield can be reduced due to self-quenching, resulting in overall reduced brightness. Variations of absolute and values of free IRDye 800CW were reported in literatures around 785 nm, which are possibly due to different solvent systems.31,32 The molar absorptivity per mole of dye peaked at density of . Multiple factors contribute to the changes in molar absorptivity as the number of attached dyes per dextran is increased. These factors include changes of local refractive index originating from dextran–solvent interaction,33 dye–dye interactions,34 and the “inner-cell” effect35 caused by high local dye concentrations. A more detailed study into the degree at which each factor contributes to the change in molar absorptivity will require the isolation of each 800CW-tilmanocept molecule with the same degree of dye substitution. For example, a dilute solution of an 800CW-tilmanocept conjugate with only one dye attached to a single dextran may not exhibit fluorophore aggregation or an inner-cell effect. The average for unconjugated IRDye 800CW was 0.12 from direct measurement using an integration sphere. The values for all the 800CW-tilmanocept conjugates fall below it and decrease with increasing fluorophore density. These could be explained by self-quenching of fluorophores in close proximity. The distribution calculations listed in Table 1 demonstrate that a fraction of the 800CW-tilmanocept molecules, even at low coupling densities, will consist of at least two IRDye 800CW moleclues attached per tilmanocept and will, consequently, facilitate self-quenching within the tilmanocept molecule, which would reduce the overall quantum yield of the molecule. The statistical analysis sheds light on understanding the optical properties of the 800CW-tilmanocept conjugates. The essential assumption is that heavily labeled conjugates provide an increased opportunity for intramolecular interactions of the fluorophores such as inner-cell effect and self-quenching, which will consequently affect the parameters we measure, including the molar absorptivity and the quantum yield . Our results were consistent with Gruber et al.,36 who observed a nonfluorescent state of Cy5 at high degrees of attachment to IgG. As shown in Table 1, within the low-density 800CW-tilmanocept preparation, of the IRDye 800CW molecules contributed to 800CW-tilmanocept molecules with at least two IRDye 800CW molecules attached. This value increases to in preparations with an average of 1.0 IRDye 800CW molecule per tilmanocept. Depending on solvent and temperature, the conformation of dextran molecules changes from a rod-like shape to a random coil.37 This conformational flexibility enables two IRDye 800CW molecules within the tilmanocept to interact and is an alternative to the hypothesis that the first dye can direct the attachment of the second dye via a dye–dye interaction.38 Conformational flexibility after a random attachment of the second dye would maintain the assumption of “site independence” required by the statistical model expressed by Eq. (2). In other fluorophore-carrier systems, when switching the IRDye 800CW to other dyes such as Cy7 or Alexa 750 fluorophores, or tilmanocept to other carriers such as nanoparticles or other polymers, the optimal number of dyes per carrier may vary a great deal due to their distinct intrinsic properties (size, shape, flexibility, etc.). However, the caveat that maximum dye-loading does not equal maximum brightness is still applicable. In our case, the fluorescence intensity of the conjugate could differ by fivefold while optimizing the chemical structure. Sensitivity of the imaging system is also a limiting factor, which requires brighter probes. At same concentration, the dimmest probe may not be detectable if it is close or even beyond the detection threshold of the optical system, which could easily lead to false negatives. Furthermore, investigators need to demonstrate whether the fluorophore labeling compromises the binding affinity of the probe. Our previous study indicated fluorescent tilmanocept exhibited an unaltered .23 Similar investigations should be performed when selecting the optimal conjugate. To the best of our knowledge, this is the first example of dual-modality nonparticulate SLN targeted imaging with and an NIR dye. Radiolabeling with greatly facilitates tracking of the 800CW-tilmanocept in vivo with a PET scanner. Additionally, the agent can be visualized by fluorescence and/or by a hand-held radioactivity detector. These properties make the -labeled 800CW-tilmanocept ideal for preoperative surgical planning. Hybrid PET-CT can guide the surgeon to the lymph node basin that contains the SLN. Fluorescence imaging cameras such as the Fluobeam38 can guide the surgical exposure and visual identification of the SLN.39 This can be performed with wide-bandwidth cameras and laparoscopic cameras during robotic-assisted surgery.40 The goal of the approach is to reduce operative time, improve diagnostic accuracy, and decrease morbidity. AcknowledgmentsWe thank Professor Roger Y. Tsien for the use of his Fluorolog spectrometer and his trenchant observations during our many discussions. We appreciate the thoughtful discussions with Dr. Dan Draney and kind reviews from Ms. Joy Kovar and Dr. Brad Roth at LI-COR Biosciences. IRDye 800CW was a generous gift from LI-COR Biosciences. We acknowledge Horiba Scientific Inc. for the absolute quantum yield measurement of the free unconjugated IRDye 800CW. This research was supported by the National Institutes of Health (Grants P50 CA128346 and P30 CA023100). ReferencesR. M. Cabanas,
“An approach for the treatment of penile carcinoma,”
Cancer, 39
(2), 491
–499
(1977). http://dx.doi.org/10.1002/(ISSN)1097-0142 60IXAH 0008-543X Google Scholar
D. L. Mortonet al.,
“Technical details of intraoperative lymphatic mapping for early stage melanoma,”
Arch. Surg., 127
(4), 392
–399
(1992). http://dx.doi.org/10.1001/archsurg.1992.01420040034005 0004-0010 Google Scholar
J. C. AlexD. N. Krag,
“Gamma-probe guided localization of lymph nodes,”
Surg. Oncol., 2
(3), 137
–143
(1993). http://dx.doi.org/10.1016/0960-7404(93)90001-F SUOCEC 0960-7404 Google Scholar
J. J. Albertiniet al.,
“Intraoperative radiolymphoscintigraphy improves sentinel lymph node identification for patients with melanoma,”
Ann. Surg., 223
(2), 217
–224
(1996). http://dx.doi.org/10.1097/00000658-199602000-00016 ANSUA5 0003-4932 Google Scholar
M. B. FariesD. L. Morton,
“Surgery and sentinel lymph node biopsy,”
Semin. Oncol., 34
(6), 498
–508
(2007). http://dx.doi.org/10.1053/j.seminoncol.2007.09.010 SOLGAV 0093-7754 Google Scholar
D. L. Mortonet al.,
“Sentinel node biopsy for early-stage melanoma: accuracy and morbidity in MSLT-I, an international multicenter trial,”
Ann. Surg., 242
(3), 302
–311
(2005). ANSUA5 0003-4932 Google Scholar
K. T. Chenget al.,
“-diethylenetriaminepentaacetic acid-mannosyl-dextran,”
Molecular Imaging and Contrast Agent Database, National Center for Biotechnology Information, Bethesda, MD
(2011). Google Scholar
D. R. Veraet al.,
“A synthetic macromolecule for sentinel node detection: []DTPA-mannosyl-dextran,”
J. Nucl. Med., 42
(6), 951
–959
(2001). JNMEAQ 0161-5505 Google Scholar
D. R. Veraet al.,
“[]tilmanocept: a synthetic receptor-targeted molecule for sentinel lymph node mapping,”
Radiopharmaceuticals for Sentinel Lymph Node Detection, International Atomic Energy Agency, Vienna Google Scholar
A. M. Wallaceet al.,
“Lymphoseek: a molecular imaging agent for melanoma sentinel lymph node mapping,”
Ann. Surg. Oncol., 14
(2), 913
–921
(2007). http://dx.doi.org/10.1245/s10434-006-9099-4 1068-9265 Google Scholar
A. M. Wallaceet al.,
“Lymphoseek: a molecular radiopharmceutical for sentinel node detection,”
Ann. Surg. Oncol., 10
(5), 531
–538
(2003). http://dx.doi.org/10.1245/ASO.2003.07.012 1068-9265 Google Scholar
S. P. L. Leonget al.,
“A phase 2 study of []tilmanocept in the detection of sentinel lymph nodes in melanoma and breast cancer,”
Ann. Surg. Oncol., 18
(4), 961
–969
(2011). http://dx.doi.org/10.1245/s10434-010-1524-z 1068-9265 Google Scholar
V. K. Sondaket al.,
“Combined analysis of phase III trials evaluating []tilmanocept and vital blue dye for identification of sentinel lymph nodes in clinically node-negative cutaneous melanoma,”
Ann. Surg. Oncol., 20
(2), 680
–688
(2013). http://dx.doi.org/10.1245/s10434-012-2612-z 1068-9265 Google Scholar
A. M. Wallaceet al.,
“Comparative evaluation of []tilmanocept for sentinel lymph node mapping in breast cancer patients: result of two phase 3 trials,”
Ann. Surg. Oncol., 20
(8), 2590
–2599
(2013). http://dx.doi.org/10.1245/s10434-013-2887-8 1068-9265 Google Scholar
“-tilmanocept approval,”
J. Nucl. Med., 54
(5), 20N
(2013). JNMEAQ 0161-5505 Google Scholar
H. G. van der Poelet al.,
“Intraoperative laparoscopic fluorescence guidance to the sentinel lymph node in prostate cancer patients: clinical proof of concept of an integrated functional imaging approach using a multimodel tracer,”
Eur. Urol., 60
(4), 826
–833
(2011). http://dx.doi.org/10.1016/j.eururo.2011.03.024 EUURAV 0302-2838 Google Scholar
O. R. Brouweret al.,
“Comparing the hybrid fluorescent-radioactive tracer indocyanine green--nanocolloid with -nanocolloid for sentinel node identification: a validation study using lymphoscintigraphy and SPECT/CT,”
J. Nucl. Med., 53
(7), 1034
–1040
(2012). http://dx.doi.org/10.2967/jnumed.112.103127 JNMEAQ 0161-5505 Google Scholar
I. J. Foxet al.,
“A tricarbocyanine dye for continuous recording of dilution curves in whole blood independent of variations in blood oxygen saturation,”
Proc. Staff Meet. Mayo Clin., 32
(18), 478
–484
(1957). PSMMAF 0092-699X Google Scholar
Summary of Product Characteristics for Nanocoll, Kit for Radiopharmaceutical Preparation, GE Healthcare S.R.L., Milan, Italy
(2009). Google Scholar
S. E. StrandB. R. R. Persson,
“Quantitative lymphoscintigraphy I: Basic concepts for optimal uptake of radiocolloids in the parasternal lymph nodes of rabbits,”
J. Nucl. Med., 20
(10), 1038
–1046
(1979). JNMEAQ 0161-5505 Google Scholar
S. P. Stroupet al.,
“Preoperative sentinel lymph node mapping of the prostate using PET/CT fusion imaging and Ga-68-labeled tilmanocept in a dog model,”
Clin. Exp. Metastasis, 29
(7), 673
–680
(2012). http://dx.doi.org/10.1007/s10585-012-9498-9 CEXMD2 0262-0898 Google Scholar
R. Tinget al.,
“Fast F-18 labeling of a near-infrared fluorophore enables positron emission tomography and optical imaging of sentinel lymph nodes,”
Bioconjug. Chem., 21
(10), 1811
–1819
(2010). http://dx.doi.org/10.1021/bc1001328 BCCHES 1043-1802 Google Scholar
D. K. Emersonet al.,
“A receptor-targeted fluorescent radiopharmaceutical for multireporter sentinel lymph node imaging,”
Radiology, 265
(1), 186
–193
(2012). http://dx.doi.org/10.1148/radiol.12120638 RADLAX 0033-8419 Google Scholar
D. R. Veraet al.,
“Cy5.5-DTPA-galactosyl-dextran: a fluorescent probe for in vivo measurement of receptor biochemistry,”
Nucl. Med. Biol., 32
(7), 687
–693
(2005). http://dx.doi.org/10.1016/j.nucmedbio.2005.04.003 NMBIEO 0969-8051 Google Scholar
J. L. Oncley,
“Interpretation of data obtained in studies with isotope-labeled proteins of biological significance; chemical considerations,”
Fed. Proc., 16
(suppl 2), 3
–6
(1957). FEPRA7 0014-9446 Google Scholar
C. F. MearesD. A. Goodwin,
“Linking radiometals to proteins with bifunctional chelating agents,”
J. Protein Chem., 3
(2), 215
–228
(1984). http://dx.doi.org/10.1007/BF01040501 JPCHD2 0277-8033 Google Scholar
A. T. R. WilliamsS. A. WinfieldJ. N. Miller,
“Relative fluorescence quantum yields using a computer-controlled luminescence spectrometer,”
Analyst, 108
(1290), 1067
–1071
(1983). http://dx.doi.org/10.1039/an9830801067 ANLYAG 0365-4885 Google Scholar
P. R. Bevington,
“Propagation of errors,”
Data Reduction and Error Analysis for the Physical Sciences, 56
–65 McGraw-Hill, Dubuque, Iowa
(2003). Google Scholar
D. R. VeraE. S. WoodleR. C. Stadalnik,
“Kinetic sensitivity of a receptor-binding radiopharmaceutical: technetium-99m-galactosyl-neoglycoalbumin,”
J. Nucl. Med., 30
(9), 1519
–1530
(1989). JNMEAQ 0161-5505 Google Scholar
W. C. EckelmanM. BonardiW. A. Volkert,
“True radiotracers: are we approaching theoretical specific activity with Tc-99m and I-123?,”
Nucl. Med. Biol., 35
(5), 523
–527
(2008). http://dx.doi.org/10.1016/j.nucmedbio.2008.03.005 NMBIEO 0969-8051 Google Scholar
A. Azhdariniaet al.,
“Characterization of chemical, radiochemical and optical properties of a dual-labeled MMP-9 targeting peptide,”
Bioorgan. Med. Chem., 19
(12), 3769
–3776
(2011). http://dx.doi.org/10.1016/j.bmc.2011.04.054 BMECEP 0968-0896 Google Scholar
H. S. Choiet al.,
“Synthesis and in vivo fate of zwitterionic near-infrared fluorophores,”
Angew. Chem. Int. Edit., 50
(28), 6258
–6263
(2011). http://dx.doi.org/10.1002/anie.201102459 ACIEF5 1433-7851 Google Scholar
D. Toptygin,
“Effects of the solvent refractive index and its dispersion on the radioactive decay rate and extinction coefficient of a fluorescent solute,”
J. Fluoresc., 13
(3), 201
–219
(2003). http://dx.doi.org/10.1023/A:1025033731377 JOFLEN 1053-0509 Google Scholar
A. Mishraet al.,
“Cyanines during the 1990s: a review,”
Chem. Rev., 100
(6), 1973
–2011
(2000). http://dx.doi.org/10.1021/cr990402t CHREAY 0009-2665 Google Scholar
G. G. Guilbalt,
“General aspects of luminescence spectroscopy,”
Practical Fluorescence, 30
–32 Marcel Dekker Inc., New York
(1990). Google Scholar
H. J. Gruberet al.,
“Anomalous fluorescence enhancement of Cy3 and Cy3.5 versus anomalous fluorescence loss of Cy5 and Cy7 upon covalent linking to IgG and noncovalent binding to avidin,”
Bioconjug. Chem., 11
(5), 696
–704
(2000). http://dx.doi.org/10.1021/bc000015m BCCHES 1043-1802 Google Scholar
A. M. BasedowK. H. Ebert,
“Production, characterization, and solution properties of dextran fractions of narrow molecualar weight distributions,”
J. Polym. Sci. Pol. Sym., 66
(1), 101
–115
(1979). http://dx.doi.org/10.1002/polc.5070660113 Google Scholar
M. Keramidaset al.,
“Intraoperative near-infrared image-guided surgery for peritoneal carcinomatosis in a preclinical experimental model,”
Br. J. Surg., 97
(5), 737
–743
(2010). http://dx.doi.org/10.1002/bjs.6986 BJSUAM 0007-1323 Google Scholar
Y. Kawaguchiet al.,
“Hepatobiliary surgery guided by a novel fluorescent imaging technique for visualizing hepatic arteries, bile ducts, and liver cancers on color images,”
J. Am. Coll. Surgeons, 212
(6), E33
–E39
(2011). http://dx.doi.org/10.1016/j.jamcollsurg.2011.03.006 JACSEX 1072-7515 Google Scholar
B. N. Breyeret al.,
“Pelvic lymphadenectomy in prostate cancer,”
Prostate Cancer P. D., 11
(4), 320
–324
(2008). http://dx.doi.org/10.1038/pcan.2008.29 PCPDFW 1365-7852 Google Scholar
|