
|
|
1.IntroductionThe development of methods of interference microscopy (dSLIT, SLIM, DHM, WFDI, CPM) opened new perspectives in living cell imaging, largely due to high sensitivity and real-time recording.1–12 The phase imaging provides unique opportunity to dissect the biological object using normalized values of optical path difference (OPD). Measurement of this parameter, as well as refractivity, with exceptionally high accuracy allowed for registering the phase thickness () and volume-averaged refractive index of erythrocytes,3–8 local fluctuations of cell dynamics,1,2 and functional responses to extracellular stimuli.3–5,7,9–14 Still, the literature data on physical parameters of individual cellular compartments remain scarce (see Ref. 15 as an early study). One reason for limited information about phase characteristics of the nuclei and organelles might be lack of adequate analytical algorithms. The coherent phase microscopy (CPM)9–12 has been proved to be informative for quantitative real-time monitoring of a variety of processes in living pro- and eukaryotic cells.9,12–14 Using this method and a simplified spherical model of a -lymphocyte, we reported the numerical values of key physical parameters of the nucleus and organelles.13 In this study, we applied the developed algorithms to the analysis of a more complex object, that is, a human colon carcinoma cell (HCT116 cell line) exposed to the antitumor drug actinomycin (Act ). This treatment is known to cause an inhibition of gene transcription and segregation of components of the nucleoli, a highly dynamic system whose major functions are ribosomal biogenesis and regulation of extracellular stress responses.16–18 The phenomenon of “nucleolar stress” has been demonstrated to be one of the earliest hallmarks of cellular response to many toxins. We have shown that nucleolar stress can be detected by CPM.14 Here, we demonstrated that integral functions derived from phase images of intact and Act -treated cells, namely, the area and the phase volume , are valuable instruments for quantitative evaluation of physical parameters of subcellular structures. 2.Materials and MethodsAll reagents were purchased from Sigma-Aldrich unless specified otherwise. Human HCT116 colon carcinoma cell line (American Type Culture Collection, Manassas, Virginia) was propagated in Dulbecco’s modified Eagle’s medium supplemented with 5% fetal calf serum (Thermo Scientific HyClone, Logan, Utah), 2 mM l-glutamine, penicillin, and streptomycin at 37°C, 5% in a humidified atmosphere. Cells were plated on glass coverslips to reach 50% confluence by the day of the experiment. Act (1 μM) was added to the cells for up to 40 min followed by CPM. This treatment causes a drop of the rate of transcription down to 5% of its initial level as determined by incorporation of radioactive uridine analogue (A.A.S., unpublished results). After the completion of exposure, the specimens (30 to 100 randomly selected cells per each coverslip) were immediately examined using our original “Airyscan” microscope. In this device, we used a modified Linnik interferometer, the raster method of image recording, the linear-periodical modulation of the reference wave phase, and a compensation method of measurement of OPD in each pixel of the image. The microscope and the principle of CPM have been discussed elsewhere.9–12 One can hypothesize that findings described below can be obtained with phase microscopes other than Airyscan. The phase image of the cell in the plane can be described by the integral9–11 where and are the refractive indices of the object and environment, respectively. The function can be interpreted as a “projection” (onto the image plane) of an optically heterogeneous object with the refractive index .In the phase thickness profile , the parts with a bigger steepness correspond to the boundaries between organelles, thereby reflecting different refractivity of subcellular structures.13 The coordinates of these parts are termed “characteristic points” (CPs). Here, we use the functions of the area where and phase volume where .The function describes the area in the image cut by the plane , and the function describes the phase volume of the cell’s part projected on the area . The limits of the integral in Eqs. (2) and (3) are from to . The phase volume of the whole cell is the sum , where is geometric volume of the ’th organelle, and is its refractivity. Figure 1(a) shows the image of the cell (НСТ116 cell line) with nucleoli () and the phase thickness () at the boundaries of subcellular structures. The contour corresponds to the border between the nucleus and the nucleolus. In the middle part of this image, we picked a fragment (not shown) containing the projections of the nucleoli. The phase thickness profile [Fig. 1(b)] was obtained in the image section along the punctured line [Fig. 1(a)]. The value characterizes the bottom level of the cell, is its maximum value, is the “excessive” thickness of the nucleolus over the nucleus (), is the contrast of cell’s dense part, and is the nucleolar diameter. The three-dimensional image in Fig. 1(с) shows the contour of the border between the cell and extracellular medium, the contour in the image section cut by a horizontal plane, and its area in the projection on the plane and the phase volume of all subcellular structures projected onto the area . Fig. 1Major parameters of the cell’s phase image: physical background. (a) Image of an optically nonhomogeneous cell (HCT116 colon carcinoma cell line) is represented by a two-dimensional distribution of the phase thickness. The contours, , , and , show the borders of the cytoplasm, the nucleus, and three nucleoli (). These contours divide the image plane into the zones with minimal or no change of the phase thickness across the zone. (b) Shape of the phase thickness profile along the punctured line [Fig. 1(a)] reflects optical heterogeneity of the cell. The most prominent changes proportional to the difference between refractivity indices of subcellular structures are detectable at their boundaries. Shown in the profile are maximal value , the “excessive” thickness of the nucleolus , and phase contrast of the optically dense part of the cell. (c) Three-dimensional image of the НСТ116 cell shows the contour, , in the horizontal section and its area in the projection onto the plane (), and the phase volume of the nucleolus projected onto the area . (d) On the graphs of and the characteristic points (CP) with double indices show values at the borders of zones. The zone 0 corresponds to the extracellular area adjacent to the plasma membrane. Zones indexed as 1 to 4 correspond to the organelle-free cytoplasm, the cytoplasm with organelles, the nucleus, and the nucleoli, respectively. The number of these CP and their positions depends on optical heterogeneity of the cell. The values of the phase thickness () and area in CP were used to identify the borders of subcellular structures in the image . In the area between and (zone 4) the nucleoli make impact into and functions. 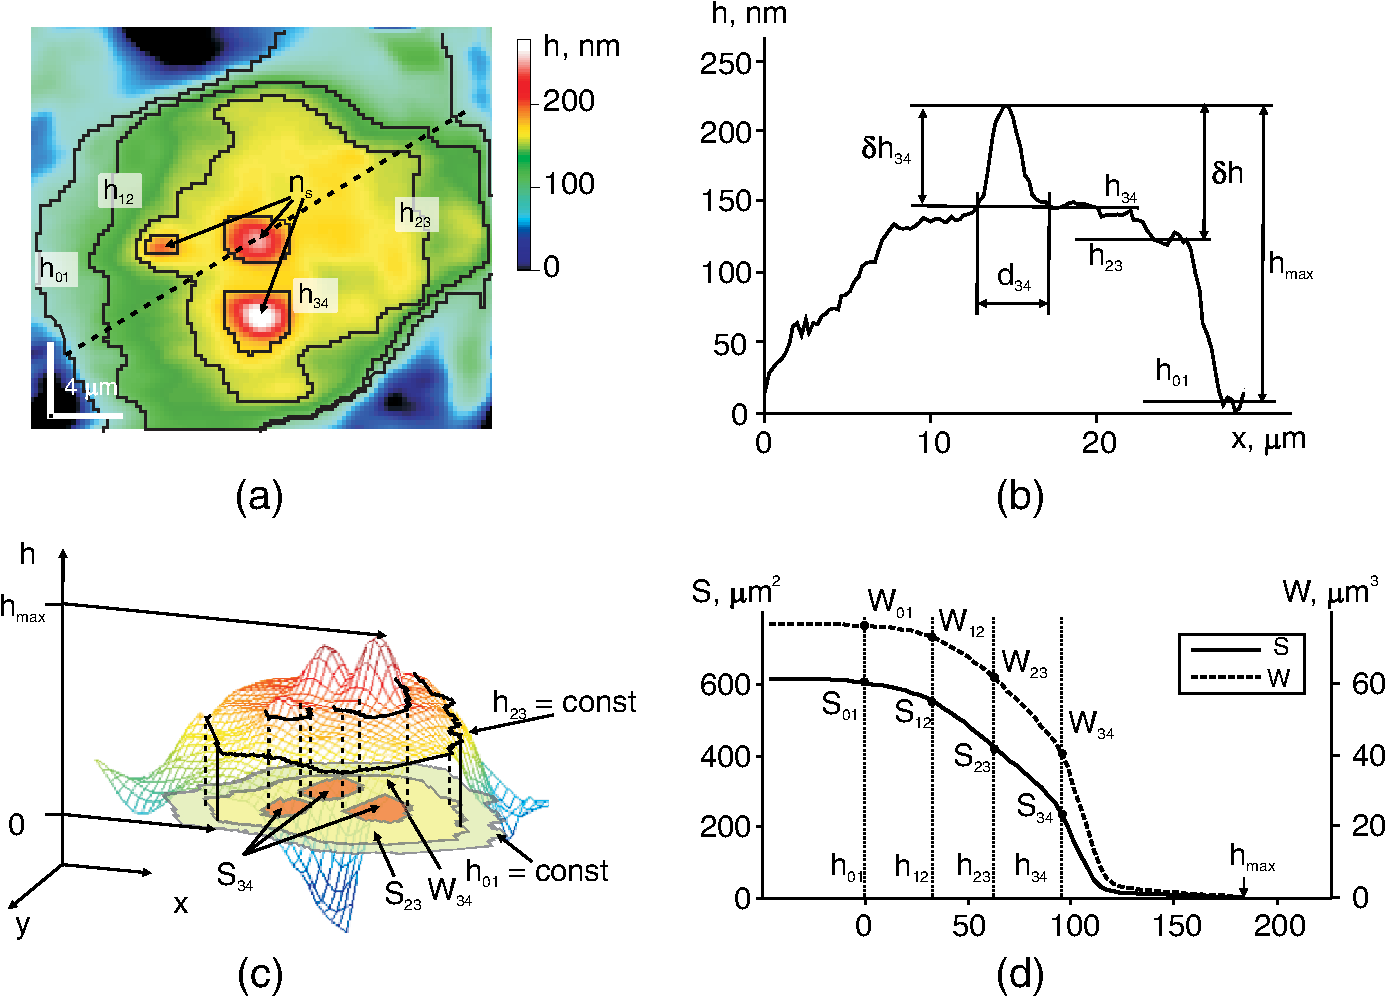 The graphs of and functions are shown in Fig. 1(d). CP and their abscises () determine the values of the phase thickness at the borders of subcellular structures. The contours divide the image plane into the “zones” within equal (or slowly changing) phase thickness values. Importantly, in the right parts of graphs, the difference characterizes the excessive phase thickness in the zone 4 within the area , which contains the image of the nucleoli. Together with the area (), we also used the equivalent diameter , where . The set of CP parameters (, , , and ) has been termed by us a “phase portrait” of the cell.13 In this study, we performed quantitative analysis of a fragment of the cell’s image, not of the entire cell. The indices of parameters , , , and (Figs. 2 and 3) should be related to this fragment. Fig. 2Phase image (a fragment) of intact HCT116 cell. (a) The nucleoli () are detectable in the region of high values of the phase thickness. The punctured line shows the section of the phase thickness profile through the nucleolus. (b) The nucleolus with the diameter and the “excessive” phase thickness in the phase thickness profile is shown. (c) The CP on graphs and are shown. The coordinates of CP at the zone boundaries provide the values of the area , phase thickness and phase volume . The area between and represents the zone 4 where the nucleoli make impact into and functions. (d) Values of abscises on graphs and are determined by the positions of maxima of derivative .  Fig. 3Positions of CP of integral functions in the phase image of Act -treated HCT116 cell. (a) Note a decreased contrast and disappearance of the nucleolus in the phase thickness profile. (b) Note the absence of the extended () portion and a decreased phase thickness on the graphs of and functions.  3.ResultsThe fragment of the phase image of an untreated HCT116 cell [Fig. 2(a)] contains clearly detectable nucleoli [zone 4, Fig. 1(a)]. The diameter of the nucleolus in the profile [Fig. 2(b)] was . The shape of this nucleolus was close to spherical. The “excess” of nucleolar phase thickness was . This value reflected the difference between refractivity of the nucleolus () and nuclei (). Suggesting a spherical shape of the nucleolus, we can estimate the excess of refractivity relative to the nucleus. The estimation of absolute nucleolar refractivity came from the values of refractivity of the nucleus () or the dense part () of the cell.13 The values were close to the respective numbers for the dense part of a -lymphocyte.13 Figure 2(c) shows the graphs of functions and for the image fragment with the coordinates of CP. We used maxima of function [see Fig. 2(d)] to determine the abscises of CP. The phase contrast of the nucleolus () corresponded to the interval . It was the same as in the phase thickness profile [Fig. 2(b)]. The coordinates of CP allowed us to evaluate a number of physical parameters at the boundaries of subcellular compartments.13 At the boundary of the zone 4 onto which the nucleolus is projected [Fig. 2(c)], the area and phase volume were and . An impact of other organelles should be considered to explain relatively big value of at the boundary of the fourth zone. Act caused changes of the phase image rapidly after the beginning of cell exposure. In particular, the phase contrast of the dense part of the cell changed with time. No contrast nucleolus was visible in the phase thickness profile [Fig. 3(a)]. The absence of an extended () portion on the graphs of integral functions and [Fig. 3(b)], a low contrast , and a decreased characterizes the nucleolar stress (essentially transcriptional block and segregation of nucleolar components) induced by Act . 4.DiscussionThe approach reported here is based on the representation of a eukaryotic cell as an optically nonhomogeneous object whose structural elements are physically distinguishable. These previously unknown advantages of phase images have been illustrated in a model of a -lymphocyte where CPM allowed for identification of boundaries between the organelles.13 The novelty of present findings is the quantitative dissection of morphophysiological changes in the cell exposed to an anticancer drug. The nucleoli rapidly respond to a variety of stress stimuli by reorganizing their architecture.17,18 One important prerequisite for this function is the mobility of nucleolar proteins, that is, their ability to rapidly migrate to the perinuclear region and back to the nucleus in response to a variety of extracellular stimuli. Under physiological conditions, this protein redistribution is aimed, in part, at stabilization of ribosomal RNA. When the stimulus persists, segregation of nucleolar components would halt RNA polymerase I–mediated transcription. We have demonstrated that CPM-assisted imaging of living human tumor cells (cultured or isolated from biopsies) followed by quantitative analysis of phase images strongly supported the notion that nucleolar stress is a part of general stress response, and a decreased nucleolar phase thickness is a common biophysical feature of this phenomenon.14 In this study, we performed a detailed analysis of nucleolar stress by introducing new parameters of the phase image, in particular, the coordinates of CP, the values of and functions, equivalent diameters of subcellular zones, excessive phase thickness, and refractivity. Taken together, these parameters comprised a phase portrait of nucleolar stress. To our knowledge, this report is the first attempt to analyze nucleolar stress in its entirety by calculating numerical values for a set of functionally significant parameters. The fact that phase image parameters reflect cellular responses to external cues has been demonstrated earlier.1–3,6,9–14,19 Importantly, the and functions emerged as an important tool for monitoring local dynamics of nucleolar components. Such a dissection of phase portrait by high-resolution CPM is significant because the changes induced by Act are neither monotonous nor are they uniformly distributed across the nucleus; general trend is a decrease of phase thickness and refractivity (Ref. 14; this study). Thus, CPM can be informative for the analysis of a complex nucleolar dynamics that includes, but is not limited to, time-dependent chromatin remodeling (i.e., condensation/decondensation) and protein traffic. Also, the state of water during nucleolar stress remains an unresolved issue20; however, the impact of this particular factor into the phase thickness of the cell is critical. 5.ConclusionThe quantitative representation of phase images of a micro-object is a major methodological advantage of CPM. At present, the subcellular structure of a variety of prokaryotic organisms and individual eukaryotic cells has been qualitatively characterized. It seems logical to develop the numerical methods of image analysis of cellular responses to environmental cues. In this study, we introduced the and functions and demonstrated their applicability for the analysis of the previously reported phenomenon of nucleolar stress.14 We believe that the significance of and functions is not limited to this particular model. This tool can provide valuable quantitative information largely due to independence of these functions on an optical model of the micro-object. In the living cell, the and functions reflect its optical heterogeneity by describing the variability of physical parameters of intracellular compartments. Therefore, these functions can be considered a general tool for phase image analysis of cell structure and dynamics. AcknowledgmentsThis work was supported by Grant No. 13-02-00278 of Russian Foundation for Basic Research. ReferencesY. Parket al.,
“Metabolic remodeling of the human red blood cell membrane,”
Proc. Natl. Acad. Sci. U.S.A., 107
(4), 1289
–1294
(2010). http://dx.doi.org/10.1073/pnas.0910785107 1091-6490 Google Scholar
Y. Parket al.,
“Static and dynamic light scattering of healthy malaria-parasite invaded red blood cells,”
J. Biomed. Opt., 15
(2), 020506
(2010). http://dx.doi.org/10.1117/1.3369966 JBOPFO 1083-3668 Google Scholar
Y. Parket al.,
“Refractive index maps and membrane dynamics of human red blood cells parasitized by Plasmodium falciparum,”
Proc. Natl. Acad. Sci. U.S.A., 105
(37), 13730
–13753
(2008). http://dx.doi.org/10.1073/pnas.0806100105 1091-6490 Google Scholar
B. Rappazet al.,
“Erythrocytes volume and refractive index measurement with a digital holographic microscope,”
Proc. SPIE, 6445 644509
(2007). http://dx.doi.org/10.1117/12.700463 PSISDG 0277-786X Google Scholar
B. Rappazet al.,
“Measurement of the integral refractive index and dynamic cell morphometry of living cells with digital holographic microscopy,”
Opt. Express, 13
(23), 9361
–9373
(2005). http://dx.doi.org/10.1364/OPEX.13.009361 OPEXFF 1094-4087 Google Scholar
M. MirK. TangellaG. Popescu,
“Blood testing at the single cell level using quantitative phase and amplitude microscopy,”
Biomed. Opt. Express, 2
(12), 3259
–3266
(2011). http://dx.doi.org/10.1364/BOE.2.003259 BOEICL 2156-7085 Google Scholar
Z. Wanget al.,
“Tissue refractive index as marker of disease,”
J. Biomed. Opt., 16
(11), 116017
(2011). http://dx.doi.org/10.1117/1.3656732 JBOPFO 1083-3668 Google Scholar
Z. Wanget al.,
“Spatial light interference microscopy (SLIM),”
Opt. Express, 19
(2), 1016
–1026
(2011). http://dx.doi.org/10.1364/OE.19.001016 OPEXFF 1094-4087 Google Scholar
V. P. Tychinsky,
“Dynamic phase microscopy: is a ‘dialog’ with the cell possible?,”
Physics-Uspekhi, 50
(5), 513
–528
(2007). http://dx.doi.org/10.1070/PU2007v050n05ABEH006222 PHUSEY 1063-7869 Google Scholar
V. Tychinsky,
“The metabolic component of cellular refractivity and its importance for optical cytometry,”
J. Biophotonics, 2
(8–9), 494
–504
(2009). http://dx.doi.org/10.1002/jbio.v2:8/9 JBOIBX 1864-063X Google Scholar
V.P. TychinskyA.N. Tikhonov,
“Interference microscopy in cell biophysics. Principles and methodological aspects of coherent phase microscopy,”
Cell Biochem. Biophys., 58
(3), 107
–116
(2010). http://dx.doi.org/10.1007/s12013-010-9114-z CBBIFV 1085-9195 Google Scholar
V.P. TychinskyA.N. Tikhonov,
“Visualization of individual cells and energy-transducing organelles,”
Cell Biochem. Biophys., 58
(3), 117
–128
(2010). http://dx.doi.org/10.1007/s12013-010-9115-y CBBIFV 1085-9195 Google Scholar
V.P. Tychinskyet al.,
“Dissecting eukaryotic cells by coherent phase microscopy: a quantitative analysis of quiescent and activated -lymphocytes,”
J. Biomed. Opt., 17
(7), 076020
(2012). http://dx.doi.org/10.1117/1.JBO.17.7.076020 JBOPFO 1083-3668 Google Scholar
V. P. Tychinskyet al.,
“Quantitative real time analysis of the ‘nucleolar stress’ by coherent phase microscopy,”
J. Biomed. Opt., 13
(6), 064032
(2008). http://dx.doi.org/10.1117/1.3042241 JBOPFO 1083-3668 Google Scholar
Y. HiramotoS. ShumeiS. Yoko,
“Refractive index of the protoplasm in sea urchin eggs,”
Dev. Growth Differ., 21
(2), 141
–153
(1979). http://dx.doi.org/10.1111/dgd.1979.21.issue-2 DGDFA5 0012-1592 Google Scholar
C. DeisenrothY. Zhang,
“Ribosome biogenesis surveillance: probing the ribosomal protein-Mdm2-p53 pathway,”
Oncogene, 29
(30), 4253
–4260
(2010). http://dx.doi.org/10.1038/onc.2010.189 ONCNES 0950-9232 Google Scholar
S. Boulonet al.,
“The nucleolus under stress,”
Mol. Cell, 40
(2), 216
–227
(2010). http://dx.doi.org/10.1016/j.molcel.2010.09.024 MOCEFL 1097-2765 Google Scholar
D. Ruggero,
“Revisiting the nucleolus: from marker to dynamic integrator of cancer signaling,”
Sci. Signal., 5
(241), 1
–3
(2012). http://dx.doi.org/10.1126/scisignal.2003477 1945-0877 Google Scholar
N. Lueet al.,
“Quantitative phase imaging of living cells using fast Fourier phase microscopy,”
Appl. Opt., 46
(10), 1836
–1842
(2007). http://dx.doi.org/10.1364/AO.46.001836 APOPAI 0003-6935 Google Scholar
V. Tychinsky,
“High electric susceptibility is the signature of structured water-containing objects,”
J. Water, 3 95
–99
(2011). Google Scholar
|


