
|
|
1.IntroductionDiffuse optical tomography (DOT) with near-infrared (NIR) light (600 to 1000 nm) transmitted/reflected through up to 12 cm of tissue can be used to analyze and quantify vascular and tissue features such as oxyhemoglobin, deoxyhemoglobin, water, and lipids.1–4 This functional approach to imaging can be used in pathophysiological change monitoring of breast tissue while doing a magnetic resonance imaging (MRI) scan.5–10 In order to achieve accurate spectroscopy of these molecules, ideally a broad range of wavelengths across the NIR would be used. In this study, the system integration to extend the spectral range up to 948 nm wavelength is demonstrated through the parallel integration of sensitive photodiode (PD) detectors alongside a set of photomultiplier tubes (PMTs) in a unique rotary switch array, optimized for high dynamic range data acquisition, such as NIR breast imaging. The challenge in NIR breast imaging is to provide a robust system that has appropriate wavelength coverage with appropriate dynamic range capability for the discrete sizes and attenuations possible between women’s breasts imaged. Most DOT systems operate at two to four wavelengths11 and, due to the limited sensitivity of PMT detectors, use light between 650 and 850 nm.12–14 Later systems have evolved to include additional wavelengths. However, the larger lipid and water absorption peaks both lie at 930 and 975 nm, respectively.15 Recovering the water and lipid content is not that accurate without coverage in this range. Adding these wavelengths has been shown to improve the recovery of both chromophore concentrations in breast spectroscopy16,17 as well as NIR breast tomography in an earlier version of the system.15,18 This earlier attempt was not on a compact system, but rather utilized a large spectrometer array, which was for initial prototype testing. In the current rendition, a more compact system prototype was engineered to test the ability to measure these signals and quantify water and lipid. Frequency-domain (FD) measurements using intensity-modulated sources are extremely stable and cost effective, but have the inherent limitation that most high dynamic range FD systems are based upon PMT detection. PMT detectors in general have low photon detection efficiency. The highest-gain PMTs have wavelength response curves that fall off dramatically above 825 nm, and so while these systems provide excellent separation of and , they do not provide for the best wavelength coverage for optimal spectroscopy. The use of steady-state continuous-wave (CW or low frequency modulated) light to measure the attenuation of light at longer wavelengths can supplement FD measurements, if combined in a manner that utilizes the known spectral shapes as prior estimates of the key molecules to be quantified.14,18 The system developed here was designed with the idea of sequential illumination for FD followed by CW, allowing the widest spectral range possible for MRI-guided NIR spectroscopy of breast cancer. In this study, a new NIR optical parallel detection system of both frequency and CW domains was developed to improve the data quality and accuracy in recovery of all breast optical properties. In order to extend the measurements to longer wavelengths while maintaining the system in a compact and mobilized manner, rather than using CCDs for each detector as previously tried,15,18 solid-state silicon PD detectors with a large active area () were used. These PDs have very high sensitivity (noise-equivalent ) although they have significantly smaller temporal bandwidth (1 KHz) as compared to PMTs. Therefore, amplitude and phase measurements were used with the FD instruments and CW measurements were obtained with the PD detectors, but both were coupled into the same breast fiber array, allowing flexible switching between them. The acquisition time for all nine wavelengths from 660 to 948 nm is 12 min. The dynamic ranges of the detected signal are and for PMT and PD detectors, respectively. Compared to the previous detection system, the SNR of FD detection was improved by nearly through the addition of an RF amplifier and utilization of programmable gain. The final system allowed imaging at nine NIR wavelengths and provided MRI-guided spectroscopy of breast tissues with tomographic recovery of hemoglobin, oxygen saturation, water, lipids, and scattering parameters. The new prototype is outlined in detail here and system performance is analyzed. 2.Materials and MethodsThe hybrid imaging system, shown in Fig. 1(a), was designed to accommodate FD (Sec. 2.1) and CW measurements (Sec. 2.2). All the FD/CW imaging components along with the rotary switch array (Sec. 2.3)and the data acquisition (Sec. 2.4) and control software are housed inside a single portable rack. Fiber optic bundles held in thick cables connect the light detectors to the patient breast interface (Sec. 2.6). In order to test and validate the system, experiments on gelatin phantoms (Sec. 2.7) and a healthy subject (Sec. 2.8) were performed. Fig. 1FD/CW hybrid imaging system. A photo of the complete system is shown in (a). The system diagram is shown in (b). A photo of human subject being imaged using the system. 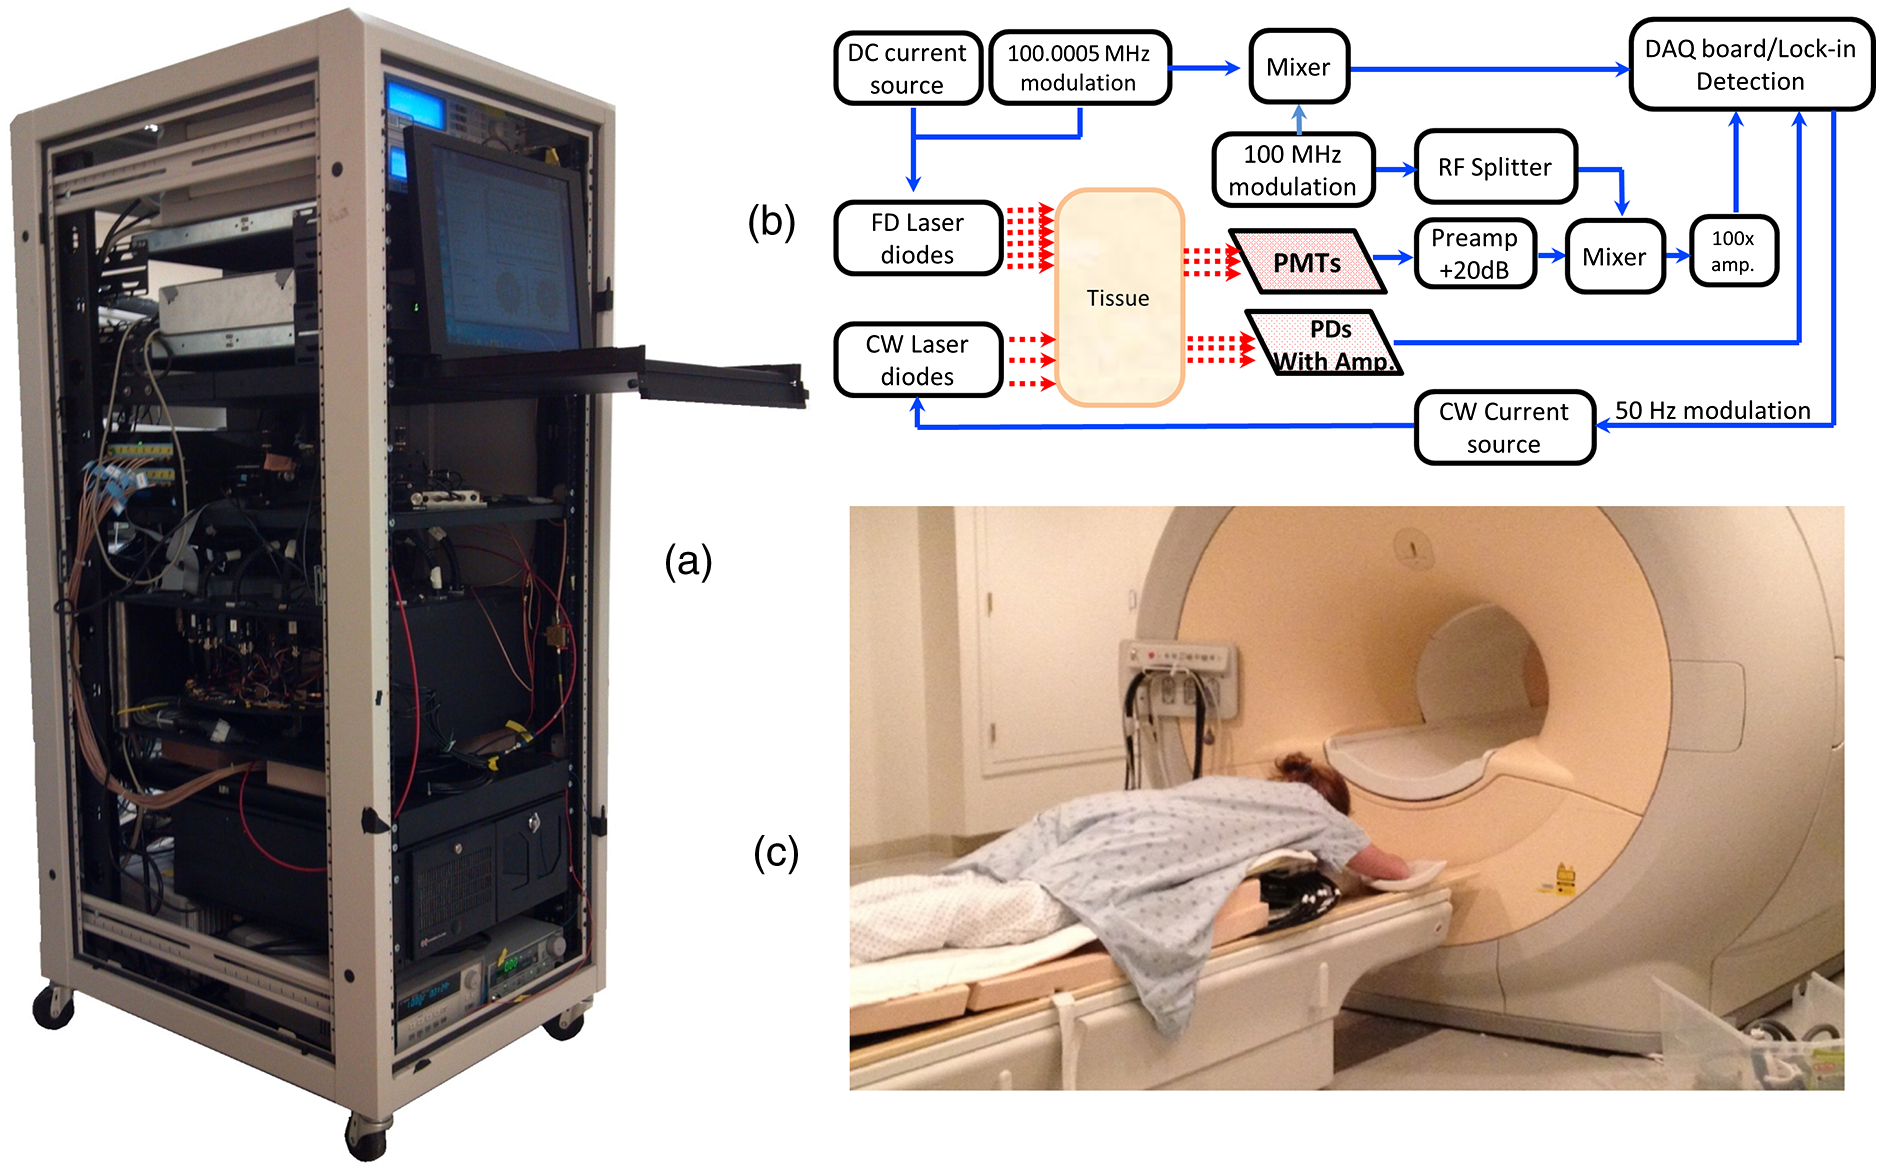 A diagram of the hybrid system is shown Fig. 1(b). Detailed description of the components and their interconnection is described below. In brief, a bias-tee combines DC current along with an RF signal () in order to drive the FD laser diodes, while a laser current module drives the CW laser diodes. The output of the lasers is directed to the tissue via fiber optic cables. The transmitted signal is recorded using PMT detectors for FD measurements and then followed by PD modules for the CW measurements that are used with the longer wavelengths. The output of the PD modules is connected directly to the data acquisition (DAQ) board, while the output of the PMT detectors is converted to voltage, amplified, and then heterodyned to a lower-frequency signal using mixers. The output of the mixer is amplified further and then is read by the DAQ board. 2.1.FD Detector ChannelsThe PMT modules were used with wavelengths below 850 nm for FD measurements. The instrumentation for this portion, illustrated in the schematics shown in Fig. 1(b), is nearly identical to our previously published system,13 with two important upgrades, including (1) a 20 dB amplifier that was added after each PMT and (2) a programmable gain amplifier on the DAQ card. The light source consists of six intensity-modulated (100 MHz) laser diodes that cover the main spectral range of the four chromophores under study (660, 735, 785, 808, 826, and 849 nm). A bias-T combines DC bias current from an ILX Lightwave laser driver with a 100 MHz AC signal from a Marconi function generator in order to drive the laser diodes. The modulation depth of the lasers is 25 to 40%. The lasers are activated one at a time by digitally controlling a six-way RF switch, which passes the biased current to the selected laser diode. Each laser diode is mounted on a fiber launch module (Thorlabs, Princeton, New Jersey) where the output of each laser is directed into the input of a fiber optic combiner (Fiberguide, Stirling, New Jersey). The output fiber is then directed to the rotating stage, discussed in Sec. 2.3, where it acts as the source fiber in the system. PMT (H9305-3, Hamamatsu, Japan) detectors with a 1.4 ns rise time are used to acquire the attenuated laser light that is transmitted through tissue. The spectral response range of the PMTs is 185 to 900 nm with peak sensitivity at 450 nm. The sensitivity of the PMT decreases rapidly at wavelengths longer than 850. Power to all PMTs is supplied from a single power supply. Thin film filters (Kodal Wratten Red 25, Edmund Optics) are installed on the detectors window in order to block visible light below 600 nm from entering the PMTs. The RF output of the PMT detectors is amplified using a 20 dB RF low-noise preamplifier (Minicircuits), which also filters out the DC component of the signal. Adding this amplifier has increased the SNR by a factor of 100. The output of the preamplifier is then heterodyned with a local oscillator (LO) reference signal (100 MHz) in order to down-convert the 100.0005 MHz PMT output and produce an intermediate frequency (IF) signal (500 Hz) that can be processed more easily by the DAQ cards. The IF output of the mixer is then amplified () and filtered by a differential-amplifier/3-pole Butterworth low-pass filter circuit in order to reduce high-frequency noise before it is measured by the DAQ card. The resulting output signal is read by the DAQ card where it is phase-locked with a reference signal in order to obtain the phase and amplitude of the attenuated signal detected by the PMT. The LO signal is obtained by dividing the power of a 13 dBm 100 MHz function generator output into 15 signals using a RF splitter. Each output of the RF splitter is then connected to the LO input of the mixers. One output is terminated via a 50 Ohm terminator since only 15 mixers are used. The two signal generators are synchronized and the reference signal used for the phase-lock detection is obtained by mixing a portion of the output of each signal generator. This reference signal is then connected to the DAQ card where the phase from all channels is compared with the phase of the reference signal. 2.2.CW Detector ChannelsThe CW measurement system extends the range of wavelengths used to image the breast in order to better quantify the chromophore concentrations. The system consists of three laser diodes (903, 912, and 948 nm) and 15 silicon PD modules that are housed in the same enclosure as the FD components. The output of the laser diodes is intensity-modulated at 50 Hz in order to obtain better SNR through software-based lock-in detection as shown in Fig. 1(b). The detectors used are high-precision silicon PD modules that incorporate a current-to-voltage amplifier within the module (C10439-03, Hamamatsu, Japan). These modules have an active area of and a large spectral response range (190 to 1100 nm) with peak sensitivity at 960 nm. The sensitivity of the PD modules is switchable between a low and a high range. The two PDs nearest to the laser source are set to low sensitivity in order to avoid light saturation of the modules while the remaining modules are set to high sensitivity. Thin film filters (Kodak-87 Wratten, Edmund Optics, Barrington, NJ) are installed on the detector’s window in order to block light below 800 nm. All PDs are driven by a single dual-output power supply. CW measurements only extract the change in amplitude of the light through tissue. Therefore, unlike the FD measurements, no additional components were needed to connect to the PD modules. The output of the PDs is connected directly to the DAQ cards. 2.3.Rotary Mechanical Switch ArrayA portable rack contains all the FD and CW components including laser diodes, signal generators, computer, and the detectors array. The detectors array is housed inside a custom mechanical switch as shown in Fig. 2, which was designed using SolidWorks and built in-house using ¼”-aluminum sheets. The assembly () was designed to accommodate both PD and PMT modules. The PD and PMT modules are mounted on the top circular plate, while the RF splitter and mixers are mounted on the bottom circular plate. Both circular plates rotate via a high-precision motor mounted on the bottom circular plate as shown in Fig. 2(a). This allows multiplexing of the laser source and detectors to 16 different positions, giving a total of 240 measurements ( measurements) for each wavelength. The detector’s position is always fixed relative to the source position. Fiber optic cables connect the patient interface to the top square plate of the switch assembly. A small gap exists between the top square plate and the circular plate holding the detectors, which allows the circular plate to rotate. Light from the fiber optic cables is multiplexed to all detectors through holes in both the square and circular plates that align with each other as the circular plates rotate. The fibers remain fixed and thus the same fiber that was used for the source is also used for detection. 2.4.Computer and Data AcquisitionA computer running custom LabVIEW software controls the system components and enables automation of the entire system. The program allows the user to select the lasers to be used for imaging and provides advanced options that enable the user to run different customizable scans. The LabVIEW software controls the signal generators via general purpose interface bus, the rotary stage through RS232, and two peripheral component interface (PCI) DAQ cards. A 16-bit 64-channel multifunction DAQ card (NI-PCI 6031E, National Instruments, Austin, TX) is used for acquiring the data from the PMT. The FD signals are sampled at 4 KHz and are acquired. The signal from each FD measurement is then phase-locked with a reference signal that is also connected to the same DAQ card. The phase and amplitude of each channel is analyzed and recorded. The CW data are sampled at 4 KHz and are acquired. The multifunction DAQ card used has a programmable gain amplifier. The use of this digitally controlled amplifier ensures that the analog FD/CW signals use the maximum resolution of the analog-to-digital converter (ADC) of the DAQ card, which improves the signal’s accuracy. Using this amplifier has increased the SNR by a factor of 10. During acquisition, data from each channel is sampled for 100 ms in order to find the maximum and minimum of each channel. Once this range is found, the appropriate gain is selected for each individual channel and the signals are acquired again. The gain of the PMT detectors is controlled by a 16-bit 16-channel static analog voltage output card (NI PCI-6703, National Instruments). The gain is set by applying voltages between 0.3 and 1.1 V in increments of 0.1 V. 2.5.CalibrationCalibration is a critical step needed in order to get meaningful linear response of voltage data from the PD/PMT detector optical measurements. This takes into account amplitude losses and phase delays that result from differences in the detector’s response, optical fiber losses, and RF components performance. The goal of the calibration process is to produce the same response (amplitude and phase measurements) for equivalent inputs across the entire dynamic range of the detectors. Three types of calibrations were used as described below. 2.5.1.Individual PMT and PD responsivity correctionDetector responsivity calibration was used to account for the differences in PMT responses to the same optical signal. The relative sensitivity of each optical detector was quantified using a single light source that was placed in the radial center of a cylindrical homogenous phantom. The response of all the detectors was measured and a scaling factor was obtained, which corrects for slight differences of the intensity detected. However, the signal detected is affected not only by differences in the detector response and associated RF-circuitry, but also by differences in the dispersion properties of the fiber bundles. Since the detectors rotate while the fiber bundles remain fixed, the scaling factors were obtained for each of the 16 different source positions in order to correct for fiber bundle differences. 2.5.2.PMT gain calibrationDifferent light levels reach the PMT detectors depending on their position from the source fiber. In order to account for this difference, the PMT offers a large dynamic range. The large dynamic range of a PMT is in part due to the ability to manipulate gain, which affects the light level that can be detected over many orders of magnitude. But critically, the response of the PMTs at different gain levels must be calibrated if the signal is to be interpreted in a linear manner across these orders of magnitude. The calibration process that was used is similar to the calibration process that was described by Mastanduno et al.19 2.5.3.Homogenous calibrationHomogenous calibration is used to compensate for optical fiber losses and any small errors that might develop during the detector calibration process, and also allows a better match of the data to the forward diffusion model in the image reconstruction process. This calibration also needs to account for the two different detectors used. Prior to each experiment, a phantom with optical properties similar to the breast (or to a heterogeneous phantom) is imaged with both types of detectors using all available wavelengths. The data set consisting of the logarithm of the intensity and phase shift from the homogenous phantom experiments are subtracted from a calculated diffusion model of the same phantom region, and this is then added onto future measurements of heterogeneous phantoms or tissues that were imaged. This provides a fiber-by-fiber small correction, assuming additive errors can be fixed this way. 2.6.Patient InterfaceFigure 3 shows the schematic of two different breast interface geometries. Instead of the circular patient interface [Fig. 3(a)] that has been used with our previous generation imaging system,13 a pentagonal patient interface [Fig. 3(b)] was designed to accommodate various breast sizes to be imaged inside the magnetic resonance (MR) room.20 One end of each of the 16 long fiber bundles is coupled into a breast MR coil and contacts the breast with limited pressure for simultaneous MR and optical imaging of patients/phantoms. The other end of each of these 16 fiber bundles is passed through a conduit in the wall and connects the source and detectors in the imaging assembly located outside the MR room. More details about this new interface are discussed elsewhere.20 2.7.Phantom ExperimentsIn order to study the system in detail, tissue phantom experiments were performed on a gelatin phantom mimicking breast tissue, with a 2 cm cylindrical inclusion within, which could have varying optical properties. The bulk optical properties of the phantom were similar to those of breast tissue. It was constructed using water, type 1 agarose, 1% intralipid, and whole porcine blood at a background concentration of 15 μM. The hematocrit level of the blood was measured by a Hemocue device to be of the blood. The inclusion was filled with varying concentrations of blood from 0 up to 45 μM in 5 μM increments, in order to vary the absorption systematically. After each concentration, the phantom was imaged with all nine wavelengths. Images were reconstructed using Nirfast software21 to determine the accuracy in recovery of the blood concentration of each run as compared to the expected concentrations. Briefly, the difference between measured data and a diffusion-based model of light propagation through the medium22–24 is minimized to yield estimates of the optical properties of the tissue of interest. The three-dimensional reconstruction algorithm was designed to employ a priori information gained from MRI to guide the optical solution as outlined in previous work by Carpenter et al.25,26 This technique makes the assumption that each of the segmented regions defined from the MR, adipose, and fibroglandular have similar optical properties throughout. We simplify the image reconstruction problem computationally by completely eliminating variation within regions and, thus, are able to quantify optical properties between regions but not within them.26 We also use spectral priors in the reconstruction, solving directly for tissue chromophores rather than absorption () and scattering () coefficients at each wavelength as outlined in previous work.23–25,27 These methods were applied to both phantom and human subject image reconstruction. 2.8.Healthy Subject ImagingAll human subjects imaging has been carried out under an institutional review board approved protocol, #11487, and subjects have given informed consent prior to entering the study. Imaging protocol for the human subject examination was approved by the Committee for the Protection of Human Subjects at Dartmouth-Hitchcock Medical Center. The subjects were positioned into the clinical MR breast coil and optical fibers were moved into contact with the breast tissue. If a fiber was unable to contact the breast, data from that fiber were omitted. Coregistration between optical and MR images was done using MR fiducial markers in the plane of the fibers and bilateral MR images in the axial geometry. Optical and MR data were collected concurrently, with data collections taking 12 and 30 min, respectively, and reconstructed using the methods outlined above. 3.Results3.1.Detection Linearity/LimitsIn order to determine the sensitivity and linearity of each detector, a fixed optical signal along with neutral density (ND) filters were used to look at the detector’s response as a function of incident light power. The light power was increased incrementally by removing the ND filters from the path of the laser beam while the AC amplitude and phase response of the PMTs and the AC amplitude of the PDs were recorded. The AC signal error and phase error as a function of incident power for one of the PMTs for this system is shown in Fig. 4. The results are compared to the previous generation system built in our lab13 in order to demonstrate the improvement of the new system over the older one. The full dynamic range of the PMTs was about with the lowest signal detected at around 0.01 nW using the highest gain setting. Adding the RF amplifiers to the system has helped in increasing the SNR of the FD measurements. Fig. 4Standard deviation of the natural log of the amplitude (ln AC) (a) as well as the standard deviation of the phase (b) of the photomultiplier tube as a function of incident light power. The blue marks represent the results for the new system, while the red marks represent the results for the system built by McBride et al.  Figure 5 shows the response of one of the PDs as a function of light power for the two gain settings of the PD. The low range exhibits linearity over the range of 0.1 nW up to 2 uW, while the high gain setting exhibits linearity over the range of 1 pW up to 20 nW. Thus, the full dynamic range of the PDs is . 3.2.Gain SettingsPMT detectors nearest to the light source receive orders of magnitude more light than detectors that are farther away. In order to account for this variability, the gain of the PMT detectors must be adjusted accordingly. The gain of the PMT detectors is adjusted by adjusting an analog control voltage input, which is controlled via a static analog voltage output NI-6073 card from National Instruments. Prior to acquisition, the PMT would be set to the lowest gain possible (0.3 V). The gain of each PMT is then increased in 0.1 V increments while monitoring the PMT output AC signal. Once the AC signal reaches a user-defined threshold, the gain of that particular PMT is set. The process continues until all PMT gain values have been set or until the gain reaches a maximum user-defined value. The system waits for 100 ms during the process of finding the proper gain before acquiring and analyzing the AC signal. However, once the gains have been set for all PMTs, the system waits for an additional 1000 ms to ensure better stability of all PMTs. As mentioned previously, the sensitivity of the PD modules is switchable between a low and a high range using a switch on the back of the PD module. The two PDs nearest to the laser source receive much more light than the remaining modules and therefore had to be set to low-sensitivity range in order to avoid detector saturation. A high-sensitivity setting was used for the remaining modules since the amount of light received by these detectors is below the saturation point of the high-sensitivity range. In order to improve the performance of the system even further, a programmable amplifier on board the DAQ card was used. During acquisition, data from each channel (FD and CW) is sampled for 100 ms in order to find the maximum and minimum of each channel. Once this range is found, the appropriate gain is selected for each individual channel and the signals are acquired again. This ensures that the maximum ADC resolution is used while acquiring all signals. 3.3.Cross-TalkThere are two types of cross-talk that may affect the results of the system. The first type is an inherent property of the PMT, where increasing the light intensity of a signal while maintaining the phase influences the phase readout. This is due to space charge effects of the PMT. In order to minimize this cross-talk, we start the PMT at the lowest possible gain and increase the gain in discrete steps until the signal is above the noise floor of the system, but well below the saturation level of the PMT. Once the signal level reaches a user-defined minimum value, which is approximately the middle of the dynamic range of the PMT, the gain is set. This method ensures that the PMT anode current does not reach large values that may disturb the electric field inside the PMT and cause the phase to change. The other type of cross-talk that may affect the measurement is interchannel cross-talk from the DAQ card. This type of cross-talk may be improved if differential measurements are used. However, due to system limitations, our system had to use the single-ended termination where all the signals share the same ground point. This causes cross-talk between channels if one channel detects a larger signal compared to its neighboring channels. However, the same method that improves the space charge cross-talk affect also improves the interchannel cross-talk. By increasing the gain of each PMT until the signal is in the middle of the dynamic range for all PMTs, the voltage read by the DAQ device is roughly the same for all channels. 3.4.Stability and RepeatabilityThe repeatability of the system was determined by repeating a phantom measurement continuously while keeping all the parameters in the experiment the same. The phantom used is a silicon phantom with diameter of 86 mm. The laser light was directed to the center of the phantom. The phantom experiment was run five times and the standard deviation of the phase as well as the standard deviation of the natural log of the amplitude (In AC) was calculated. It was found that the average repeatability of the phase and In AC is 0.2 deg and 0.5%, respectively, as compared to 0.4 deg and 0.5% for our previous system. In order to measure the stability of the system, the same repeatability experiments were performed over an entire week, ensuring that the system is turned on and off prior to the experiments. It was found that the average stability of the phase and In AC is 0.44 deg and 1.2%, respectively. 3.5.Data Acquisition Duration and TimingExperiment duration is very important when patients are involved in imaging. Several improvements were implemented in order to shorten the duration of the full nine-wavelength acquisition, including optimizing the way PMT gains are calculated for different source position as well as refining software procedures. During FD acquisition, for gain routine A, the first laser is activated and the rotary stage moves until the source and detectors are aligned with the first source position [e.g., Fig. 2(a)]. The gain finding routine sets the PMTs to the proper gain and then data from all PMTs are acquired. Next, the rotary stage moves to the next source position, sets the proper gain, and acquires the data. This continues until every source position has been acquired. Once the results from the first wavelength are obtained, the system repeats the same process above for the remaining wavelengths. Another variation to the routine above is used to reduce the acquisition time. The second routine (routine B) reduces the time required for calculating the PMT gain by adjusting how the gains are calculated. It is identical to routine A above during the acquisition of the first wavelength. However, for the remaining wavelengths that are used in the acquisition, the gain values that were found for the first wavelength are used as the initial starting values. In both gain finding routines, once the FD acquisition is finished, the system performs a similar process for the CW wavelength measurements. The only difference is that no gain finding routine is needed while acquiring data with the PD modules since PD module gains cannot be adjusted using software. Running an acquisition with all nine wavelengths takes anywhere from 9 to 20 min, depending on what geometry and which gain finding routine are used during the acquisition. The total data acquisition time for each wavelength is shown in Table 1. In addition to the total data acquisition time at each wavelength, Table 1 shows the average time it takes for the system to determine the gain for the PMTs (column: Gain); for movement of the rotary switch array (column: Motor); and for miscellaneous steps, which include toggling the lasers, setting up the function generators, etc. (column: Misc). As can be seen from Table 1, for FD measurements, the difference in the total acquisition times is due to the geometry chosen and the gain routine used. The circular geometry setup [Fig. 3(a)] takes the least amount of time because this geometry requires only one gain set of all PMTs at a single source position. For the noncircular geometry, gain routine B approach has cut down the time of a full nine-wavelength scan from 19 to about 12 min. Table 1A breakout of the time spent on the main sections of the acquisition process.
3.6.Tissue Simulating Phantom ExperimentsA blood gelatin phantom was prepared as described in Sec. 2.7. The blood concentration of the phantom background was kept constant at 15 μM. The 2 cm inclusion was filled with different porcine blood concentrations starting from 0 up to 45 μM in 5 μM increments (15 μM concentration was not used). With each concentration, full FD/CW measurements were acquired and the blood concentration was recovered using Nirfast software.21 Figure 6 shows reconstruction results as a function of the actual blood concentration used. Hemoglobin recovery in the background was 25 μM compared to the actual 15 μM concentration. The background values were very stable across concentrations, with the norm of the residuals being 0.0054. Recovered HbT values from the inclusion showed a linear increase (norm of the ) with an average recovery of 71% of the true blood concentration. Fig. 6Reconstruction values on a gelatin phantom with 2 cm inclusion. The inclusion was filled with varying concentrations of blood. MRI images of the phantom are shown with the 2 cm inclusion overlaid (a) and (b). A photo of the actual phantom is shown in (c). Reconstruction as a function of true total hemoglobin values are shown for total hemoglobin, oxygen saturation, water, lipids, scatter power, and scatter amplitude in (d). Blue circles are for the background, while red circles are for the inclusion. 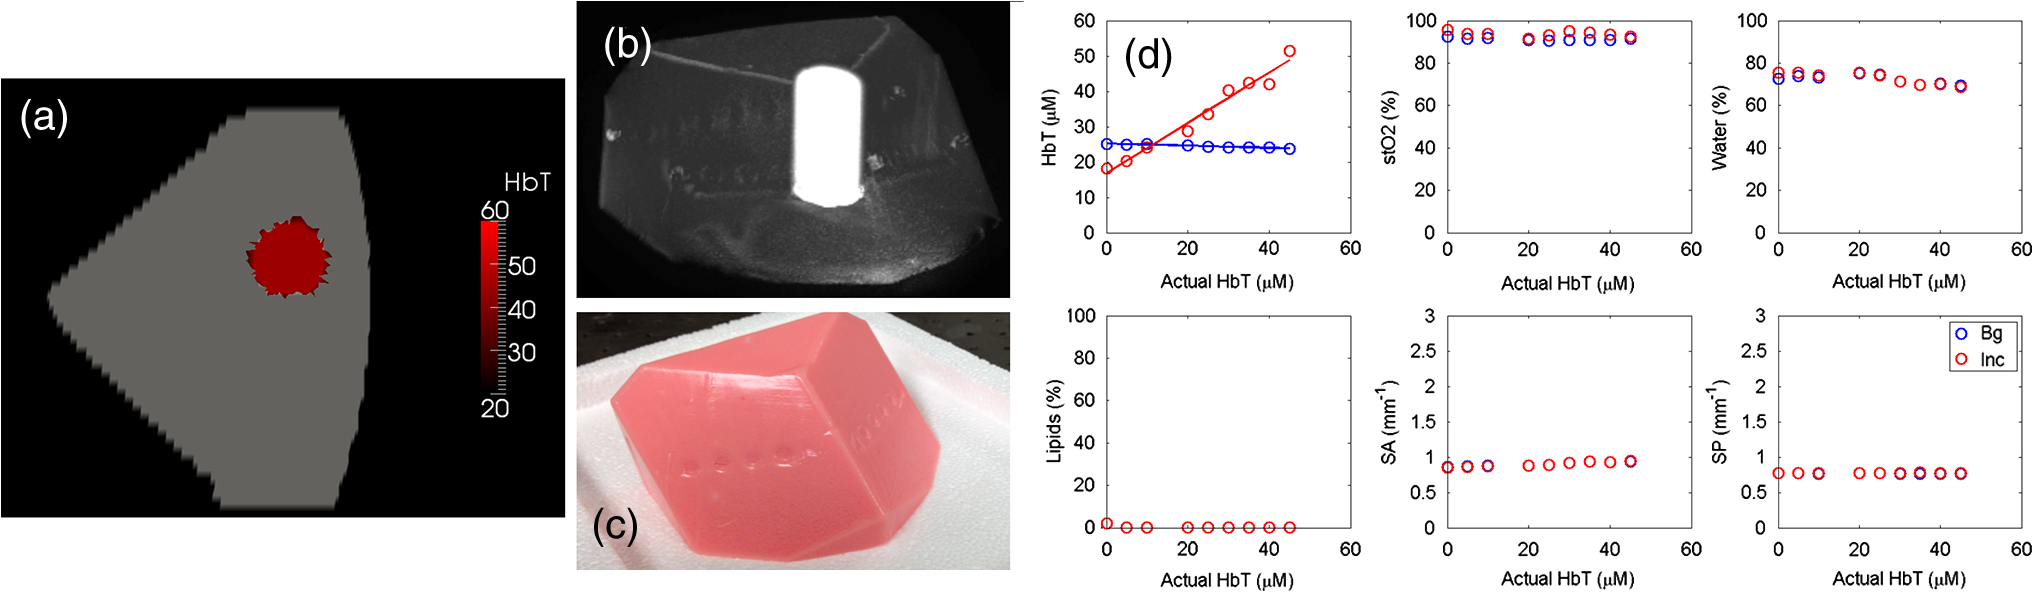 3.7.Human Subject ImagingThe combined FD/CW system and pentagonal interface has been used to successfully image nine healthy volunteers to date. A representative case is shown in Fig. 7. The volunteer was positioned such that her breasts were centered in the MR coil to minimize image artifact and then lightly compressed by the fiber optic cables to ensure good coupling. Optical data were collected in for FD and 3 min for CW, totaling 12 min. MRI acquisition took , and a second optical scan was performed during the remaining time. Data from one fiber were removed due to poor coupling with the breast tissue. Fig. 7Representative healthy volunteer imaging by combined optical system and MRI. Different axial MRI slices are shown with overlays of total hemoglobin (a), oxygen saturation (b), water (c) and lipid (d) fraction, scatter amplitude (e), and power (f). In each case, the region with the lowest value is removed and the region with the highest value is made slightly opaque to visualize overlaid MRI. A bilateral axial image (g) shows little degradation of MRI image quality.  A three-dimensional (3-D) finite element mesh of nodes was created specific to the patient based on the MR scan and segmented into adipose and fibroglandular regions. Optical data were coregistered to the MRI using fiducial markers in line with the optical fibers and the data were calibrated absolutely versus the model. A hard priors approach was then used to reconstruct for oxygenated hemoglobin, deoxygenated hemoglobin, water and lipid fraction, scatter amplitude, and scatter power.21 This volunteer showed total hemoglobin concentration of 18 μM in the adipose region and 22 μM in the glandular region with high oxygen saturation (74 to 86%) as well. Water content was higher in the glandular region, while lipid content was higher in the adipose region. MRI image quality was not affected by the optical image acquisition aside from a slight distortion of one breast from the optical fibers. The volunteer reported no discomfort due to the procedure. 4.DiscussionImaging water and lipid concentrations poses a problem since the ideal FD or time-resolved systems are PMT based, and so limit their response to wavelengths that are below the main spectral features of water and lipids. The ability to accurately image water and lipid concentrations enables better characterization of malignant and benign tissue, as well as provides better characterization of cysts and is also critical to recovering accurate hemoglobin and oxygen saturation values. The new hybrid system presented here has extended the wavelength range in order to include these spectral features and thus improves the data available for separation of chromophore contributions. However, since pure CW measurements do not accurately decouple chromophore concentrations and scattering, our system combines FD and CW measurements. Admittedly, this technological solution is a complicated coupling of two detection technologies; however, it is presented here in a design that allows not only simultaneous sampling but also fast source switching. The design is also extendable to more channels and faster speeds, but is slightly configuration dependent in terms of timing. A key advantage of the system is the integration of all components into a portable standalone prototype, allowing wider optical bandwidth of detection. The previous system used 16 spectrometers, which used CCDs to measure the light signal. The system was a prototype extendable to different types of spectroscopy, including fluorescence and Raman, but not ideal for extending into highly parallel acquisition in a cost-effective manner. The current hybrid system contains all imaging components inside a single rack and is a logical prototype of how to combine FD and CW detection in a package that is compact, cost effective, and extendable. The addition of amplifier after each PMT has increased the SNR of the FD measurements. However, while changing the gain of the PMTs provides a high working range of linearity, the FD system was not able to detect light signal levels as low as those detectable in the CW system. This is likely due to the relatively low SNR of the phase measurement by PMT. The PD modules used with the CW measurements proved to be excellent detectors with a very high dynamic range of and detection limit at 1 pW. And unlike the PMTs, the PD modules did not require any additional electronics or RF components in order to accurately measure the light signal; so they are be easier to integrate into a massively parallel system. While the PD displayed better linearity and no space-charge effect cross-talk, FD measurements of phase and amplitude cannot be acquired due to the lower temporal bandwidth of the PDs. Another advantage of the hybrid system is that it has a bandwidth between 50 and 800 MHz, allowing multiple modulation frequencies to be used. Since an MRI scan takes a little over 30 min while an optical exam takes 12 min, it is possible to run multiple optical scans with different modulation frequencies during a single MRI scan, or the higher frequencies could be used when the tissue volume is smaller. A disadvantage of our current breast interface is that a 3-D scan is not possible without having to reposition the patient; however, the current hybrid array can be used with a larger number of channels, in a serial manner, if a better breast interface is developed. The hybrid system was validated using gelatin phantom experiments that were able to track the linear increase of blood inside a 2-cm inclusion in a pentagonal phantom that is specific to our clinical NIR-MRI breast coil. We found that contrast recovery was slightly lower than expected, but this is a known problem in DOT, and likely due to cross-talk between absorption and scatter.28,29 We found that the system displayed linear contrast recovery over a wide range of hemoglobin concentrations with stability in the background. Our system was most accurate though with the lowest concentrations, which have contrasts similar to what we expect to see in malignant breast lesions.28 Additionally, several healthy volunteers have been imaged using this system and images have been reconstructed with results consistent with past work and literature values.7,30,31 The presented case shows elevated hemoglobin, oxygen saturation, water, and scattering parameters in the glandular tissue likely due to the higher cellular metabolism in the more complex tissue. Lipid content was higher in adipose region, consistent with our expectations.27 Our results show linear recovery and good stability in phantom studies and physiologically reasonable chromophore quantification in healthy human subjects. These results are important milestones in the system development and we are confident that we will have success imaging cancer patients. Future studies in human subjects will focus on cancer patients and accurate recovery of parameters from differing breast sizes. 5.ConclusionsA new hybrid frequency and CW domains system was developed, which improves the data quality and accuracy in the recovery of the breast chromophores. The system combines PMT and PD detectors in a switch array in order to extend the spectral range of the wavelengths used up to 948 nm. PMT detectors are used to image tissue using wavelengths between 600 and 850 nm, after which the detector response falls off dramatically. PD detectors are then used to image tissue using wavelengths between 900 and 948 nm. All optical components and imaging hardware are housed inside a portable standalone rack. The new design is compact, cost effective, and enables efficient parallel acquisition. After careful calibration, the system was tested and validated using phantom experiments as well as imaging of healthy volunteers, and the acquisition time for imaging using all nine wavelengths was reduced to about 12 min. AcknowledgmentsThis work has been funded by National Institute of Health research grants R01 CA069544 and R01 EB 007966. ReferencesA. Villringer and B. Chance,
“Non-invasive optical spectroscopy and imaging of human brain function,”
Trends Neurosci., 20
(10), 435
–442
(1997). http://dx.doi.org/10.1016/S0166-2236(97)01132-6 TNSCDR 0166-2236 Google Scholar
S. R. Arridge,
“Optical tomography in medical imaging,”
Inverse Probl., 15
(2), R41
–R93
(1999). http://dx.doi.org/10.1088/0266-5611/15/2/022 INPEEY 0266-5611 Google Scholar
R. Al abdi et al.,
“Optomechanical imaging system for breast cancer detection,”
J. Opt. Soc. Am. A Opt. Image Sci. Vis., 28
(12), 2473
–2493
(2011). http://dx.doi.org/10.1364/JOSAA.28.002473 JOAOD6 0740-3232 Google Scholar
J. C. Hebden,
“Advances in optical imaging of the newborn infant brain,”
Psychophysiology, 40
(4), 501
–510
(2003). http://dx.doi.org/10.1111/psyp.2003.40.issue-4 PSPHAF 0048-5772 Google Scholar
V. Ntziachristos et al.,
“Concurrent MRI and diffuse optical tomography of breast after indocyanine green enhancement,”
Proc. Natl. Acad. Sci. U.S.A., 97
(6), 2767
–2772
(2000). http://dx.doi.org/10.1073/pnas.040570597 PNASA6 0027-8424 Google Scholar
R. Choe et al.,
“Diffuse optical tomography of breast cancer during neoadjuvant chemotherapy: a case study with comparison to MRI,”
Med. Phys., 32
(4), 1128
–1139
(2005). http://dx.doi.org/10.1118/1.1869612 MPHYA6 0094-2405 Google Scholar
B. Brooksby et al.,
“Imaging breast adipose and fibroglandular tissue molecular signatures by using hybrid MRI-guided near-infrared spectral tomography,”
Proc. Natl. Acad. Sci. U.S.A., 103
(23), 8828
–8833
(2006). http://dx.doi.org/10.1073/pnas.0509636103 PNASA6 0027-8424 Google Scholar
M. A. Mastanduno et al.,
“Automatic and robust calibration of optical detector arrays for biomedical diffuse optical spectroscopy,”
Biomed. Opt. Express, 3
(10), 2339
–2352
(2012). http://dx.doi.org/10.1364/BOE.3.002339 BOEICL 2156-7085 Google Scholar
C. M. Carpenter et al.,
“Image-guided optical spectroscopy provides molecular-specific information in vivo: MRI-guided spectroscopy of breast cancer hemoglobin, water, and scatterer size,”
Opt. Lett., 32
(8), 933
–935
(2007). http://dx.doi.org/10.1364/OL.32.000933 OPLEDP 0146-9592 Google Scholar
V. Ntziachristos et al.,
“MRI-guided diffuse optical spectroscopy of malignant and benign breast lesions,”
Neoplasia, 4
(4), 347
–354
(2002). http://dx.doi.org/10.1038/sj.neo.7900244 1522-8002 Google Scholar
P. Taroni,
“Diffuse optical imaging and spectroscopy of the breast: a brief outline of history and perspectives,”
Photochem. Photobiol. Sci., 11
(2), 241
–250
(2012). http://dx.doi.org/10.1039/c1pp05230f PPSHCB 1474-905X Google Scholar
I. Nissila et al.,
“Instrumentation and calibration methods for the multichannel measurement of phase and amplitude in optical tomography,”
Rev. Sci. Instrum., 76
(4),
(2005). http://dx.doi.org/10.1063/1.1884193 RSINAK 0034-6748 Google Scholar
T.O. McBride et al.,
“A parallel-detection frequency-domain near-infrared tomography system for hemoglobin imaging of the breast in vivo,”
Rev. Sci. Instrum., 72
(3), 1817
–1824
(2001). http://dx.doi.org/10.1063/1.1344180 RSINAK 0034-6748 Google Scholar
J. P. Culver et al.,
“Three-dimensional diffuse optical tomography in the parallel plane transmission geometry: evaluation of a hybrid frequency domain/continuous wave clinical system for breast imaging,”
Med. Phys., 30
(2), 235
–247
(2003). http://dx.doi.org/10.1118/1.1534109 MPHYA6 0094-2405 Google Scholar
J. Wang et al.,
“In vivo quantitative imaging of normal and cancerous breast tissue using broadband diffuse optical tomography,”
Med. Phys., 37
(7), 3715
–3724
(2010). http://dx.doi.org/10.1118/1.3455702 MPHYA6 0094-2405 Google Scholar
F. Bevilacqua et al.,
“Broadband absorption spectroscopy in turbid media by combined frequency-domain and steady-state methods,”
Appl. Opt., 39
(34), 6498
–6507
(2000). http://dx.doi.org/10.1364/AO.39.006498 APOPAI 0003-6935 Google Scholar
P. Taroni et al.,
“Seven-wavelength time-resolved optical mammography extending beyond 1000 nm for breast collagen quantification,”
Opt. Express, 17
(18), 15932
–15946
(2009). http://dx.doi.org/10.1364/OE.17.015932 OPEXFF 1094-4087 Google Scholar
J. Wang et al.,
“Near-infrared tomography of breast cancer hemoglobin, water, lipid, and scattering using combined frequency domain and CW measurement,”
Opt. Lett., 35
(1), 82
–84
(2010). http://dx.doi.org/10.1364/OL.35.000082 OPLEDP 0146-9592 Google Scholar
M. A. Mastanduno et al.,
“Remote positioning optical breast magnetic resonance coil for slice-selection during image-guided near-infrared spectroscopy of breast cancer,”
J. Biomed. Opt., 16
(6), 066001
(2011). http://dx.doi.org/10.1117/1.3587631 JBOPFO 1083-3668 Google Scholar
M. Mastanduno et al.,
“Adaptable near infrared spectroscopy fiber array for improved coupling to different breast sizes during clinical MRI,”
(2013). Google Scholar
H. Dehghani et al.,
“Near infrared optical tomography using NIRFAST: algorithm for numerical model and image reconstruction,”
Commun. Numer. Methods Eng., 25
(6), 711
–732
(2009). http://dx.doi.org/10.1002/cnm.v25:6 CANMER 0748-8025 Google Scholar
H. Dehghani et al.,
“Three-dimensional optical tomography: resolution in small-object imaging,”
Appl. Opt., 42
(16), 3117
–3128
(2003). http://dx.doi.org/10.1364/AO.42.003117 APOPAI 0003-6935 Google Scholar
S. Srinivasan et al.,
“In vivo hemoglobin and water concentrations, oxygen saturation, and scattering estimates from near-infrared breast tomography using spectral reconstruction,”
Acad. Radiol., 13
(2), 195
–202
(2006). http://dx.doi.org/10.1016/j.acra.2005.10.002 1076-6332 Google Scholar
T. O. McBride et al.,
“Spectroscopic diffuse optical tomography for the quantitative assessment of hemoglobin concentration and oxygen saturation in breast tissue,”
Appl. Opt., 38
(25), 5480
–5490
(1999). http://dx.doi.org/10.1364/AO.38.005480 APOPAI 0003-6935 Google Scholar
C. M. Carpenter et al.,
“Methodology development for three-dimensional MR-guided near infrared spectroscopy of breast tumors,”
Opt. Express, 16
(22), 17903
–17914
(2008). http://dx.doi.org/10.1364/OE.16.017903 OPEXFF 1094-4087 Google Scholar
B. Brooksby et al.,
“Combining near-infrared tomography and magnetic resonance imaging to study in vivo breast tissue: implementation of a Laplacian-type regularization to incorporate magnetic resonance structure,”
J. Biomed. Opt., 10
(5), 051504
(2005). http://dx.doi.org/10.1117/1.2098627 JBOPFO 1083-3668 Google Scholar
S. Srinivasan et al.,
“Near-infrared characterization of breast tumors in vivo using spectrally-constrained reconstruction,”
Technol. Cancer Res. Treat., 4
(5), 513
–526
(2005). TCRTBS 1533-0346 Google Scholar
S. P. Poplack et al.,
“Electromagnetic breast imaging: results of a pilot study in women with abnormal mammograms,”
Radiology, 243
(2), 350
–359
(2007). http://dx.doi.org/10.1148/radiol.2432060286 RADLAX 0033-8419 Google Scholar
B. W. Pogue et al.,
“Image analysis methods for diffuse optical tomography,”
J. Biomed. Opt., 11
(3), 033001
(2006). http://dx.doi.org/10.1117/1.2209908 JBOPFO 1083-3668 Google Scholar
A. Cerussi et al.,
“In vivo absorption, scattering, and physiologic properties of 58 malignant breast tumors determined by broadband diffuse optical spectroscopy,”
J. Biomed. Opt., 11
(4), 044005
(2006). http://dx.doi.org/10.1117/1.2337546 JBOPFO 1083-3668 Google Scholar
S. Jiang et al.,
“Evaluation of breast tumor response to neoadjuvant chemotherapy with tomographic diffuse optical spectroscopy: case studies of tumor region-of-interest changes,”
Radiol., 252
(2), 551
–560
(2009). http://dx.doi.org/10.1148/radiol.2522081202 RADLAX 0033-8419 Google Scholar
|


