
|
|
1.IntroductionEndogenous fluorophores such as nicotinamide adenine dinucleotide and flavin adenine dinucleotide (FAD), collagen, and elastin can be used in optical biopsy applications to provide quantitative information about tissue structures1,2 and biochemical function.3 Unlike exogenous fluorescent probes used in clinical studies,4 endogenous fluorescence (autofluorescence) has broadband emission with significant overlaps between different fluorophores.5 Consequently, spectroscopy is usually preferred to analyze autofluorescence in biological tissue rather than filter-based techniques which are commonly used for exogenous fluorescent probe detection. Besides fluorescence spectrum, fluorescence lifetime provides an additional source of contrast, which is independent of fluorescence intensity.6 In addition, fluorescence lifetime can be used to probe molecular microenvironment (e.g., pH, ion concentration, enzymatic activity).7 Time-resolved fluorescence (TRF) techniques, which acquire the fluorescence decays in different wavelengths, have been used as an optical biopsy method in many clinical applications such as brain tumor margin detection,8–10 early diagnosis of tumors in the gastrointestinal tract,11 and vulnerability assessment of atherosclerotic lesions.12,13 For optical biopsy applications, two-dimensional (2-D) fluorescence lifetime imaging (FLIM) is generally preferred to provide the fluorescence properties (spectrum and lifetime) as well as morphological information of biological targets. However, most of the aforementioned techniques are limited to point spectroscopy methods that analyze fluorescence information from a single point. This is because it is very time consuming to fully resolve weak fluorescence emission spectrally, temporally, and spatially. By using conventional scanning grating–based monochromator,14 the fluorescence intensity and decay can be collected over a broad spectral region. However, the acquisition time is relatively long () for optical biopsy applications.14 Although multiple bandpass filters were used in recent TRF instruments to rapidly collect data at several wavelengths,15–18 only limited spectral bands can be measured, which may not be sufficient to resolve the overlapping autofluorescence spectra. In order to overcome these challenges, Beule et al.19 developed a hyperspectral fluorescence lifetime application to collect spectra and temporal decay profiles simultaneously by using a spectrometer and a multichannel photomultiplier tube (PMT), whereas Yuan et al.20 proposed a design to acquire fluorescence spectra and decays using an acousto-optic tunable filter (AOTF). The AOTF is a solid-state birefringent elasto-optic device that selects a narrow spectral band based on anisotropic Bragg diffraction. Wavelength selection and switching are achieved in the order of a few microseconds by changing the modulating acoustic wave frequency. In this article, we report an AOTF-based spectrally resolved FLIM technique. The 2-D images are acquired by scanning a fiber probe using a motorized scanning stage, which can be modified with faster beam-steering techniques in the future. The system has been characterized and validated on tissue phantoms with standard fluorescence dyes and fresh porcine skin specimens. The results illustrate its ability to spectrally, temporally, and spatially resolve different fluorophores and autofluorescence from biological tissue. 2.Materials and MethodsThe schematic view of the hyperspectral FLIM instrument is illustrated in Fig. 1. A solid-state laser (PNV-001525-140, Teem Photonics, Meylan, France) at 355 nm with 300 ps [full width half maximum (FWHM)] pulse width and 1-kHz repetition rate was used for fluorescence excitation. The laser beam was reflected by a custom dichroic mirror (CS0238, Lightwaves 2020 Inc, Milpitas, California) with the reflectance ratio of 70% (45 deg incident angle) at 355 nm, then focused into the proximal end of a fused silica fiber probe (400-μm-core diameter and 0.12 numerical aperture) by a plano-convex lens. The laser pulse energy illuminated on the sample was to avoid photobleaching of the sample. Fig. 1A schematic view of the acousto-optic tunable filter (AOTF)-based hyperspectral fluorescence lifetime imaging (FLIM) instrument. M1: flat mirror; M2, M3: concave mirrors; DM: dichroic mirror; C1: plano-concave lens; F1: neutral density filter; F2: long-pass filter; B1, B2: beam stops; PD: photodiode; AOTF: acousto-optic tunable filter; MCP-PMT: multichannel plate photomultiplier tube; AMP: preamplifier. 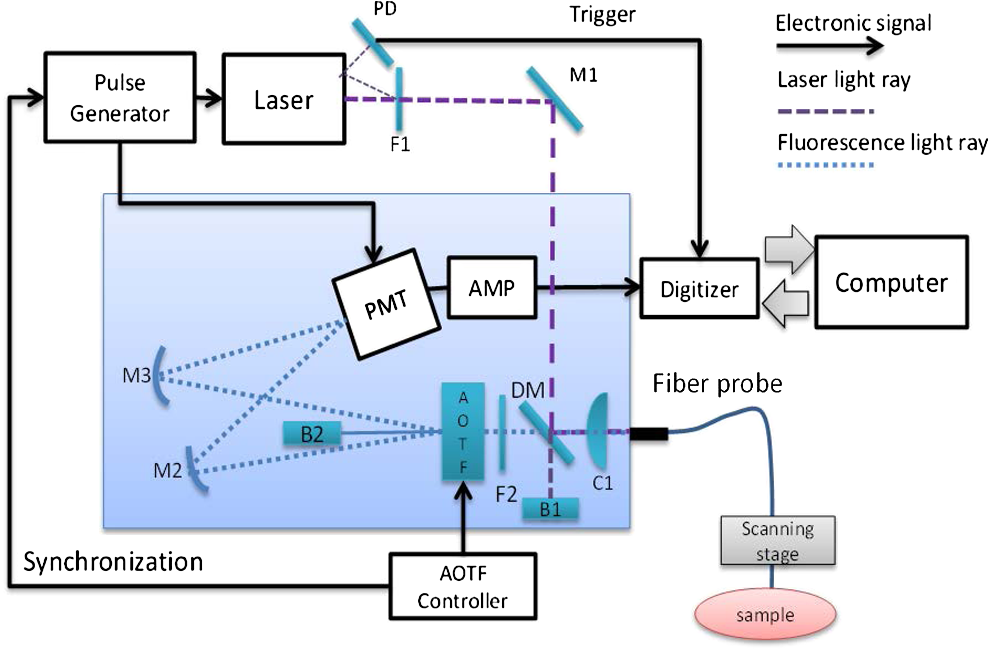 After laser excitation, fluorescence emission was collected by the same fiber probe and collimated by the plano-convex lens and then passed through the dichroic mirror with transmission ratio in the wavelength range of 370 to 550 nm. A long-pass filter (optical density at 355 nm, LP02-355RU-25, Semrock, Rochester, New York) was placed in front of the AOTF (TEAF5-0.36-0.52-S, Brimrose, Baltimore, Maryland) to block backscattered laser light. Selected spectral band of the collimated fluorescence beam was separated into ordinary and extraordinary polarized light and was diffracted toward the two concave mirrors. The undiffracted light passed through the AOTF and was blocked by a beam stop. Both diffracted beams at the opposite sides of the undiffracted beam were detected by a fast gated microchannel plate photomultiplier tube (MCP-PMT, rising time: 180 ps, R5916-50, Hamamatsu Photonics, Japan). The output signal from MCP-PMT was amplified by a preamplifier (bandwidth: 50 kHz to 1.5 GHz, C5594-12, Hamamatsu Photonics) and digitized by a high-speed digitizer (12 bit, , 1.3 GHz bandwidth, ADQ412, SP Devices, Sweden). A pulse generator (QC9512, Quantum Composer, Bozeman, Montana) was used to synchronize the laser and PMT to ensure that the fluorescence decay could be collected within the PMT gating window. A low-jitter () photodiode (DET10A, Thorlab, Newton, New Jersey), which collected the laser scattering light reflected by the neutral density filter, was used to trigger the digitizer to acquire fluorescence signal. The time of wavelength switch using the AOTF is less than 20 μs. By switching the frequency of the acoustic wave applied on the AOTF crystal to obtain the diffracted beam at different wavelengths, the fluorescence decays in the range of 370 to 550 nm were collected rapidly. A motorized stage (MS2000, ASI, Eugene, Oregon) was used to hold the fiber probe to achieve spatial scanning, while a beam-steering method is being developed in ongoing work. The hyperspectral FLIM instrument proposed in this study was improved from the previous system20 to achieve highly efficient detection performance and be compatible with future clinical studies. First, to improve the fluorescence collection efficiency, a single-fiber probe was used to deliver excitation light and collect fluorescence emission. Second, to accelerate the data acquisition speed, a high-speed digitizer with sampling rate and 1.3-GHz bandwidth was utilized for data acquisition instead of using a digital oscilloscope. This setup allows multiple fluorescence decays to be collected and saved in the buffer on the digitizer first and then all decays are transferred to the computer after the acquisition. Third, to generate 2-D images, the motorized stage was used to hold the fiber probe to realize the scanning configuration instead of single point measurement. A custom-built program was used to control the data acquisition and preliminary data processing. For the results reported in this study, fluorescence decays in the wavelength range of 380 to 550 nm with 10-nm intervals were collected in each pixel. Data acquisition time for each pixel is when averaging 10 pulses at each wavelength. The acquired data were analyzed off-line in several steps: (1) performing Laguerre polynomial–based deconvolution to remove the system temporal response and retrieve the intrinsic lifetime features; (2) calculating fluorescence intensity by integrating the decay curve at each wavelength; and (3) reconstructing hyperspectral intensity and lifetime images at different wavelengths. The Laguerre deconvolution technique is a fast fluorescence lifetime converging technique that can retrieve the fluorescence intrinsic response function without a priori assumptions.21 The system was calibrated and validated using three fluorescence dye solutions: 0.1 mM fluorescein in ethanol (515 nm, 4.1 ns14), 0.1 mM 9-cyanoanthracene in ethanol (445 nm, 11.8 ns14), and 0.1 mM Coumarin-6 in ethanol (515 nm, 2.5 ns22). In order to validate the imaging configuration, the solid phantom matrix was fabricated to simulate the properties of biological tissue using the following formula: 1 g agar powder (A1296, Sigma-Aldrich, St. Louis, Missouri) was slowly dissolved into 50 mL hot deionized water and cooled to room temperature. About 2.5 mL intralipid (20%, Baxter Corp, Toronto, Canada) was added into the agar solution during the cooling process to achieve a reduced scattering coefficient at 460 nm which was prepared according to Ref. 23. The solid fluorescence phantoms were achieved by adding the fluorescence solutions into the agar solution during the cooling process and then filled into small capillary tubes (outer diameter 1 mm, inside diameter 0.5 mm) to form a 0.5-mm-diameter circle shape. The capillary tubes were embedded into the phantom matrix to get different patterns. Phantom #1 was a pair of capillary tubes with the fluorescein dyes embedded into the phantom matrix in parallel, with 1-mm between of the capillary tube centers. It was used to characterize the effects of the scanning step on the spatial resolution of intensity and lifetime images. Phantom #2, which included three capillary tubes of fluorescence dyes (9-cyanoanthracene, coumarin-6, fluorescein) inserted in the phantom matrix, was used to validate the capability of the system to resolve fluorescence dyes by lifetime and intensity characteristics. Besides fluorescence phantoms, fresh porcine skin specimens purchased from a local butcher shop were tested in this study. Two solid fluorescent phantoms (9-cyanoanthracene and fluorescein) were embedded into the porcine skin to determine the sensitivity of our system in differentiating the distinct features (chemical compositions and structures) of the fluorophores from the autofluorescence background. Saline was used to keep the tissue wet during the experiment. 3.System CalibrationA high-throughput AOTF spectrometer was built for fast wavelength scanning in spectral domain.20 In this setup, both first-order diffracted ordinary (o-ray) and extraordinary (e-ray) beams are collected to improve throughput. Due to the differences between refractive index of o-ray () and e-ray () in the tellurium dioxide () birefringent crystal, the peak wavelengths and the spectral bandwidth of the two diffracted beams are not completely identical. Therefore, it is necessary to characterize the spectral responses for both diffracted beams and minimize their differences. Detailed descriptions of AOTF operating principles and calibration methods can be found in Refs. 24 and 25. The emission spectrum of the fluorescein solution was measured using individual first-order diffracted beams and the combined beam [shown in Fig. 2(a)]. The o-ray and e-ray had a small difference of at the peak wavelengths. The fluorescence intensity was increased when combining two diffracted beams and the bandwidth of combination beam was 2.5 nm (FWHM). In addition, the optical pathlengths of both diffracted beams were designed to be identical such that there is no broadening introduced by combining the fluorescence decays of o-ray and e-ray as shown in the inset figure of Fig. 2(a). Fig. 2Calibration results of the AOTF-based spectrometer. (a) Fluorescence emission spectra of fluorescein solution measured for both first-order diffracted beams (ordinary: o-ray and extraordinary: e-ray) separately and the combined beam. Insert figure is the fluorescence decays of two diffracted beams (-axis unit: ns, -axis unit: arbitrary). (b) Differences between the peak wavelength of diffracted beam and calibrated wavelength. The differences between two diffracted beams were calibrated within 1 nm over the observed spectral range. (c) The bandwidths (red stars) of the diffracted beams at different wavelengths were in the range of 1 to 2.5 nm, which is proportional to the square of central wavelength as the fitting curve shows (solid line).  The spectral responses of both diffracted beams across the interested spectral region were calibrated using a tungsten halogen lamp (HL-2000, Ocean Optics, Clearwater, Florida) as an input light shinning onto the distal end of the fiber probe. The diffracted beams were measured by a calibrated spectrometer (OEM-400, Newport, Irvine, California). By carefully adjusting the AOTF position and orientation, the differences between the peak wavelengths of the two diffracted beams were minimized within 1 nm over the observed spectral region as shown in Fig. 2(b). The central wavelength of o-ray is slightly longer than that of the e-ray due to the in the crystal. The relationship between RF signal and diffracted wavelength was also calibrated and saved as a lookup table which was recalled for wavelength selection during clinical studies. The spectral resolution of AOTF spectrometer depends on the bandwidth of the diffracted beam, which is related to its central wavelength. The diffracted beam shape of the noncollinear AOTF is ideally a sinc2 function, and the FWHM bandwidth can be approximated by where is the central wavelength of diffracted beam, is acousto-optic interaction length, is the refractive index difference between the e-ray and o-ray, and is the light incident angle.24 The bandwidths of the diffracted beams were measured in the wavelength range of 390 to 550 nm with 20-nm intervals as shown in Fig. 2(c). The bandwidths over the observed spectral region were in the range of 1 to 2.5 nm, which are also proportional to the square of wavelength as predicted by Eq. (1).Temporal resolution of the system needs to be sufficient to measure the biological autofluorescent decay in the fluorescence lifetime range of 0.1 to 10 ns. The overall system temporal resolution mainly depends on the temporal response of MCP-PMT, preamplifier, digitizer, and trigger as well as dispersion in the fiber probe. The temporal response function of each element can be assumed as Gaussian distribution, thus the system temporal resolution can be calculated by adding the squares of time spread for each element.26 Practically, the temporal response can be approximated by measuring the instrument’s response on the excitation laser pulse. Subsequently, the fluorescence intrinsic signal can be retrieved by deconvolving measured fluorescence pulse with measured laser response. Moreover, the spectral response of the system was also calibrated using a halogen calibration lamp (HL-2000-CAL, Ocean Optics) following the procedure described in Ref. 14. The autofluorescence signals of most biological samples are very weak. Therefore, averaging a number of decay pulses at each wavelength can improve the signal-to-noise ratio (SNR), and decrease the uncertainties in the fluorescence lifetime estimation. In order to investigate the relationship between the averaged pulse numbers () and SNR, the fluorescence decays of the fluorescein solution was measured at 515 nm with the averaged pulse numbers ranging from 5 to 2000. The SNR here is defined as the ratio of the peak intensity and its standard deviation. Each measurement was repeated 10 times. In Fig. 3(a), the SNR increased with the increase of averaged pulse numbers following a linearly proportional to as predicted by the Poisson distribution.27 Similarly, the standard deviation of the lifetime values decreased with the increase of the averaged pulse numbers as shown in Fig. 3(b). The standard error, which was calculated as the ratio between standard deviation and mean, was when averaging 10 or more pulses together, this ensured to retrieve the lifetime value accurately. Thus, 10 fluorescence pulses were averaged in each wavelength to keep the balance between the SNR and data acquisition time in the following results presented in this study. Fig. 3Signal-to-noise characterization of system performed on fluorescein decays with different number of averaged pulses (, 10, 20, 40, 80, 160, 320, 640, 1280, and 2000). (a) SNR increased following a linearly proportional to as predicted by the Poisson distribution as the fitting curve shows. (b) Standard deviation (uncertainty) of lifetime decreased with the increase of averaged pulse numbers, which is inversely proportional to .  A motorized scanning stage was used to hold the fiber probe to obtain the 2-D FLIM images. The spatial resolution of 2-D FLIM images depends on many factors such as scanning step, illumination beam size, and probe-to-target distance. To characterize the effect of scanning step on spatial resolution, fluorescence decays of phantom #1 were acquired only at 515 nm over the scanning area of at different scanning steps (0.1, 0.2, and 0.3 mm). Figures 4(a) and 4(b) show the intensity and lifetime images, respectively. The averaged lifetime did not change with the scanning step, while the imaging quality degraded as the scanning step increased from 0.1 to 0.3 mm; especially in the lifetime images of the 0.2- and 0.3-mm scanning steps in which the fluorescence tube cannot be visualized. Fig. 4Effects of the scanning steps on the spatial resolution (image quality). The intensity (a) and lifetime (b) images of fluorescence phantom #1 at 515 nm are measured at three different scanning steps (top to bottom: 0.1, 0.2, and 0.3 mm). (c) A schematic view of phantom #1. A pair of capillary tubes filled with fluorescein dyes embedded into the phantom matrix in parallel. The distance between two capillary tubes is 1 mm.  4.System Validation on Tissue Phantom and Biological TissueThe performance of the hyperspectral FLIM system was validated on the tissue phantom to characterize its capability of resolving multiple fluorophores spectrally, temporally, and spatially. Figure 5(c) shows the arrangement of three embedded fluorophores within phantom #2. The fluorescence decays of phantom #2 were collected in the range of 380 to 550 nm with 10-nm intervals for each pixel. The total scanning area was with 0.05-mm scanning step. After data acquisition, the hyperspectral intensity and lifetime images were constructed off-line. Fig. 5Spectral and temporal resolving fluorescence emission of three fluorophores (#1: coumarin-6, #2: 9-cyanoanthracene, and #3: fluorescein) in phantom #2. The intensity (a) and lifetime (b) images are obtained at different wavelengths (410, 450, 510, 520, and 550 nm) over a area. (c) A schematic view of phantom #2. Normalized intensity (d) and lifetime (e) spectroscopies can provide the detailed intensity and lifetime information of three different fluorophores.  Figures 5(a) and 5(b) show the fluorescence intensity and averaged lifetime images obtained at five wavelengths: 410, 450, 510, 520, and 550 nm. As expected, 9-cyanoanthracene was clearly visible in the center of the intensity and lifetime images at 410 and 450 nm with an averaged lifetime of 11.2 ns. Its intensity decreased at longer wavelength, while the lifetime remained constant. Fluorescein and coumarin-6 shared the same intensity variation trend but with different lifetime values (2.6 ns for coumarin-6, 3.9 ns for fluorescein) in the wavelength range of 450 to 550 nm. The averaged spectra and lifetime of the three fluorescence phantoms are shown in Figs. 5(d) and 5(e), respectively, which illustrates the detailed variation of intensity and lifetime over the observed spectral range. We can see that 9-cyanoanthracene has a broad emission spectrum in the range of 400 to 550 nm, whereas fluorescein and coumarin-6 emit between 450 and 550 nm. Although coumarin-6 and fluorescein had similar emission spectra, they still could be distinguished by the different lifetime values. The averaged lifetime values at the emission peaks of coumarin-6, 9-cyanoanthracene, and fluorescein are shown in Table 1 and are in very good agreement with Refs. 14 and 22. These results demonstrate that both spectral and TRF features can be used to resolve the fluorescence emission of multiple fluorophores. The images also provide the morphological information of each fluorophores. Table 1Fluorescence lifetime values of the fluorescence standards in Phantom #2.
The system has also been validated using fresh porcine skin specimens to demonstrate the system’s capability of resolving the autofluorescence from biological tissue. The scanning area is () with 0.15-m scanning step. Figures 6(a) and 6(b) show the intensity and lifetime images at 405, 450, and 515 nm. The embedded fluorescence phantoms were resolved against the autofluorescence background from the skin tissue. The 9-cyanoanthracene was resolved at both 405 and 450 nm, whereas the fluorescein was observed at 515 nm. The autofluorescence of the porcine skin has strong intensity emission and lifetime values around 4.5 ns at 405 and 450 nm, which is primarily contributed by collagen and elastin in skin tissue. The decrease of 9-cyanoanthracene lifetime at 515 nm was attributed to diffusion of fluorescein phantom in the same area. Figures 6(d) and 6(e) present the intensity and lifetime spectroscopies of the selected spots from the porcine skin specimens and the embedded fluorescence dyes as the black arrows point out in Fig. 6(b). One can see that the autofluorescence of the porcine skin has a broad emission spectrum with a peak at 440 nm and then decreases quickly after 500 nm, whereas the fluorescein has a relatively narrow emission spectrum with a peak at 515 nm. In the time-resolved spectrum, the autofluorescence lifetime decreased with the increase of the wavelength, whereas the fluorescein lifetime remains constant around 4 ns over the spectral region. Thus, the fluorescein target was easily resolved from the porcine skin tissue based on the biochemical and morphological information. The results demonstrate that our system is capable of measuring the autofluorescence of biological tissue and distinguishing the fluorescence targets against the autofluorescence background. Fig. 6The evaluation results of the hyperspectral FLIM on the porcine skin specimen with the fluorescence targets to observe its ability to spectrally and temporally resolve autofluorescence and distinguish the fluorescence targets against autofluorescence background. Fluorescence intensity (a) and lifetime (b) images are shown at different wavelengths (405, 450, and 515 nm). (c) A photograph of the porcine skin specimen with two fluorescence targets [fluorescein (F), 9-cyanoanthracene (9-CA)]. The scanning area is marked by red square. Normalized intensity (d) and lifetime (e) spectroscopies of the selected spots from skin tissue and fluorescence [black arrows in (b)].  5.DiscussionWe presented an AOTF-based hyperspectral FLIM technique that is able to spectrally, temporally, and spatially resolve fluorescence signal from biological tissue in the visible wavelength range of 370 to 550 nm. The fluorescence decays over a broad wavelength range were collected at each pixel. Fluorescence intensity and lifetime images at different wavelengths can be constructed from the fluorescence decays. The spectral response, temporal response, SNR, and scanning step of the hyperspectral FLIM system were calibrated and characterized to optimize the system performance. Spectral resolving capability of the hyperspectral FLIM system was realized by using the AOTF to switch wavelength in the order of a few microseconds. This configuration dramatically deceases the data acquisition time comparing to the grating-based systems and makes it possible to generate spectrally resolved fluorescence lifetime images rapidly. Although the peak wavelength and bandwidth of the two diffracted beams still have slight differences (Fig. 2) which are limited by the AOTF’s configuration and properties, it is still within the tolerance of typical optical biopsy applications targeting relatively broadband autofluorescence emission. Moreover, compared to the bandpass filter–based TRF systems, this design allows us to choose the relevant wavelengths by changing the RF frequency applied on AOTF without any physical movement, which leads to a robust system to choose the different sets of wavelengths for different tissue targets. This is an important feature for research instruments for exploratory projects. Temporal resolving capability of the hyperspectral FLIM system was realized by using the fast-gated MCP-PMT with the short rising time of 180 ps and the high-speed digitizer with 3.6-GS/s sampling rate and 1.3-GHz bandwidth, which allows us to acquire subnanosecond fluorescence decay. The data acquisition speed is improved from 4 s to 300 ms for acquiring 180 decays when using a high-speed digitizer to replace the oscilloscope in the previous system. This feature also ensures the real-time data acquisition, which is a key factor for the imaging modality. The current 2-D FLIM data acquisition time is mainly limited by the laser repetition rate of 1 kHz. Some high-repetition-rate UV lasers are now available which may further reduce data acquisition time.16 In this study, a two-axial motorized stage was used to hold the fiber probe in order to demonstrate the feasibility of generating a 2-D FLIM image, i.e., demonstrating spatial resolving capability. Although this setup is useful for ex vivo investigation of specimens removed from the patient, it is certainly not intended to be used for in vivo study. Many high-speed beam scanning techniques exist, e.g., galvanometer mirrors, rotating fibers, etc., and are under development in an ongoing project. The spatial resolution of the FLIM images depends on many factors such as scanning step, fiber probe size, and probe-to-target distance. The resolution of our system is limited by the 400-μm-core fiber size. In many cases, the spatial resolution of surgical margin detection is to 2 mm.28 Therefore, this system is feasible to detect the tumor margin with sufficient spatial resolution. In future beam-steering setup, where a focusing gradient refractive index (GRIN) lens will be used, the focal spot size is expect to be much smaller. In conclusion, we demonstrated a hyperspectral FLIM application that provides the three-dimensional information of endogenous and exogenous fluorophores in space, spectrum, and time. The performances of system have been characterized and evaluated using fluorescence tissue phantoms and biological tissue. The results suggest that spectrally resolved FLIM technique has the potential to be used in optical biopsy applications. AcknowledgmentsThe authors would like to thank Mr. Derek Cappon and Du Le for their assistance in making the fluorescence phantom and preparing the manuscript. We also like to thank Drs. Naresh Murty, William McMillan, and John Provias of Hamilton Health Sciences for valuable discussions. This project is supported in part by the Natural Sciences and Engineering Research Council (NSERC) of Canada, Canada Foundation for Innovation, and the Ontario Centers of Excellence. Q. F. holds the Canada Research Chair in Biophotonics and Z. N. is supported in part by the Chinese Scholarship Council. ReferencesJ. D. Pittset al.,
“Autofluorescence characteristics of immortalized and carcinogen-transformed human bronchial epithelial cells,”
J. Biomed. Opt., 6
(1), 31
–40
(2001). http://dx.doi.org/10.1117/1.1333057 JBOPFO 1083-3668 Google Scholar
V. Lutzet al.,
“Impact of collagen crosslinking on the second harmonic generation signal and the fluorescence lifetime of collagen autofluorescence,”
Skin Res. Technol., 18
(2), 168
–179
(2012). http://dx.doi.org/10.1111/srt.2012.18.issue-2 0909-752X Google Scholar
I. Georgakoudiet al.,
“NAD(P)H and collagen as in vivo quantitative fluorescent biomarkers of epithelial precancerous changes,”
Cancer Res., 62
(3), 682
–687
(2002). CNREA8 0008-5472 Google Scholar
W. Stummeret al.,
“Fluorescence-guided resection of glioblastoma multiforme by using 5-aminolevulinic acid-induced porphyrins: a prospective study in 52 consecutive patients,”
J. Neurosurg., 93
(6), 1003
–1013
(2000). http://dx.doi.org/10.3171/jns.2000.93.6.1003 JONSAC 0022-3085 Google Scholar
J. R. Lakowicz, Principle of Fluorescence Spectroscopy, Springer, New York, NY
(2006). Google Scholar
W. H. Yonget al.,
“Distinction of brain tissue, low grade and high grade glioma with time-resolved fluorescence spectroscopy,”
Front. Biosci., 11 1255
–1263
(2006). http://dx.doi.org/10.2741/1878 1093-9946 Google Scholar
H. D. Vishwasraoet al.,
“Conformational dependence of intracellular NADH on metabolic state revealed by associated fluorescence anisotropy,”
J. Biol. Chem., 280
(26), 25119
–25126
(2005). http://dx.doi.org/10.1074/jbc.M502475200 JBCHA3 0021-9258 Google Scholar
P. V. Butteet al.,
“Intraoperative delineation of primary brain tumors using time-resolved fluorescence spectroscopy,”
J. Biomed. Opt., 15
(2), 027008
(2010). http://dx.doi.org/10.1117/1.3374049 JBOPFO 1083-3668 Google Scholar
P. V. Butteet al.,
“Fluorescence lifetime spectroscopy for guided therapy of brain tumors,”
Neuroimage, 54
(Suppl 1), 125
–135
(2011). http://dx.doi.org/10.1016/j.neuroimage.2010.11.001 NEIMEF 1053-8119 Google Scholar
Y. Sunet al.,
“Fluorescence lifetime imaging microscopy for brain tumor imaging-guided surgery,”
J. Biomed. Opt., 15
(5), 056022
(2010). http://dx.doi.org/10.1117/1.3486612 JBOPFO 1083-3668 Google Scholar
T. J. Pfefer,
“Temporally and spectrally resolved fluorescence spectroscopy for the detection of high grade dysplasia in Barrett’s esophagus,”
Lasers Surg. Med., 32
(1), 10
–16
(2003). http://dx.doi.org/10.1002/(ISSN)1096-9101 LSMEDI 0196-8092 Google Scholar
S. Andersson-Engelset al.,
“Fluorescence imaging and point measurement of tissue: application to the demarcation of malignant tumors and atherosclerotic lesion from normal tissue,”
Photochem. Photobiol., 53
(6), 807
–814
(1991). PHCBAP 0031-8655 Google Scholar
L. Marcuet al.,
“In vivo detection of macrophages in a rabbit atherosclerotic model by time-resolved laser-induced fluorescence spectroscopy,”
Atherosclerosis, 181
(2), 295
–303
(2005). http://dx.doi.org/10.1016/j.atherosclerosis.2005.02.010 ATHSBL 0021-9150 Google Scholar
Q. Fanget al.,
“Time-domain laser-induced fluorescence spectroscopy apparatus for clinical diagnostics,”
Rev. Sci. Instrum., 75
(1), 151
–162
(2004). http://dx.doi.org/10.1063/1.1634354 RSINAK 0034-6748 Google Scholar
Y. Sunet al.,
“Simultaneous time- and wavelength-resolved fluorescence spectroscopy for near real-time tissue diagnosis,”
Opt. Lett., 33
(6), 630
–632
(2008). http://dx.doi.org/10.1364/OL.33.000630 OPLEDP 0146-9592 Google Scholar
S. Shresthaet al.,
“High-speed multispectral fluorescence lifetime imaging implementation for in vivo applications,”
Opt. Lett., 35
(15), 2558
–2560
(2010). http://dx.doi.org/10.1364/OL.35.002558 OPLEDP 0146-9592 Google Scholar
Y. Sunet al.,
“Fluorescence lifetime imaging microscopy: in vivo application to diagnosis of oral carcinoma,”
Opt. Lett., 34
(13), 2081
–2083
(2009). http://dx.doi.org/10.1364/OL.34.002081 OPLEDP 0146-9592 Google Scholar
H. Xieet al.,
“Multispectral scanning time-resolved fluorescence spectroscopy (TRFS) technique for intravascular diagnosis,”
Biomed. Opt. Express, 3
(7), 1521
–1533
(2012). http://dx.doi.org/10.1364/BOE.3.001521 BOEICL 2156-7085 Google Scholar
P. A. De Beuleet al.,
“A hyperspectral fluorescence lifetime probe for skin cancer diagnosis,”
Rev. Sci. Instrum., 78
(12), 123101
(2007). http://dx.doi.org/10.1063/1.2818785 RSINAK 0034-6748 Google Scholar
Y. Yuanet al.,
“High-throughput acousto-optic-tunable-filter-based time-resolved fluorescence spectrometer for optical biopsy,”
Opt. Lett., 34
(7), 1132
–1134
(2009). http://dx.doi.org/10.1364/OL.34.001132 OPLEDP 0146-9592 Google Scholar
J. A. Joet al.,
“Fast model-free deconvolution of fluorescence decay for analysis of biological systems,”
J. Biomed. Opt., 9
(4), 743
–752
(2004). http://dx.doi.org/10.1117/1.1752919 JBOPFO 1083-3668 Google Scholar
R. W. K. Leunget al.,
“Effects of incomplete decay in fluorescence lifetime estimation,”
Biomed. Opt. Express, 2
(9), 2517
–2531
(2011). http://dx.doi.org/10.1364/BOE.2.002517 BOEICL 2156-7085 Google Scholar
B. W. PogueM. S. Patterson,
“Review of tissue simulating phantoms for optical spectroscopy, imaging and dosimetry,”
J. Biomed. Opt., 11
(4), 041102
(2006). http://dx.doi.org/10.1117/1.2335429 JBOPFO 1083-3668 Google Scholar
D. A. Glenaret al.,
“Acousto-optic imaging spectropolarimetry for remote sensing,”
Appl. Opt., 33
(31), 7412
–7424
(1994). http://dx.doi.org/10.1364/AO.33.007412 APOPAI 0003-6935 Google Scholar
G. Georgievet al.,
“Spectral characterization of acousto-optic filters used in imaging spectroscopy,”
Appl. Opt., 41
(1), 209
–217
(2002). http://dx.doi.org/10.1364/AO.41.000209 APOPAI 0003-6935 Google Scholar
T. Glanzmannet al.,
“Time-resolved spectrofluorometer for clinical tissue characterization during endoscopy,”
Rev. Sci. Instrum., 70
(10), 4067
–4077
(1999). http://dx.doi.org/10.1063/1.1150038 RSINAK 0034-6748 Google Scholar
W. R. Lloydet al.,
“Instrumentation to rapidly acquire fluorescence wavelength-time matrices of biological tissues,”
Biomed. Opt. Express, 1
(2), 574
–586
(2010). http://dx.doi.org/10.1364/BOE.1.000574 BOEICL 2156-7085 Google Scholar
L. MarcuB. A. Hartl,
“Fluorescence lifetime spectroscopy and imaging in neurosurgery,”
IEEE J. Sel. Top. Quant., 18
(4), 1465
–1477
(2012). http://dx.doi.org/10.1109/JSTQE.2012.2185823 IJSQEN 1077-260X Google Scholar
|


