|
|
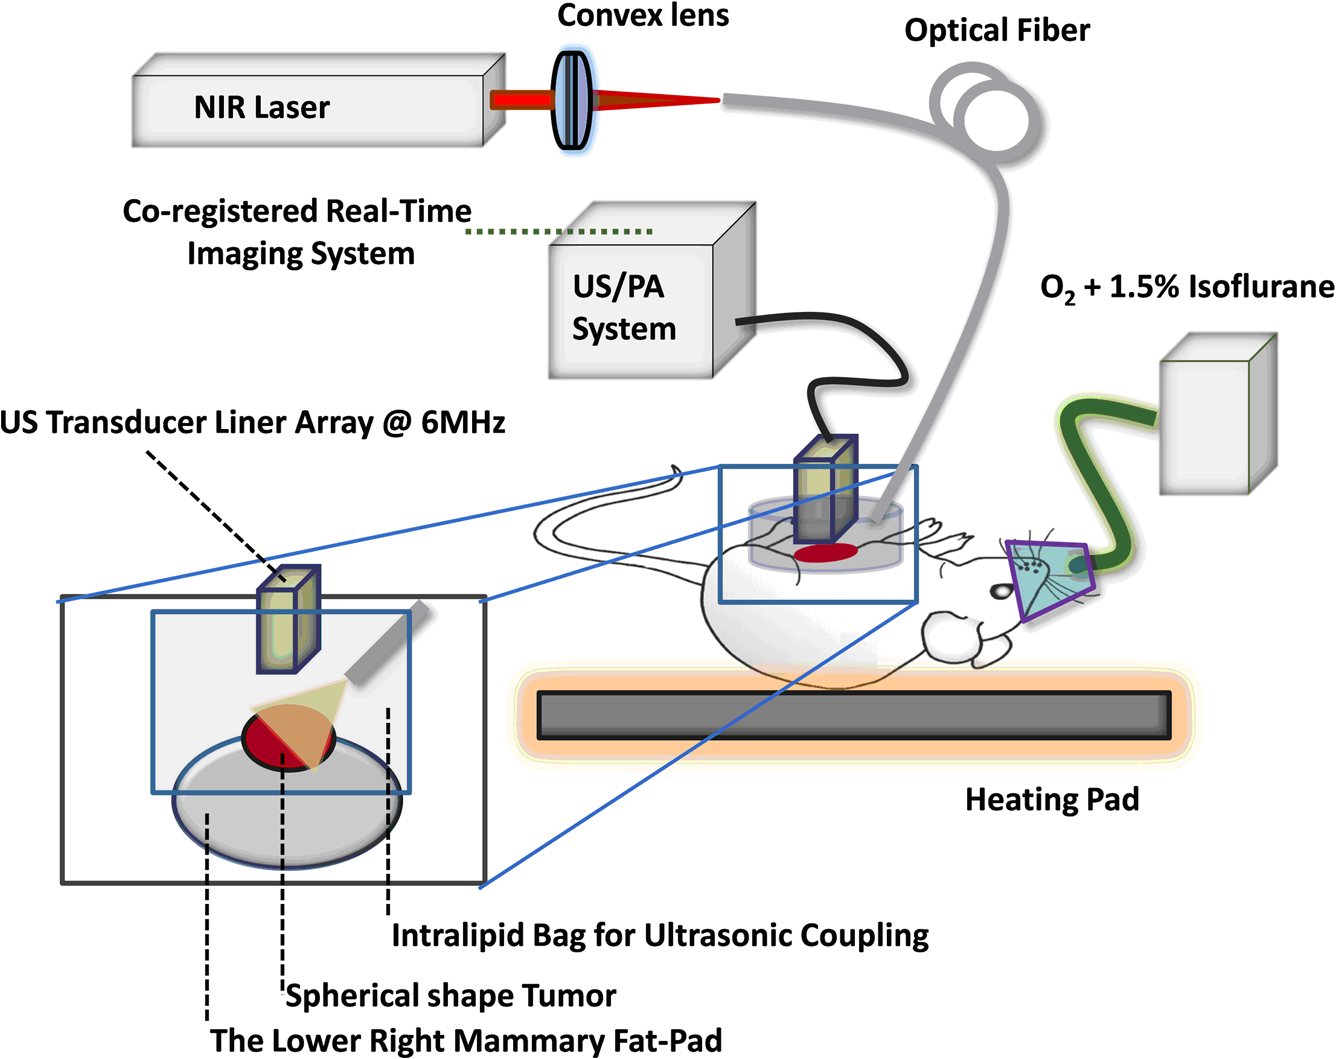
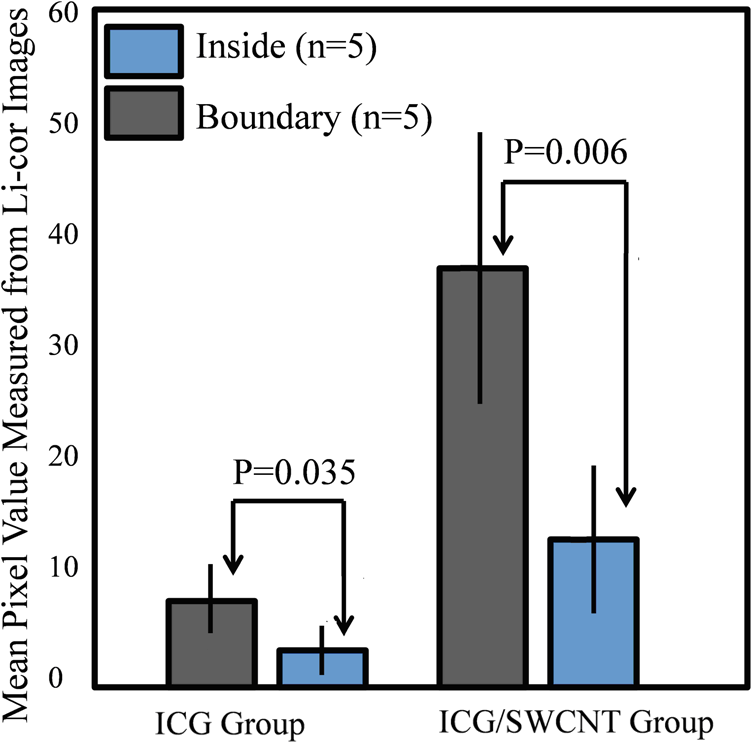
1.Introductionindocyanine green (ICG) is a photosensitive dye with considerable absorption and fluorescence in the near-infrared (NIR) wavelength region.1 It has negligible toxicity, and the U.S. Food and Drug Administration has approved its use for ophthalmic imaging, assessment of cardiac output, and hepatic function.2,3 ICG’s desirable optical characteristics have motivated many studies, which utilize it as a sensitizer for photothermal therapy of tumors,4 photodynamic therapy,5 tissue welding,6 estimation of burn depth,7 and imaging vascularization and blood flow within breast tumors, skin, and the brain.8–11 However, ICG is cleared rapidly from the bloodstream, and its total concentration decreases with a half-life on the order of 2 to 4 min.12 Previous studies indicate that ICG exhibits nonspecific binding to blood proteins, such as albumin and high-density lipoproteins, and is finally eliminated from the general circulation by the renal system and the liver.13,14 To overcome ICG’s rapid circulation kinetics, other investigators developed several strategies such as encapsulating it within poly(lactic-co-glycolic acid) or micelles, embedding it within a lipid suspension, and through noncovalent interaction with nanoparticles.15–20 It has been demonstrated that developing a delivery system for ICG that provides efficient dye loading increases the utility of ICG for diagnostic and therapeutic applications.21 Within the family of nanomaterials, there is a great interest in the use of carbon-based nanostructures for various biomedical applications.22 Carbon nanotube (CNT) has emerged not only as a new alternative and efficient transporter of therapeutic molecules, but also as an optical imaging agent owing to its strong optical absorption in the NIR region.23 Drugs, antibodies, and nucleic acids could functionalize as single-wall CNTs (SWCNTs) to prepare an appropriate system for delivering the cargos to the cells and the organs. Additionally, the broad absorption spectrum of SWCNTs provides a wide range of optical wavelengths for imaging. The narrow absorption spectra of a number of contrast agents have restricted their use to a particular wavelength.24,25 Photoacoustic tomography (PAT) is an emerging modality that provides optical absorption contrast of biological tissues at ultrasound resolution.26–29 In PAT, a short-pulsed laser beam is used to illuminate the tissue. Upon absorption of the light by the tissue, ultrasound waves are generated due to thermoelastic expansion. An array ultrasound transducer is used to receive the generated photoacoustic waves, which are used to reconstruct the images that show the light absorption distribution of the tissue. If the laser illumination has a wavelength within the NIR window from 600 to 900 nm, the tissue absorption is mainly due to hemoglobin, while water and other tissue constituents (e.g., fat) have low absorption. Furthermore, light scattering in NIR region is lower than that in the visible wavelength range allowing for deeper tissue penetration.30 This makes PAT imaging in the NIR region an excellent tool to reveal the complex vasculature distribution or angiogenesis of tumors. In order to enhance the contrast of PAT, several research groups have explored the use of exogenous ICG or CNT individually. Pramanik et al. used pure SWCNT as a contrast agent for photoacoustic mapping of the sentinel lymph node (SLN).31 They successfully imaged the SLN in vivo with high contrast-to-noise ratio and good resolution. They showed that SWCNTs had a wideband optical absorption and generated PAT signals over a wavelength range of 740 to 820 nm. Thus, by tuning the light illumination wavelength to this region, the imaging depth can be maximized. Kim et al. used ICG-embedded nanoparticles that are incorporated with a cancer-specific target as a contrast agent for PAT.17 Embedding ICG in nanoparticles improved the stability of ICG in aqueous solution as compared with free ICG. Their initial in vitro characterization results showed a high contrast and high efficiency for the agent to bind to prostate cancer cells. Further studies by Rajian et al. used perfluorocarbon emulations to encapsulate ICG, and keep it optically stable for use as a contrast agent for optical imaging.32 A recent study by Wang et al. have found an effective application of protamine-functionalized SWCNTs for stem-cell labeling and for in vivo Raman/magnetic resonance/photoacoustic triple-modal imaging.33 Their work revealed that SWCNTs with appropriate surface functionalization have the potential to serve as multifunctional nanoprobes for stem-cell labeling and multimodal in vivo tracking. There are few reports in the literature that describe the use of CNT as a carrier of ICG for enhancing photoacoustic contrast. Recently, de la Zerda et al. reported a new sensitive CNT agent for photoacoustic imaging and demonstrated the performance of the agent in mice.34 This contrast agent is based on attaching ICG to the surface of the nanotubes through stacking interactions. Additionally, this agent is conjugated with cyclic Arg-Gly-Asp (RGD) peptides to molecularly target the alpha(v)beta(3) integrins, which are associated with tumor angiogenesis. In this article, we present a novel photoacoustic contrast agent that is based on bis-carboxylic acid derivative of ICG35 covalently conjugated to the SWCNT (ICG/SWCNT). Using ICG/SWCNT as a contrast agent exhibits a much higher peak absorbance compared with plain SWCNTs. The performance of the new contrast agent in mouse tumor models is demonstrated in vivo using our custom-built co-registered ultrasound and photoacoustic imaging system.36 Both ultrasound pulse-echo (PE) image and PAT image of the mouse are captured and stored throughout the experiments to provide the tumor morphology and light absorption distribution longitudinally. It is known that ultrasound probes tumor mechanical contrast and provides tumor morphology, while the PAT maps tumor angiogenesis and provides tumor functional information. Co-registered PE/PAT imaging is an excellent tool to diagnose ultrasonically identified lesions based on lesion vascular contrast provided by PAT. Postprocessing of the PAT data shows approximately two times higher enhancement of ICG/SWCNT than ICG, which is further validated by fluorescence images of the excised tumor samples. 2.Materials and Methods2.1.Functionalizing SWCNTIn the functionalization process, Pristine SWCNTs (Sigma-Aldrich, St. Louis, Missouri) were first immersed in a mixture of (98 vol %) and (68 vol %) () exposed to the ambient atmosphere. The SWCNTs were then immersed in an ultrasound bath (500 W) for 2 h. The chloridric acid was then added to the solution with slow agitation, followed by ammonium hydroxide until the solution was neutralized. The resulting solution was then filtered with a 0.22-mm cellulose acetate membrane. The SWCNTs were washed several times with deionized water to a pH of 5.5. The residue was dried in an oven at 60°C for 18 h to obtain carboxylated CNTs (SWCNTs-COOH). Reaction of thionyl chloride with carboxyl-contained SWCNT (CNT–COOH) gave carbonyl chloride groups-functionalized SWCNTs (SWCNT-COCl), which is the intermediate product for further chemical functionalization. The SWCNT-COCl was treated with triethylenetetramine to generate SWCNT-.37 2.2.Bis-Caboxylic Acid-ICG/SWCNTBis-caboxylic acid-ICG was covalently attached to amino-functionalized SWCNT via the conversion of the bis-caboxylic acid-ICG to the corresponding acid chloride using oxalyl chloride. Details that concern the preparation of our bis-caboxylic acid-ICG, referred to as ICG in the rest of the article, can be found in Ref. 38. The acid chloride ICG was not isolated, but immediately treated with the amino-functionalized SWCNT (SWCNT-), heated in toluene at reflux for 1 h, and then stirred for an additional 5 h. The mass ratio of ICG to functionalized nanotube used was . The unbound ICG was removed from the solution through a 100-kDa centrifuge filter (millipore tube), followed by six washes with water. The unbound ICG compound passed through the filter dissolved in the water, while the insoluble SWCNT-bound ICG remained. Covalent attachment was confirmed through Raman, ATR-IR spectroscopy, and TGA (data are not presented here). Absorption spectra of plain SWCNT and ICG/SWCNT were acquired from 600 to 800 nm in 1-mm cuvettes using the UV-Vis spectrometer (Varian Analytical Instruments, Walnut Creek, California). The spectra were acquired at a scan speed of . 2.3.Cell Line, Mice, and Histology4T1 Luc cells were regularly cultured at 37°C with 5% in RPMI 1640 medium (Gibco, Grand Island, New York), supplemented with 10% FBS, penicillin/streptomycin, 2 mM L-glutamine, and 1 mM pyruvate. The 4T1 Luc cells were passed three times in a T75 flask (BD Biosciences, Bedford, Massachusetts) prior to this study, and the confluency was 70% to 80%. In vivo experiments were performed using a murine tumor model (4T1 mammary cancer cells grown in Balb/c mice). The animal protocol was approved by the Institutional Animal Care and Use Committee of University of Connecticut. 4T1 breast cancer cells () were injected into the lower right mammary fat-pad of 7-week old Balb/c female mice. The experiments were performed when the tumor sizes reached approximately 6 to 8 mm in diameter and 2 to 3 weeks postinoculation. All experiments were performed under anesthesia by the inhalation of 1.5% isoflurane. A dose of 100 μL of 100 μM ICG dye and ICG/SWCNT was injected in each mouse using retro-orbital injection technique. For histology, after overnight fixation in 4% paraformaldehyde, the tumor samples were dehydrated progressively through 30%, 50%, 70%, 90%, and 100% ethanol, and then placed in OCT embedding medium (Tissue-Tek, Torrance, California). Tumor samples were sectioned at 10 μm on a cryostat (Leica CM3050S, Leica Microsystems, Nussloch, Germany), and stored at . 2.4.Imaging ExperimentsA total of 10 mice were imaged by our co-registered PE/PAT imaging system.36 A Ti:Sapphire (Symphotics TII, LS-2134, Camarillo, California) laser optically pumped with a Q-switched Nd:YAG laser (Symphotics-TII, LS-2122) delivered 15 Hz, 20-ns pulses at 755-nm wavelength. The energy density of the laser beam was kept at , which is under the ANSI-specified energy limit of . The laser beam was coupled into a 1-mm core multimode fiber using a converging lens, as shown in Fig. 1. The light exiting from the fiber then passed through intralipid to homogenize the beam before illuminating on the tumor area. The intralipid also served as the coupling medium between the transducer and mouse tumor. Before imaging, the mice were shaved and placed in supine position on a heating pad. The intralipid bag was placed between the mouse and a linear ultrasound transducer of 6-MHz center frequency and 80% bandwidth (W. L. Gore and Associates, Inc., Newark, Delaware). The central 64 channels of this 128-channel linear ultrasound transducer were used by the system. To monitor the effect of ICG or ICG/SWCNT injection on the absorption within the tumor area, co-registered PE/PAT images and the corresponding radio frequency (RF) data or transducer data were acquired for up to 80 min for the ICG group and 80 to 165 min (120 min on average) for the ICG/SWCNT group. Five mice were injected with ICG and the other five with ICG/SWCNT. Ideally, monitoring for an extended period of time is required to obtain complete tumor wash-out characteristics of ICG/SWCNT group. However, such monitoring would require the mice to be under anesthesia for an extended period of time. The studies had to be terminated after 80 to 165 min, due to animal study constraints. 2.5.Image Reconstruction and Data ProcessingThe imaging system was capable of capturing and storing RF data, and then forming and storing co-registered PE/PAT images at a rate of 3 frames per second.36 In mouse experiments, we averaged the RF data over seven times to achieve a better signal-to-noise ratio (SNR), and thus the corresponding imaging rate is about 2.5 seconds per frame. Both PE and PAT images were formed using standard delay-and-sum beam-forming algorithm.39,40 The envelopes of the beam data were interpolated via scan conversion to each pixel, followed by a logarithmic dynamic range compression. Each PE image was normalized to its own maximum and displayed at 45-dB dynamic range. The PAT images were normalized to the maximum PAT beam envelope, referred as the PAT reference, of all image frames. In this article, SNR is defined as PAT dynamic range was set to be the same as SNR to maximize the visualization of the light absorption. In mouse experiments, for the regions several centimeters away from tumor sites, there was no PAT signal due to limited light penetration. Therefore, we have used the averaged peak envelopes of the photoacoustic beams in these regions as our system noise thresholds. The variations of system noise thresholds from different mouse experiments were very small, and we used the mean value of them to distinguish PAT signals from tumors. The co-registered PE/PAT image was an 8-bit BMP file. The lower half of its color map was gray scaled and was assigned to the PE part, while the upper half was color-coded (red to yellow) and was assigned to the PAT counterpart, as shown in Fig. 3. Because the shape of the tumors was approximately round, a circular window was chosen, depending on the tumor structure and size information in PE image, to closely define the tumor area for computing PAT summation signal. For each mouse, the summation of PAT beam envelope higher than system noise threshold was computed within the chosen window for each frame and used to estimate the total tumor uptake and wash-out profiles for each experiment. To compensate for the laser energy drifting and fluctuations throughout the long experiment, 3% of the output laser energy was split using a beam splitter. It was coupled into a photodiode (PDA10A, ThorLabs, Newton, New Jersey), and the temporal profile of the laser pulse was measured and recorded by a DAQ board (CS22G8, DynamicSignals, Lockport, Illinois) at 1-GHz sampling rate. For each PAT frame, seven sets of PAT RF data and the corresponding photodiode output of the laser pulses were synchronously acquired and averaged by the imaging system to increase PAT SNR. Beam envelope of each PAT frame was divided by the average laser pulse peak before it was used to compute a PAT summation signal (compensated PAT summation). This method was verified by imaging fixed absorption phantoms for over 2 h. Verification experiments were repeated 10 times, and the standard deviation in the compensated PAT summation signal was in the range of of its mean. The reconstructed PAT beam envelope showed the initial pressure distribution in the imaging plane, which is a product of the Grüneisen coefficient, local light fluence, and light absorption coefficient.41 We assumed that the Grüneisen coefficient and local light fluence did not change much with time in each pixel location after the laser energy compensation, and the change in the PAT beam envelope was proportional to the light absorption coefficient. The change in the light absorption coefficient in turn was due to the hemoglobin contrast and injected dyes in our experiments. Consequently, the change in the PAT beam envelope signal was the result of the progressive uptake and wash-out characteristics of the injected dyes at tumor sites. This is approximately correct provided that the change in the compensated PAT summation caused by intrinsic hemoglobin contrast is negligible. 2.6.Fluorescence ScannerTen-micrometer frozen tumor sections were dried and imaged by an Odyssey Infrared Imaging System (Li-COR Biosciences, Lincoln, Nebraska). This instrument provides scan resolution ranging from 21 to 339 μm. The fluorescence images obtained for this article were acquired at the highest resolution of 21 μm. The selected excitation channel was 785 nm and the emission channel was 820 nm with a bandwidth of 40 to 50 nm. The images were obtained from the analysis software provided by the company. The length of time the laser spends on any given point is the dwell time. The laser dwell time per pixel of the Odyssey system used in this study, is approximately equal to the resolution/speed. The speed is set by the quality setting and varies from at the highest quality to for the lowest. Laser intensity is constant. In our experiments at and , . All samples in this article were imaged using the same setup parameters for the Odyssey Infrared Imaging System in terms of resolution, brightness, and contrast. Two quantitative terms were computed from the fluorescence images using Image J software package.42 The first term was the mean pixel value of the fluorescence images in the entire sample area. The second term was the mean pixel values of fluorescence images only inside thr tumor and at the boundary of the tumor for each sample. A window was used to measure the mean intensity of the tumor interior and boundary. For each fluorescence image, Image J measured 10 peripheral and two central areas, and the mean pixel values in the peripheral and central areas were used to obtain the relative fluorescence intensity ratio of each mouse sample, because the pixel value in fluorescence image was proportional to the average fluorescence intensity. This procedure was repeated for five ICG and five ICG/SWCNT samples. 3.ResultsFigure 2(a) shows the chemical structure of the bis-caboxylic acid-ICG covalently attached to an amino-functionalized SWCNT, and Fig. 2(b) shows the optical absorbance spectrum of this compound. The peak observed at 750 nm exhibits more than 25-fold higher absorbance at the same wavelength compared with the nonfunctionalized SWCNT. Fig. 2(a) Chemical structure of the prepared bis-caboxylic acid-indocyanine green (ICG) covalently attached to an amino-functionalized single-wall carbon nanotube (SWCNT). ICG unit can bind to single CNT through amide bonds or it can bind to two carbon nanotubes through the bridge by forming amide bonds on both ends. (b) Optical absorbance spectrum of the bis-caboxylic acid-ICG covalently attached to an amino-functionalized SWCNT.  Two examples of co-registered PE/PAT images of ICG/SWCNT- and ICG-injected mice are shown in Fig. 3(b) and 3(c) and Fig. 3(e) and 3(f), respectively. There is also an example of control without injection of contrast agent, as shown in Fig. 3(h) and 3(i). Because the maximum PAT beam envelope in ICG/SWCNT experiment is higher than that in ICG and the control case, we have different PAT dynamic ranges (25, 20, and 18 dB, respectively) for the three examples to obtain better visualization of these three sets of images. In all studies, the PE images reveal a hypoechoic mass near the skin surface, which was verified at the beginning of each experiment to be the tumor area. Note the color bar in Fig. 3 is the color map used for the display of PE image or co-registered PE/PAT image. In postprocessing, PAT reference in ICG/SWCNT experiment is different from that in ICG experiment and control case. Thus, the same color in these three sets of images corresponds to different levels of light absorption except the pure red, which corresponds to system noise threshold. Fig. 3Co-registered PE/PAT images acquired at tumor sites. (a) Pulse-echo (PE) image of ICG/SWCNT-injected mouse at injection point. (b) Co-registered PE/PAT image of ICG/SWCNT-injected mouse at injection point. (c) Co-registered PE/PAT image of ICG/SWCNT-injected mouse at 80 min after injection (enhancement peak of ICG/SWCNT). (d) PE image of ICG injected mouse at injection point. (e) Co-registered PE/PAT image of ICG-injected mouse at injection point. (f) Co-registered PE/PAT image of ICG-injected mouse at 20 min after injection (enhancement peak of ICG). (g) PE image of control sample. (h) Co-registered PE/PAT image of control sample at the experiment’s start point. (i) Co-registered PE/PAT image of control sample after 54 min. The signal-to-noise ratio (SNR) for PAT was 25 dB in (b, c), 20 dB in (e, f), and 18 dB in (h, i); while SNR for PE was 64 dB in (a–c), 49 dB in (d–f), and 48 dB in (g–i). For display, the PAT dynamic range was set to be the same as PAT SNR to maximize the visualization, while the PE dynamic range was kept to be 45 dB in all subfigures.  The compensated PAT summation signal for the ICG/SWCNT-injected mouse tumor in Fig. 3(b) and 3(c) and the ICG-injected mouse tumor in Fig. 3(e) and 3(f) are shown in Fig. 4(a) and 4(b), respectively. The control case is given in Fig. 4(c). The co-registered PE/PAT images shown in Fig. 3(b) and 3(c) and the corresponding PAT summation signal shown in Fig. 4(a) indicates that most of the ICG/SWCNT dye uptake by the tumor is distributed around the periphery, and the compensated PAT summation signal is 3.32 times higher than the preinjection level. The images shown in Fig. 3(e) and 3(f) reveal similar periphery enhancement but have much weaker compensated PAT summation signal of 1.50 times higher at the peak of the post-ICG injection as compared with the preinjection level. The corresponding PAT summation signal increases after injection, reaches a peak after about 20 min and then slowly reduces to the preinjection level at around 60 to 80 min, as shown in Fig. 4(b). This is in sharp contrast to the ICG/SWCNT-injected mouse [Fig. 4(a)], in which the compensated PAT summation signal keeps increasing during the entire experiment. Note that Fig. 3(c) was obtained at 80 min postinjection of ICG/SWCNT, and Fig. 3(h) was at the peak enhancement of ICG around 20 min. Fig. 4(a, b) Typical compensated PAT summation curves of ICG/SWCNT- and ICG-injected groups. (a) Compensated PAT summation of ICG/SWCNT-injected mouse with PAT images shown in Fig. 3(c) and 3(d). (b) Compensated PAT summation of ICG-injected mouse with PAT images shown in Fig. 3(g) and 3(h). (c) Compensated PAT summation curve for tumor mouse without dye injection.  In our experiment, the light absorption mainly comes from intrinsic hemoglobin and injected dyes. Both contribute to the compensated PAT summation signal during the experiment. Figure 4(c) shows the corresponding compensated PAT summation of the mouse without injection and monitored for 54 min. The curve is almost flat, and the standard deviation is only 4.78% of its mean. It shows that the hemoglobin contrast of the mouse tumor under anesthesia for longer PE/PAT experiment causes negligible change in the PAT summation signal. The compensated PAT summation signals in ICG/SWCNT and ICG experiments are mainly caused by the injected dyes. The statistical analysis of the normalized compensated PAT summation signals for the ICG- and ICG/SWCNT-injected mice is shown in Fig. 5, revealing that ICG is able to provide 1.33 () times higher compensated PAT summation than the preinjection level at approximately 20 min peak response time. On the other hand, ICG/SWCNT provides 2.28 () times higher compensated PAT summation than the preinjection level at 80 min and an even higher ratio of 2.96 () at the end point of the experiments (120 min on average). Statistical significance was achieved between the two groups at 80 min (). If the end point of compensated PAT summation signal of ICG/SWCNT was compared with that of ICG group, the statistical significance is even higher with . Fig. 5Statistics of normalized PAT summation signals after compensation obtained at injection point 20- and 80-min postinjection of ICG and ICG/SWCNT groups and end points of the ICG/SWCNT group. 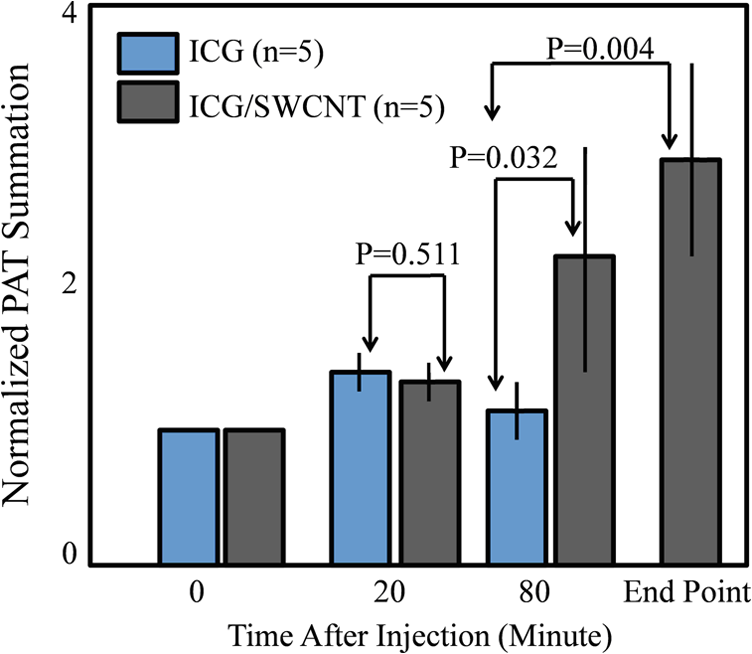 The ex vivo fluorescence images obtained from excised tumor samples (Fig. 6) help to visualize the distribution of both ICG/SWCNTs and ICG. Figure 6(b) demonstrates the significant increase in ICG/SWCNT accumulation and also the peripheral distribution, while Fig. 6(a) shows weaker ICG fluorescence signals and more uniform distribution. The fluorescence images obtained from tumor samples support the photoacoustic findings. Figure 7 shows the statistics of mean pixel value of the entire samples measured from ex vivo fluorescence images obtained from two groups of ICG and ICG/SWCNT using Odyssey Infrared Imaging System. The mean pixel value of the entire sample is 5.68 () for the ICG group and 41.00 () for the ICG/SWCNT group. This difference is statistically significant (). Fig. 6Ex vivo fluorescence images of harvested tumors. (a) Ex vivo fluorescence image of ICG-injected tumor sample. (b) Ex vivo fluorescence image of ICG/SWCNT-injected tumor sample. 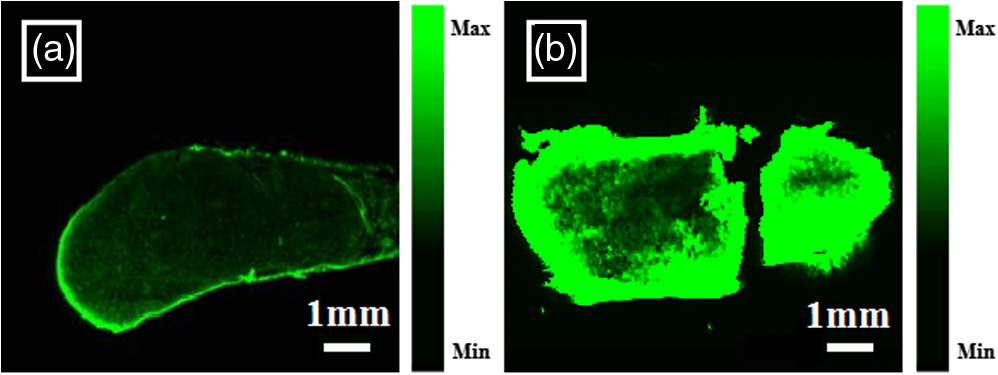 Fig. 7Statistics of mean pixel value of the entire samples measured from ex vivo fluorescence images obtained from tumor samples of two groups.  We also compared the statistical significance of the mean pixel value of the tumor interior and tumor boundary in fluorescence images for the two groups (Fig. 8). For the ICG group, the mean pixel value of the interior is 3.22 () and the mean at the tumor boundary is 8.13 () (). For the ICG/SWCNT group, the mean pixel value of the interior is 12.30 () and the mean pixel value at the tumor boundary is 36.46 () (). The statistical significance between the mean intensities of the inside and the periphery of ICG/SWCNT group increased significantly compared with that of ICG. 4.Discussion and SummaryIn our experiments, the compensated PAT summation signal after injection from ICG group always decreased to preinjection level after approximately 60 to 80 min. However, the compensated PAT summation signal after injection from ICG/SWCNT group was always increasing during experiment. Ideally, we would like to record the complete postinjection wash-out characteristics of ICG/SWCNT. However, the condition of the mice under long periods of anesthesia is very unpredictable. Repositioning of the tumor back to the same imaging plane of the PAT imaging system for continuous monitoring after an anesthesia break is a challenging task, because the high-resolution PAT images are very sensitive to the relative positions of the mouse tumor and the ultrasound transducer. Since our goal was to compare uptake and wash-out characteristics of ICG and ICG/SWCNT and to quantify the contrast improvement of ICG/SWCNT in a similar time frame, we recorded the PAT data of the ICG/SWCNT-injected mouse group from 80 to 165 min, depending on the health condition of each mouse. At 20-min postinjection, which was the peak enhancement of ICG, we obtained a similar enhancement of 29% and 33% for ICG and ICG/SWCNT (), respectively. However, at 80-min postinjection, the ICG/SWCNT demonstrated 128% enhancement, while ICG was at a similar preinjection level (). If the end point of the compensated PAT summation in the ICG/SWCNT group was used to compute the enhancement, 196% enhancement was achieved (). It is highly likely that the PAT signal of ICG/SWCNT would continuously rise beyond the end point and that would provide further contrast enhancement. It is not surprising that we have observed prolonged PAT enhancement with the ICG/SWCNT. The microenvironments of solid tumors are fundamentally different from normal tissues. It includes poorly organized vascular architecture, impaired lymphatic system, poor oxygenation, acidosis, higher interstitial fluid pressure, and the presence of the extracellular matrix.43,44 It has been reported that the degree of penetration of nanoparticles through the cancer cells depends on several factors including size,45 morphology,46 and surface charge.47 The enhanced permeability and retention (EPR) effect aids in nanoparticles diffusion and convection through abnormal large fenestrations tumor vasculature and the inefficient lymphatic drainage. EPR allows nanoparticles generally less than 150 nm in diameter to cross from vasculature into the interstitium.48 Generally, diffusion of nanoparticles into solid tumors is limited by the interactions with high-density cells, presence of the extracellular matrix as a transport barrier, and higher interstitial fluid pressure.49 Huo et al. studied the size effect of gold nanoparticles on the localization and penetration behavior in tumor.50 They showed that small size nanoparticles penetrated more deeply into tumor and accumulated more effectively after a single intravenous dose. In contrast, larger nanoparticles were primarily localized in the periphery of the tumor spheroid and around blood vessels hindering deep penetration into tumors. In our study, we used SWCNTs with lengths ranging from 100 to 1000 nm. Although it is desirable to enhance the delivery of contrast agents or drugs into interior of the tumor using smaller nanoparticles, the observed periphery enhancement from PAT images and confirmed measurements from fluorescence images is valuable in guiding surgeons to assess tumor boundary and to improve surgical resection of tumors for achieving clean tumor margins.51 Future studies will be focused on the synthesis of ICG/SWCNT with tumor-targeting agents or drugs of different sizes for potential diagnostic and therapeutic applications. Both ICG, from Sigma-Aldrich, and bis-caboxylic acid-ICG are small molecules (on the order of 1 nm). We believe that removal mechanisms for both compounds are the result of renal clearance and elimination of residues from general circulation by the liver. Bis-caboxylic acid-ICG, however, is able to remain in the body for a longer time. ICG from Sigma-Aldrich contains a naphthindole unit in the ICG dye rather than the simple indole unit present in our dye. We incorporated a carboxylic acid group on the benzene ring, i.e., an indolecarboxylic acid rather than a naphthindole moiety. Since the ICG derivative contains two indole units, there are two carboxylic acid groups in the ICG used in this study. The replacement of the naphthindole with an indolecarboxylic acid may influence the aggregation issue, which was predominant in the commercially available variant of the dyes. The di-carboxylic acid moiety certainly increased the ICG dye solubility in aqueous solutions, which we believe led to a longer resistance in the circulation in comparison with ICG from Sigma-Aldrich. Further, we utilized these reactive COOH moieties to covalently attach the SWCNT to the dye. The excretion of bis-carboxylic acid derivative-ICG covalently conjugated to SWCNTs is strongly dependent on the size, shape, and surface chemistry, and it may happen via renal and fecal pathways52 and need a much longer time in comparison with ICG groups alone, as the size of the ICG/SWCNT particles are much larger than that of ICGs. Nonfunctionalized CNTs seem to be able to remain in the body for a long time, but not permanently. Ryman-Rasmussen et al. showed the inhaled nanotubes remained in the subpleural wall for at least 14 weeks.53 Elgrabli et al. showed that the large numbers of CNTs instilled into the lungs of rats were cleared after 3 months.54 On the other hand, the length of CNTs has a great impact on the clearance process, and a high aspect (length to width) ratio can influence biopersistence.55 The recent studies indicate that there is a completely different story for functional CNTs.56 Singh et al. reported that surface-functionalized, water-dispersible SWCNTs (average diameter 1 nm; average length 300 to 1000 nm) were capable of rapid and effective renal clearance and urinary excretion with a blood circulation half-life of about a few hours.57 In this study, we believe that the removal mechanism for SWCNT is the result of rapid renal clearance and elimination of residues from general circulation by the liver. Because of experimental constraints for animals under continuous anesthesia, we could not monitor the ICG/SWCNT-injected mice for several hours in this study. Future studies will consider starting experiments after injecting ICG/SWCNT for a certain period of time to assess the life time of ICG/SWCNT. This study has limitations. In a previous work, we found that simply mixing the ICG and the SWCNT together was ineffective in accumulating the dye in the tumor. We attributed this to the lack of covalent binding that led to quick wash-out of the ICG molecules. We therefore reacted the SWCNT with triethylenetetramine to generate SWCNT-. We also prepared our bis-carboxylic acid-ICG dye via previously reported methodology. The free carboxyl groups were converted to the corresponding acid chloride by reaction with oxalyl chloride, and subsequent reaction with SWCNT- gave the ICG-SWCNT-. Successive filtration and washings removed noncovalently attached ICG and SWCNT- leaving the covalently bound ICG-SWCNT-. Analysis by Raman IR showed the band at 514 nm, consistent with the expected amide moiety. The insolubility of this complex in the solvents required to do NMR and the lack of the volatility to the obtained cogent mass spectral data made it virtually impossible to exactly determine the extent of covalent bonding. We attempted to determine the weight % and found that 192 mg of the ICG resulted in 88 mg of the ICG-SWCNT-. However, we were unable to separate the unreacted starting material in sufficient purity to accurately determine the mass of the unreacted ICG or the unreacted SWCNT-, which makes the weight % calculation unreliable. While we cannot determine where the units are attached or exactly how many units are attached per unit of the dye, the Raman IR data clearly shows covalent binding. Based on the literature data, a covalent attachment system generally improves delivery of cargos to the target site.58 For example, the covalent attachment of electroactive groups on the side-wall of CNTs is a good strategy to avoid any loss of these groups by diffusion in the solution.59 However, to the best of our knowledge, there is no report in the literature on delivery of ICGs through covalent attachment to SWCNTs; this could be a future topic of research. In summary, we have presented a novel photoacoustic contrast agent which is based on bis-carboxylic acid derivative of ICG covalently conjugated to SWCNT (ICG/SWCNT). The detection sensitivity of the new contrast agent in a mouse tumor model was demonstrated in vivo using ICG- and ICG/SWCNT-injected mice. It was shown that ICG/SWCNT provides approximately two times higher postinjection contrast than ICG. Additionally, the ICG/SWCNT enhancement was mainly observed at the tumor periphery, due to the size and shape of the SWCNTs, which is valuable in guiding surgeons to assess tumor boundaries in order to achieve clean tumor margins, and thereby to improve the surgical resection of tumors. AcknowledgmentsThe authors thank the partial funding support of this work from the National Institute of Health (R01EB002136 and R01CA151570) and the Connecticut Public Health under contact #2011-0141. ReferencesR. Philipet al.,
“Absorption and fluorescence spectroscopic investigation of indocyanine green,”
J. Photochem. Photobiol. A, 96
(1), 137
–148
(1996). http://dx.doi.org/10.1016/1010-6030(95)04292-X JPPCEJ 1010-6030 Google Scholar
M. L. Landsmanet al.,
“Light-absorbing properties, stability, and spectral stabilization of indocyanine green,”
J. Appl. Physiol., 40
(4), 575
–583
(1976). JAPYAA 0021-8987 Google Scholar
R. C. BensonH. A. Kues,
“Fluorescence properties of indocyanine green as related to angiography,”
Phys. Med. Biol., 23
(1), 159
–163
(1978). http://dx.doi.org/10.1088/0031-9155/23/1/017 PHMBA7 0031-9155 Google Scholar
A. El-Desokyet al.,
“Experimental study of liver dysfunction evaluated by direct indocyanine green clearance using near infrared spectroscopy,”
Br. J. Surg., 86
(8), 1005
–1011
(1999). http://dx.doi.org/10.1046/j.1365-2168.1999.01186.x BJSUAM 0007-1323 Google Scholar
T. Wygnanski-Jaffeet al.,
“ICG angiography-guided photodynamic therapy for large pigment epithelial detachments in age-related macular degeneration,”
Ophthal. Surg Lasers Imag., 37
(5), 358
–363
(2006). Google Scholar
H. Shinoharaet al.,
“Direct measurement of hepatic indocyanine green clearance with near-infrared spectroscopy separate evaluation of uptake and removal,”
Hepatology, 23
(1), 137
–144
(1996). http://dx.doi.org/10.1002/(ISSN)1527-3350 HEPADF 0161-0538 Google Scholar
W. R. Chenet al.,
“Chromophore-enhanced laser tumor tissue photothermal interaction using an 808-nm diode laser,”
Cancer Lett., 88
(1), 15
–19
(1995). http://dx.doi.org/10.1016/0304-3835(94)03609-M CALEDQ 0304-3835 Google Scholar
S. Fickweileret al.,
“Indocyanine green: intracellular uptake and phototherapeutic effects in vitro,”
J. Photochem. Photobiol. B, 38
(2–3), 178
–183
(1997). http://dx.doi.org/10.1016/S1011-1344(96)07453-2 JPPBEG 1011-1344 Google Scholar
L. S. Basset al.,
“Changes in type I collagen following laser welding,”
Lasers Surg. Med., 12
(5), 500
–505
(1992). http://dx.doi.org/10.1002/(ISSN)1096-9101 LSMEDI 0196-8092 Google Scholar
K. Schomackeret al.,
“Biodistribution of indocyanine green in a porcine burn model: light and fluorescence microscopy,”
J. Trauma, 43
(5), 813
–819
(1997). http://dx.doi.org/10.1097/00005373-199711000-00013 JOTRA5 0022-5282 Google Scholar
A. Rubbenet al.,
“Infrared videoangiofluorography of the skin with indocyanine green—rat random cutaneous flap model and results in man,”
Microvasc. Res., 47
(2), 240
–251
(1994). http://dx.doi.org/10.1006/mvre.1994.1018 MIVRA6 0026-2862 Google Scholar
T. Veldeet al.,
“The use of fluorescent dyes and probes in surgical oncology,”
Eur. J. Surg. Oncol., 36
(1), 6
–15
(2010). http://dx.doi.org/10.1016/j.ejso.2009.10.014 0748-7983 Google Scholar
M. Jacobet al.,
“Impact of the time window on plasma volume measurement with indocyanine green,”
Physiol. Meas., 29
(7), 761
–770
(2008). http://dx.doi.org/10.1088/0967-3334/29/7/005 PMEAE3 0967-3334 Google Scholar
R. Mudraet al.,
“Analysis of nearinfrared spectroscopy and indocyanine green dye dilution with Monte Carlo simulation of light propagation in the adult brain,”
J. Biomed. Opt., 11
(4), 044
–009
(2006). http://dx.doi.org/10.1117/1.2341652 JBOPFO 1083-3668 Google Scholar
V. SaxenaM. SadoqiJ. Shao,
“Enhanced photo-stability, thermal-stability and aqueous-stability of indocyanine green in polymeric nanoparticulate systems,”
J. Photochem. Photobiol. B, 74
(1), 29
–38
(2004). http://dx.doi.org/10.1016/j.jphotobiol.2004.01.002 JPPBEG 1011-1344 Google Scholar
V. SaxenaM. SadoqiJ. Shao,
“Polymeric nanoparticulate delivery system for indocyanine green: biodistribution in healthy mice,”
Int. J. Pharm., 308
(1–2), 200
–204
(2006). http://dx.doi.org/10.1016/j.ijpharm.2005.11.003 IJPHDE 0378-5173 Google Scholar
G. Kimet al.,
“Indocyanine green-embedded PEBBLEs as a contrast agent for photoacoustic imaging,”
J. Biomed. Opt., 12
(4), 044020
(2007). http://dx.doi.org/10.1117/1.2771530 JBOPFO 1083-3668 Google Scholar
V. Rodriguezet al.,
“Encapsulation and stabilization of indocyanine green within poly(styrene-alt-maleic anhydride) block-poly(styrene) micelles for near-infrared imaging,”
J. Biomed. Opt., 13
(1), 014025
(2008). http://dx.doi.org/10.1117/1.2834296 JBOPFO 1083-3668 Google Scholar
R. Rajagopalanet al.,
“Stabilization of the optical tracer agent indocyanine green using noncovalent interactions,”
Photochem. Photobiol., 71
(3), 347
–350
(2000). http://dx.doi.org/10.1562/0031-8655(2000)071<0347:SOTOTA>2.0.CO;2 PHCBAP 0031-8655 Google Scholar
J. Devoiselleet al.,
“Preliminary study of the in vivo behaviour of an emulsion formulation of indocyanine green,”
Lasers Med. Sci., 13
(4), 279
–282
(1998). http://dx.doi.org/10.1007/s101030050008 LMSCEZ 1435-604X Google Scholar
V. B. Rodriguezet al.,
“Encapsulation and stabilization of indocyanine green within poly(styrene-alt-maleic anhydride) block-poly(styrene) micelles for near-infrared imaging,”
J. Biomed. Opt., 13
(1), 014025
(2008). http://dx.doi.org/10.1117/1.2834296 JBOPFO 1083-3668 Google Scholar
C. Chaet al.,
“Carbon-based nanomaterials: multifunctional materials for biomedical engineering,”
ACS Nano., 7
(4), 2891
–2897
(2013). http://dx.doi.org/10.1021/nn401196a 1936-0851 Google Scholar
L. ZhuangY. KaiL. Shuit-Tong,
“Single-walled carbon nanotubes in biomedical imaging,”
J. Mater. Chem., 21
(3), 586
–598
(2010). http://dx.doi.org/10.1039/c0jm02020f JMACEP 0959-9428 Google Scholar
M. HughesE. BrandinJ. Golovchenko,
“Optical absorption of DNA-carbon nanotube structures,”
Nano Lett., 7
(5), 1191
–1194
(2007). http://dx.doi.org/10.1021/nl062906u NALEFD 1530-6984 Google Scholar
S. Berciaudet al.,
“Absorption spectroscopy of individual single-walled carbon nanotubes,”
Nano Lett., 7
(5), 1203
–1207
(2007). http://dx.doi.org/10.1021/nl062933k NALEFD 1530-6984 Google Scholar
V. G. Andreevet al.,
“Optoacoustic tomography of breast cancer with arc-array transducer,”
Proc. SPIE, 3916 36
–47
(2000). http://dx.doi.org/10.1117/12.386339 PSISDG 0277-786X Google Scholar
X. Wanget al.,
“Noninvasive laser-induced photoacoustic tomography for structural and functional in vivo imaging of the brain,”
Nat. Biotechnol., 21
(7), 803
–806
(2003). http://dx.doi.org/10.1038/nbt839 NABIF9 1087-0156 Google Scholar
R. A. Krugeret al.,
“Photoacoustic ultrasound reconstruction tomography,”
Med. Phys., 22
(10), 1605
–1609
(1995). http://dx.doi.org/10.1118/1.597429 MPHYA6 0094-2405 Google Scholar
L. V. Wang,
“Prospects of photoacoustic tomography,”
Med. Phys., 35
(12), 5758
–5767
(2008). http://dx.doi.org/10.1118/1.3013698 MPHYA6 0094-2405 Google Scholar
G. Honget al.,
“Multifunctional in vivo vascular imaging using near-infrared II fluorescence,”
Nat. Med., 18
(12), 1841
–1846
(2012). http://dx.doi.org/10.1038/nm.2995 1078-8956 Google Scholar
M. Pramaniket al.,
“In vivo carbon nanotube-enhanced non-invasive photoacoustic mapping of the sentinel lymph node,”
Phys. Med. Biol., 54
(11), 3291
–3301
(2009). http://dx.doi.org/10.1088/0031-9155/54/11/001 PHMBA7 0031-9155 Google Scholar
J. R. Rajianet al.,
“Drug delivery monitoring by photoacoustic tomography with an ICG encapsulated double emulsion,”
Opt Express., 19
(15), 14335
–14347
(2011). http://dx.doi.org/10.1364/OE.19.014335 OPEXFF 1094-4087 Google Scholar
C. Wanget al.,
“Protamine functionalized single-walled carbon nanotubes for stem cell labeling and in vivo Raman/magnetic resonance/photoacoustic triple-modal imaging,”
Adv. Funct. Mater., 22
(11), 2363
–2375
(2012). http://dx.doi.org/10.1002/adfm.v22.11 AFMDC6 1616-3028 Google Scholar
A. de la Zerdaet al.,
“Ultrahigh sensitivity carbon nanotube agents for photoacoustic molecular imaging in living mice,”
Nano Lett., 10
(6), 2168
–2172
(2010). http://dx.doi.org/10.1021/nl100890d NALEFD 1530-6984 Google Scholar
C. Pavliket al.,
“Synthesis and fluorescent characteristics of imidazole-indocyanine green conjugates,”
Dyes Pigm., 89
(1), 9
–15
(2011). http://dx.doi.org/10.1016/j.dyepig.2010.08.008 DYPIDX 0143-7208 Google Scholar
U. Alqasemiet al.,
“FPGA-based reconfigurable processor for ultrafast interlaced ultrasound and photoacoustic imaging,”
IEEE Trans. Ultrason. Ferroelectr. Freq. Control, 59
(7), 1344
–1353
(2012). http://dx.doi.org/10.1109/TUFFC.2012.2335 ITUCER 0885-3010 Google Scholar
A. Osorioet al.,
“H2SO4/HNO3/HCl-functionalization and its effect on dispersion of carbon nanotubes in aqueous media,”
Appl. Surf. Sci., 255
(5), 2485
–2489
(2008). http://dx.doi.org/10.1016/j.apsusc.2008.07.144 ASUSEE 0169-4332 Google Scholar
G. R. Cherricket al.,
“Indocyanine green: observations on its physical properties, plasma decay, and hepatic extraction,”
J. Clin. Invest., 39
(4), 592
–600
(1960). http://dx.doi.org/10.1172/JCI104072 JCINAO 0021-9738 Google Scholar
R. A. Mucci,
“A comparison of efficient beamforming algorithms,”
IEEE Trans. Acoust. Speech Signal Process, 32
(3), 548
–558
(1984). http://dx.doi.org/10.1109/TASSP.1984.1164359 0096-3518 Google Scholar
C. G. A. HoelenF. F. M. de Mul,
“Image reconstruction for photoacoustic scanning of tissue structures,”
Appl. Opt., 39
(31), 5872
–5883
(2000). http://dx.doi.org/10.1364/AO.39.005872 APOPAI 0003-6935 Google Scholar
M. XuL. H. Wang,
“Photoacoustic imaging in biomedicine,”
Rev. Sci. Instrum., 77
(4), 041
–101
(2006). http://dx.doi.org/10.1063/1.2195024 RSINAK 0034-6748 Google Scholar
S. Chouet al.,
“Ultrasonographic evaluation of endometrial changes using computer assisted image analysis,”
J. Obstet. Gynaecol. Res., 36
(3), 634
–638
(2010). http://dx.doi.org/10.1111/j.1447-0756.2010.01218.x JOGRFD 1447-0756 Google Scholar
J. M. BrownA. J. Giaccia,
“The unique physiology of solid tumors: opportunities (and problems) for cancer therapy,”
Cancer Res., 58
(7), 1408
–1416
(1998). CNREA8 0008-5472 Google Scholar
J. BrownW. Wilson,
“Exploiting tumour hypoxia in cancer treatment,”
Nat. Rev. Cancer., 4
(6), 437
–447
(2004). http://dx.doi.org/10.1038/nrc1367 NRCAC4 1474-175X Google Scholar
H. Cabralet al.,
“Accumulation of sub-100 nm polymeric micelles in poorly permeable tumours depends on size,”
Nat. Nanotechnol., 6
(12), 815
–823
(2011). http://dx.doi.org/10.1038/nnano.2011.166 1748-3387 Google Scholar
V. Chauhanet al.,
“Fluorescent nanorods and nanospheres for real-time in vivo probing of nanoparticle shape-dependent tumor penetration,”
Angew Chem Int Ed Engl., 50
(48), 11417
–11420
(2011). http://dx.doi.org/10.1002/anie.v50.48 ACIEAY 0570-0833 Google Scholar
B. Kimet al.,
“Tuning payload delivery in tumour cylindroids using gold nanoparticles,”
Nat. Nanotechnol., 5
(6), 465
–472
(2010). http://dx.doi.org/10.1038/nnano.2010.58 1748-3387 Google Scholar
H. Maedaet al.,
“Tumor vascular permeability and the EPR effect in macromolecular therapeutics,”
J. Control Release, 65
(1–2), 271
–284
(2000). http://dx.doi.org/10.1016/S0168-3659(99)00248-5 JCREEC 0168-3659 Google Scholar
T. T. GoodmanP. L. OliveS. H. Pun,
“Increased nanoparticle penetration in collagenase-treated multicellular spheroids,”
Int. J. Nanomed., 2
(2), 265
–274
(2007). IJNNHQ 1178-2013 Google Scholar
S. Huoet al.,
“Superior penetration and retention behavior of 50 nm gold nanoparticles in tumors,”
Cancer Res., 73
(1), 319
–330
(2013). http://dx.doi.org/10.1158/0008-5472.CAN-12-2071 CNREA8 0008-5472 Google Scholar
J. Ruiterkampet al.,
“Impact of breast surgery on survival in patients with distant metastases at initial presentation: a systematic review of the literature,”
Breast Cancer Res. Treat., 120
(1), 9
–16
(2010). http://dx.doi.org/10.1007/s10549-009-0670-0 BCTRD6 0167-6806 Google Scholar
K. YangZ. Liu,
“In vivo biodistribution, pharmacokinetics, and toxicology of carbon nanotubes,”
Curr. Drug Metab., 13
(8), 1057
–1067
(2012). http://dx.doi.org/10.2174/138920012802850029 CDMUBU 1389-2002 Google Scholar
J. P. Ryman-Rasmussenet al.,
“Inhaled carbon nanotubes reach the subpleural tissue in mice,”
Nat. Nanotechnol., 4
(11), 747
–751
(2009). http://dx.doi.org/10.1038/nnano.2009.305 1748-3387 Google Scholar
D. Elgrabliet al.,
“Biodistribution and clearance of instilled carbon nanotubes in rat lung,”
Part. Fibre Toxicol., 5 20
(2008). http://dx.doi.org/10.1186/1743-8977-5-20 PFTABQ 1743-8977 Google Scholar
P. G. CoinV. L. RoggliA. R. Brody,
“Persistence of long thin chrysotile asbestos fibers in the lungs of rats,”
Environ. Health Perspect., 102
(5), 197
–199
(1994). EVHPAZ 0091-6765 Google Scholar
L. Lacerdaet al.,
“Carbon-nanotube shape and individualization critical for renal excretion,”
Small, 4
(8), 1130
–1132
(2008). http://dx.doi.org/10.1002/smll.v4:8 1613-6829 Google Scholar
R. Singhet al.,
“Tissue biodistribution and blood clearance rates of intravenously administered carbon nanotube radiotracers,”
Proc. Natl. Acad. Sci. U S A, 103
(9), 3357
–3362
(2006). http://dx.doi.org/10.1073/pnas.0509009103 PNASA6 0027-8424 Google Scholar
S. M. Frühet al.,
“Covalent cargo loading to molecular shuttles via copper-free click chemistry,”
Biomacromolecules, 13
(12), 3908
–3911
(2012). http://dx.doi.org/10.1021/bm301437c BOMAF6 1525-7797 Google Scholar
N. Allaliet al.,
“Covalent functionalization of few-wall carbon nanotubes by ferrocene derivatives for bioelectrochemical devices,”
Phys. Status Solidi B, 249
(12), 349
–2352
(2012). http://dx.doi.org/10.1002/pssb.201200098 PSSBBD 0370-1972 Google Scholar
|