
|
|
1.IntroductionSpatial frequency domain imaging (SFDI) is a reflectance-based technique that can measure and map absorption () and scattering () coefficients in tissue on a pixel-by-pixel basis. SFDI works by structuring light into sinusoidal patterns and projecting them onto the tissue surface. The tissue acts as a spatial filter and blurs the structured patterns. By projecting patterns of differing spatial frequencies, the modulation transfer function of the tissue can be found from which a unique pair of optical absorption and scattering coefficients is determined. Further filtering of the remitted light with either a series of bandpass filters or with a liquid-crystal tunable filter allows unique spectra of and to be found in different tissue types.1,2 Recent applications of SFDI to skin imaging include in vivo monitoring of burn wounds,3,4 determining flap perfusion during surgical procedures,5,6 and assessing cutaneous vascular abnormalities.7 SFDI has also been used for characterizing brain in small animal models of stroke,8 glioblastoma,9 and Alzheimer’s disease.10 In each example, multispectral maps of tissue scattering are separately constructed from tissue absorption. This allows formation of chromophore images such as oxy-hemoglobin (), deoxy-hemoglobin (Hb), lipid, and water using the Beer–Lambert law. The inverse relationship between spatial frequency and average photon pathlength11 also facilitates SFDI depth sectioning and tomography of absorbing and fluorescent inhomogeneities.12–14 In this work, we present a low cost, three-wavelength SFDI system that operates in the visible spectral regime using three light-emitting diodes (LEDs) (460, 530, and 632 nm). The cost savings of a consumer electronics-based SFDI system can be appreciated by comparing the price of a commercial LED microprojector (e.g., for an AAXA M2 microprojector) with that of a scientific-grade digital light projector (e.g., for a Texas Instrument DLP Discovery 4100 Kit). We sought to quantify this consumer-grade SFDI system’s performance in the more challenging visible regime where and small amounts of noise in measured light levels can introduce large inaccuracies in separating absorption from scattering.2 SFDI instrumentation is described and validated in tissue-simulating Intralipid phantoms, and optical property maps of a mouse brain are measured in order to demonstrate overall sensitivity and performance. In addition, we examine the impact of saline windows commonly used in rodent model neuroimaging in order to assess how this preparation may influence tissue absorption and scattering values. Implementation of our system offers great potential for measuring optical properties of superficial tissues such as skin epidermis and rodent brain cortex. 2.Methods2.1.Flexible LED and Modulation Element (FLaME) InstrumentationWe modified a LED-based microprojector (M2, AAXA Technologies, Inc., Tustin, California) to project a field of view of by extending the focusing tube lens slightly beyond the manufactured limit. All other settings and components of the projector were used as received, including the three individual blue, green, and red LEDs centered at 460, 523, and 625 nm, respectively [Fig. 1(b)]. These wavelengths are sufficient for differentiating oxy- and deoxy-hemoglobin concentration: 523 nm is near an isosbestic point for oxy- and deoxy-hemoglobin, oxy-hemoglobin is about twice as absorbing as deoxy-hemoglobin at 460 nm, and deoxy-hemoglobin is about four times as absorbing as oxy-hemoglobin at 625 nm [Fig. 3(a)]. The projector was used as a second monitor and images were created in Matlab (Mathworks) and displayed as figures in the second monitor. The refresh rate of the liquid crystal on silicon chip in the AAXA projector was 70 Hz or about . Thus, we used multiples of 14.286 ms as the exposure time to achieve consistent light levels. Fig. 1(a) Diagram of FLaME experimental imaging setup. All components were controlled using LabVIEW software on a personal computer. (b) Expanded view of the AAXA M2 microprojector.  As shown in the block diagram in Fig. 1(a), multispectral reflectance images were separated spectrally with dichroic mirrors (475DCLP, 560DCLP, Omega Optical, Inc., Brattleboro, Vermont) and bandpass filters (FB460-10, FB530-10, FL632.8-10, Thorlabs, Inc., Newton, New Jersey). Filtered images were detected using three 12-bit charge-coupled device cameras (Flea2G, Point Grey, Richmond, BC, Canada). Images from the three cameras were co-registered with one another using a fiducial marker (reflective sticker, 1-mm diameter) on a solid tissue-simulating phantom.15 A crossed linear polarizer (Edmund Optics, Barrington, New Jersey) was also placed before the cameras to reduce the effect of specular reflectance from the sample. The input–output curve (gamma function) of the projector was determined empirically by sequentially projecting 256 grayscale level images on spectralon (Labsphere) and recording the average pixel intensity from the camera, normalized to the brightest projection (Fig. 2). We found that the nonlinear gamma function of the projector distorts a sine wave image input from the computer to appear as a square wave. We adjusted the computer image input levels, based on the gamma function, such that the actual projected image was sinusoidal when detected (Fig. 2). The projector and cameras were connected to a personal computer and controlled by custom LabVIEW software (National Instruments, Austin, Texas). Fig. 2The nonlinear input–output intensity curve (gamma function) of the projector (middle) distorts a sine wave image input from the computer (top left) to appear as a square wave (top right). Using the projector response function as a look-up-table, the computer image input was adjusted such that the actual projected image (bottom left) is sinusoidal when detected on spectralon (Labsphere) (bottom right). Cross-section intensity profiles of the images are shown in red under the images to better illustrate the projection transformation.  2.2.SFDI in the VisibleOptical properties were calculated using a multifrequency fitting approach described previously.1 We sequentially projected five spatial frequencies (0, 0.05, 0.1, 0.2, and ) with each sinusoidal frequency pattern projected three times at phases of 0, 120, and 240 deg. The remitted reflectance was captured by the three cameras simultaneously and saved for offline processing and analysis. Acquisition speed was limited by the camera exposure times for highly absorbing samples ( for 460 and 530 nm) and software synchronization of the projector display with camera frame grab (this added grab). Total acquisition time for 10 repetitions of five spatial frequencies at three phases (150 images) was approximately 3 min or . More rapid tissue imaging could be achieved by improving light collection optics and camera sensitivity as well as using dedicated acquisition and control software. Reflectance at each spatial frequency and wavelength was calculated using where is the demodulated frequency amplitude image and , , and are the three captured images at the three different phases by each camera. images were further calibrated to silicone phantoms of known optical properties to correct for any system error such as light inhomogeneity or lens aberration. The optical properties of the reference phantoms were acquired using spatially modulated quantitative spectroscopy.16 The frequency-dependent diffuse reflectance () was then fit to a Monte Carlo model of light transport,2 and absorption () and reduced scattering () coefficients were calculated on a pixel-by-pixel basis. All analyses were done in Matlab (MathWorks, Natick, Massachusetts).2.3.Phantom ValidationsHemoglobin is approximately an order of magnitude more absorbing in the blue–green wavelengths (e.g., 460 and 530 nm) versus 632 nm and above17 [Fig. 3(a)]. While SFDI has been validated in the near-infrared (NIR)2 where , we needed to establish that FLaME could be used to separate absorption from scattering when . To determine the relevant range of values, we used the Beer–Lambert law to predict at the three wavelengths when total hemoglobin (THb) ranged from 50 to 150 μM with 60% oxygen saturation ( to ). Our previous work in mice showed a THb around 150 μM10 while others have used concentrations of around 100 μM.18 Then, keeping constant at , we used a scaled Monte Carlo model2 to predict reflectance as a function of spatial frequency when we varied from 0.01 to [Fig. 3(b)] and from 0.1 to [Fig. 3(c)]. The reflectance changes much more with respect to spatial frequency () in the lowest absorbing sample () versus the highest absorbing sample (), showing low signal-to-noise may be a source of error when inverting the model and fitting for and at high values of . Fig. 3(a) Absorption spectra of oxy-hemoglobin () and deoxy-hemoglobin (Hb). Vertical lines highlight 460, 530, and 632 nm absorption features. (b) Scaled Monte Carlo predictions of diffuse reflectance as a function of spatial frequency with constant at and increasing by increments of from 0.01 to . (c) Scaled Monte Carlo predictions of diffuse reflectance as a function of spatial frequency with constant at and increasing by increments of from 0.1 to .  To validate the performance of the system, we conducted a series of controlled experiments in tissue-simulating phantoms. First, 19 mL solutions of 0.25, 0.5, and napthol green B solution (Sigma, St. Louis, Missouri) were made in double-distilled water and measured in transmission mode with a VIS–NIR spectrophotometer (UV-3600, Shimadzu, Inc., Kyoto, Japan) from 450 to 1000 nm. Similarly, a sample of fresh pig blood was acquired (protocol No. 2007-2743), stored in a vial with heparin anticoagulant, and diluted to a ratio in phosphate-buffered saline before being measured in the spectrophotometer. The absorption spectra were calculated by taking the negative logarithm of the percent transmission and dividing by the pathlength traveled (10 mm for the dye solutions, 5 mm for the pig blood solution). After measurement with the spectrophotometer, 1 mL of 20% Intralipid (Fresenius Kabi, Bad Homburg, Germany) was then added to 19 mL of the solutions to mimic scattering in tissue19 and each solution was measured with the FLaME system. 2.4.In Vivo Mouse BrainWe imaged a 3-month-old C57BL/6 mouse under 1.2% isoflurane anesthesia in a 21% oxygen/79% nitrogen air mix (Oxydial, Starr Life Sciences Corp., Oakmont, Pennsylvania). After inducing anesthesia (2% isoflurane), the head was secured in a stereotaxic frame (Stoelting Co., Wood Dale, Illinois) and body temperature was maintained at 37°C with a thermocouple-controlled heating pad (Cwe, Inc., Ardmore, Pennsylvania). We removed the skin and fascia above the scalp and a well was created with petroleum jelly around the regions of interest (ROI), filled with sterile saline, and covered with a glass coverslip to maintain optical transparency of the skull. A similar well was created on the calibration phantom during FLaME measurements. For determining the effect of the saline well, we prepared a 2-month old senescence-accelerated mouse-prone 8 transgenic mouse as above, but imaged it both with and without the saline well. All procedures were performed in accordance with the regulations of the Institutional Animal Care and Use Committee (IACUC) of the University of California, Irvine (protocol 2010-2934). 3.Data AnalysisIn post-processing, the 10 repetitions of raw images acquired were averaged before being demodulated, calibrated, and fitted for and . Values for , , and hemoglobin were calculated for each pixel in the image. THb was calculated as the sum of oxy-hemoglobin () and deoxy-hemoglobin (Hb). Oxygen saturation ( sat) was calculated as . ROI were selected and an average value with standard deviation was calculated for each ROI. For phantom comparisons with the spectrophotometer, FLaME-derived was multiplied by 1.05 to account for dilution with 1 mL Intralipid in 19 mL solution. All analyses were done in matlab. 4.Results and DiscussionThe strategy to use multiple spatial frequencies in fitting for and was integral in minimizing fitting error, as the impact of uncertainties in diffuse reflectance measurements at one spatial frequency is reduced and data fits are better constrained by multifrequency content [Fig. 4(a)]. The fitted absorption coefficients in the napthol green B titrations were on average different from spectrophotometer ’s, or off [Fig. 4(b)]. If the data are plotted as FLaME versus spectrophotometer [Fig. 4(d)], it is more apparent at that the FLaME fit is an outlier. Without this highest point, the FLaME ’s were on average different from spectrophotometer ’s, or off. While there is a natural variation in Intralipid batches,20 we show in Fig. 4(c) that FLaME-fitted scattering values are within the range of the Mie theory-predicted scattering for 1% Intralipid,21 with a mean error of . Fig. 4(a) Example plot of at 0, 0.05, 0.1, 0.2, and spatial frequencies for three concentrations of napthol green B at 460 nm. Lines are the least-squares fits of the Monte Carlo forward model of as a function of and . Standard deviation bars of the data and are not shown for clarity. (b) Plot of spectra of three concentrations of napthol green B. Lines are from the spectrophotometer and points are from FLaME measurements. Standard deviation bars of the FLaME data and are not shown for clarity. (c) Plot of spectra of three concentrations of napthol green B in 1% Intralipid solution. Line is the expected scattering of 1% Intralipid from Mie theory. Standard deviation bars of the FLaME data and are not shown for clarity. (d) Plot of data from (b) showing an outlier in FLaME data when the expected .  Interestingly, the offset in the FLaME-fitted ’s compared to the spectrophotometer artificially causes a higher percentage of error at the lower ’s () compared to the higher ’s (). Better calibration of the silicone reference phantom at visible wavelengths is needed to correct for this offset. In Fig. 5, we see FLaME values within 7% of spectrophotometer values for 460 and 530 nm, but the much lower absorption of blood at 632 nm results in a 78% error ( versus ). Absorption measurements at the three wavelengths were fit to hemoglobin concentrations using the Beer–Lambert law and compared to hemoglobin fits from the spectrophotometer (Table 1). For the spectrophotometer measurement, scattering of the red blood cells was modeled to follow a wavelength-dependent power law, ,22 where is the scattering amplitude and is the scattering power. Previously, Mourant et al. showed microspheres with diameters of 0.1 to 2 μm in solution have value magnitudes ranging from 4 to 0.37, respectively.22 The diameter of red blood cells in pig blood is 6 μm,23 so we assumed to be 0.37 and scattering amplitude, , was fit for as the third chromophore in the Beer–Lambert law and found to be . FLaME comparisons with the spectrophotometer hemoglobin fits were within 3% for , 20% for Hb, 4% for Total Hb, and saturation was 96.7% (spectrophotometer) versus 96.2% (FLaME) (Table 1). The fitted values from FLaME (Table 2) were slightly higher than the napthol green B measurements, probably from the additional scattering from the red blood cells. Fig. 5Blood phantom spectra acquired using a conventional transmission spectrophotometer (thick green line), FLaME (red dots), and the best fit of the spectrophotometer data to hemoglobin (dashed black line). Standard deviations for FLaME data are , , and . They are not shown for clarity.  Table 1Table of oxy-hemoglobin (HbO2) and deoxy-hemoglobin (Hb) fits determined from the spectrophotometer spectrum (450 to 1000 nm) and from the FLaME absorption data at 460, 530, and 632 nm.
Table 2Absorption and reduced scattering coefficients acquired from FLaME imaging of the blood/Intralipid phantom are shown with standard deviation of the 150,880 pixels in the regions of interest.
A potential application of the FLaME system is to characterize rodent brain absorption and scattering properties in disease models, assess physiologic changes, and monitor therapeutic interventions. We show below in Fig. 6, the mouse brain with skull intact being imaged with 530 nm light. As expected, vessels are clearly seen in the raw and diffuse reflectance images from THb absorption as well as in the and maps. Fig. 6A summary of the SFDI process in a mouse brain at 530 nm: (Top row) Raw camera snapshots of mouse brain with projected spatial frequencies. (Middle row) Cropped and calibrated diffuse reflectance images of the mouse brain as a function of spatial frequency. (Bottom row) Pixel-by-pixel fitted and maps of the mouse brain at 530 nm. The midsagittal vein, a prominent vessel on the midline surface of the brain, can be seen on the map. The sagittal skull suture is marked by increased scattering on the map. 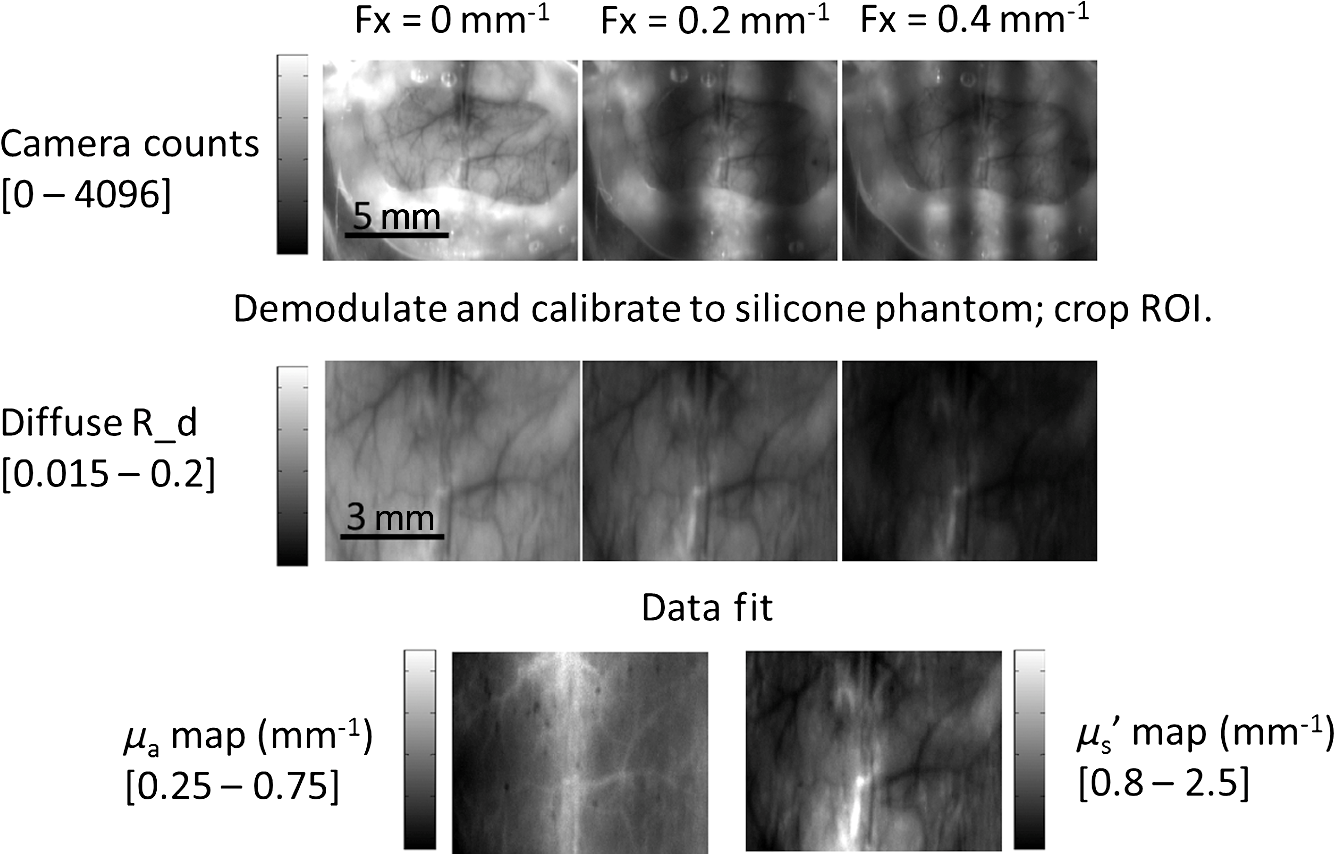 While we used saline to reduce specular reflections from a dry skull, it is unknown how this might affect the detected optical properties. In Fig. 7, we show the FLaME system is sensitive to a reduction in when saline is added to the skull [Fig. 7(f)]. As expected, the scatter-corrected absorption [Fig. 7(e)] and hemoglobin concentrations (Table 3) do not differ significantly. Visible wavelengths only penetrate 250 to 500 μm into tissue,24 and optical properties of overlying rodent skull can significantly contribute to optical properties measured by SFDI. The ability to measure intrinsic tissue scattering and the impact of saline well or similar preparations can improve measurement accuracy and allow more quantitative comparisons between different subjects. Fig. 7Adding a saline well over the skull, as commonly done in optical intrinsic signal imaging causes a significant () decrease in the detected scattering when compared to imaging a dry skull. (a and b) Images of the dry and saline-soaked regions of interest (ROI). Plots of diffuse reflectance as a function of spatial frequency for the dry skull (c) and the wet skull (d). (e) A comparison of fitted values for a dry skull (squares) versus a wet skull (circles). (f) A comparison of fitted values for a dry skull (squares) versus a wet skull (circles). All error bars are standard deviation of the ROI pixels. 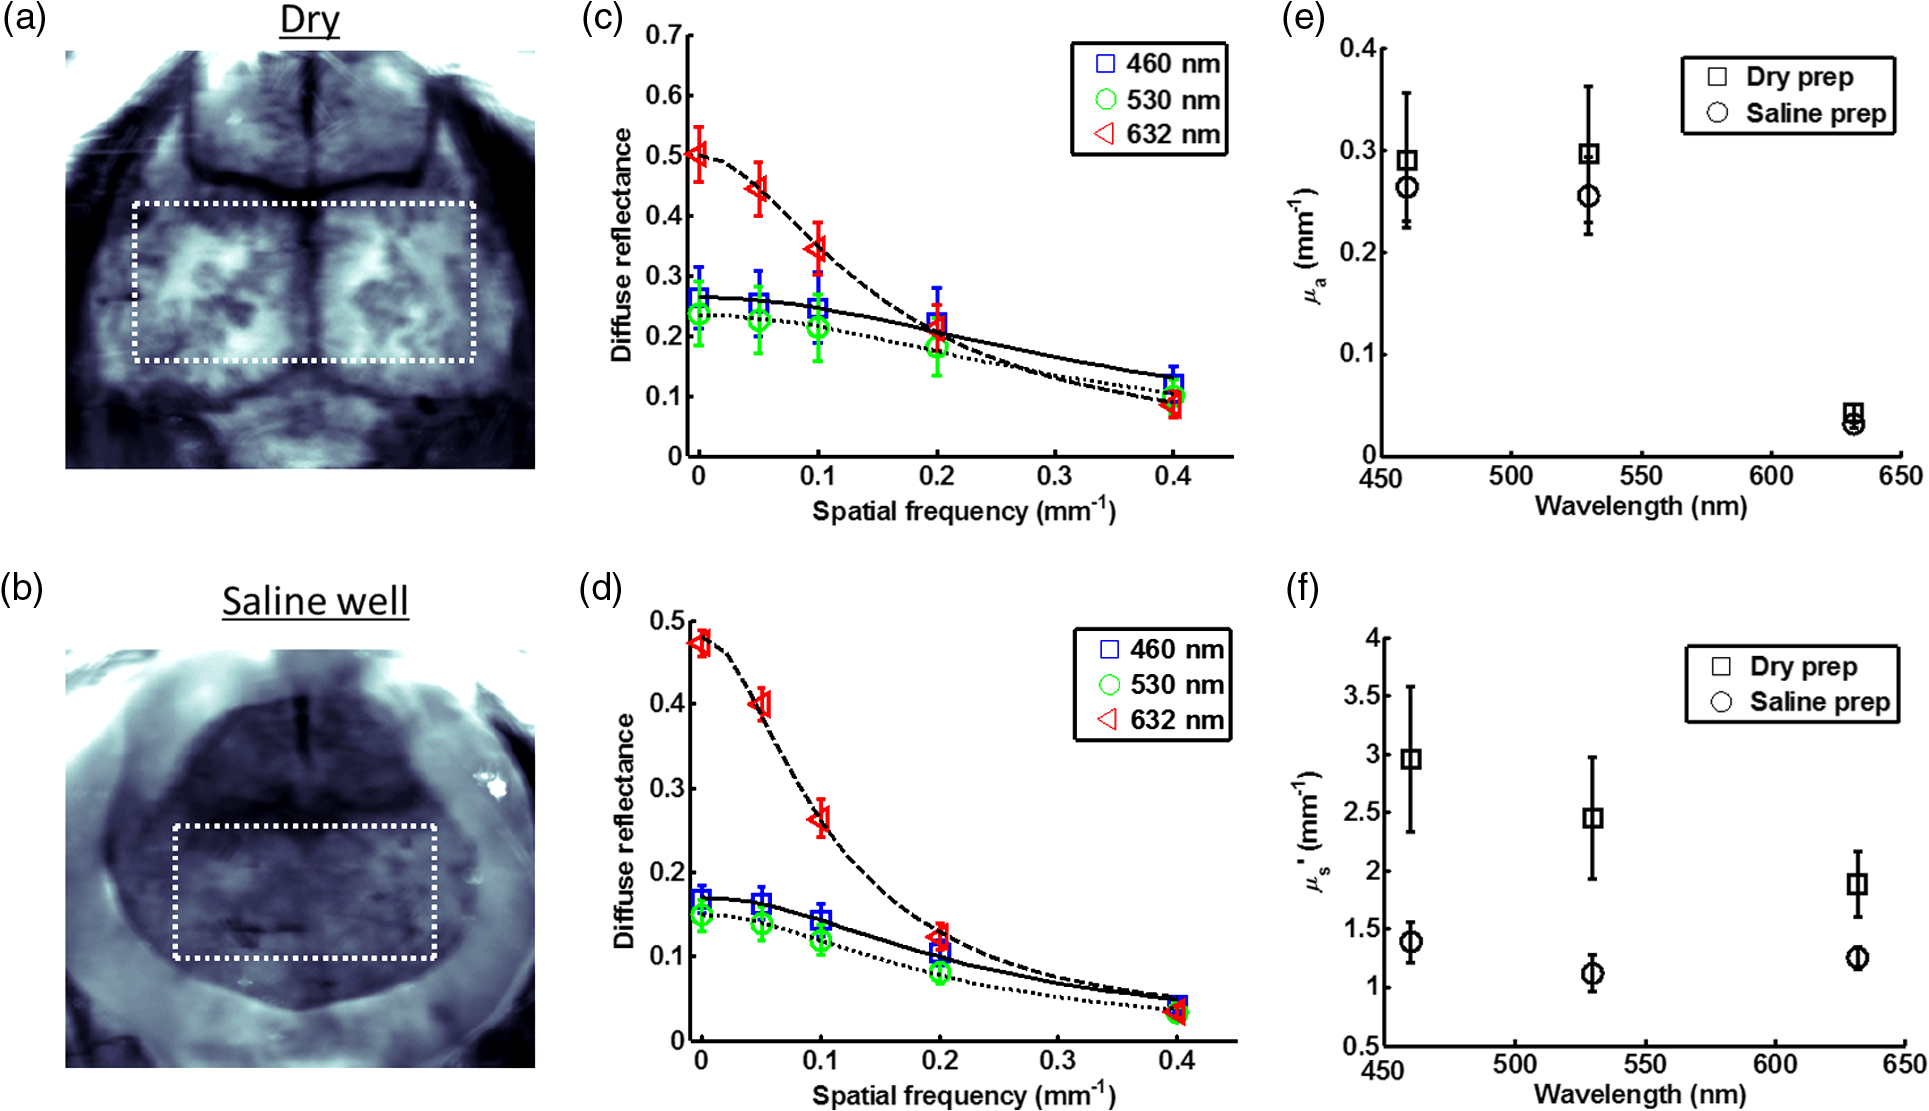 Table 3Fitted hemoglobin concentrations and oxygen saturation for FLaME imaging of a brain with an overlying dry skull versus saline-soaked skull.
5.ConclusionWe have described a low-cost multispectral imaging platform that uses a commercially available LED-based digital light projector and a scaled Monte Carlo light propagation model to acquire tissue absorption and reduced scattering properties in visible (blue, green, and red) spectral regions using SFDI. No modifications to the microprojector hardware is required, however, computer-synthesized projection patterns must be corrected for nonuniformities in projector output using a calibration procedure. The accuracy of the FLaME system was 11% and 3%, respectively, for determining and in tissue-simulating liquid phantoms over a -fold range of realistic tissue absorption values. FLaME measurements of oxy-, deoxy-hemoglobin, and THb were within 3% to 20% of true values as determined by a spectrophotometer. Optical absorption and scattering maps of a mouse brain were measured in vivo with visible light for the first time, showing this easily accessible platform may have applications in multispectral neuroimaging and similar settings that require quantitative assessment of tissue hemodynamics and composition. AcknowledgmentsFunding for this work was supported by the NIH (NIBIB) Laser Microbeam and Medical Program (P41EB015890), NIH (NIA) Grant (R01 A6-21982), NIH (NIA) Ruth Kirschstein NRSA fellowship (5F30AG039949-02), NIH (NIBIB) Grant (R21 EB014440), NIH (NINDS) Grant (R21 NS078634), UC Irvine MSTP, and the Arnold and Mabel Beckman Foundation. The authors would also like to thank Kendrew Au, M.S., for his help in calibrating reference phantoms. ReferencesD. J. Cucciaet al.,
“Modulated imaging: quantitative analysis and tomography of turbid media in the spatial-frequency domain,”
Opt. Lett., 30
(11), 1354
–1356
(2005). http://dx.doi.org/10.1364/OL.30.001354 OPLEDP 0146-9592 Google Scholar
D. J. Cucciaet al.,
“Quantitation and mapping of tissue optical properties using modulated imaging,”
J. Biomed. Opt., 14
(2), 024012
(2009). http://dx.doi.org/10.1117/1.3088140 JBOPFO 1083-3668 Google Scholar
M. Kaiseret al.,
“Noninvasive assessment of burn wound severity using optical technology: a review of current and future modalities,”
Burns, 37
(3), 377
–386
(2011). http://dx.doi.org/10.1016/j.burns.2010.11.012 BURND8 0305-4179 Google Scholar
T. T. Nguyenet al.,
“Novel application of a spatial frequency domain imaging system to determine signature spectral differences between infected and noninfected burn wounds,”
J. Burn Care Res., 34
(1), 4450
(2013). http://dx.doi.org/10.1097/BCR.0b013e318269be30 1559-047X Google Scholar
A. Yafiet al.,
“Postoperative quantitative assessment of reconstructive tissue status in a cutaneous flap model using spatial frequency domain imaging,”
Plast. Reconstr. Surg., 127
(1), 117
–130
(2011). http://dx.doi.org/10.1097/PRS.0b013e3181f959cc PRSUAS 0032-1052 Google Scholar
S. Giouxet al.,
“First-in-human pilot study of a spatial frequency domain oxygenation imaging system,”
J. Biomed. Opt., 16
(8), 086015
(2011). http://dx.doi.org/10.1117/1.3614566 JBOPFO 1083-3668 Google Scholar
A. Mazharet al.,
“Spatial frequency domain imaging of port wine stain biochemical composition in response to laser therapy: a pilot study,”
Lasers Surg. Med., 44
(8), 611
–621
(2012). http://dx.doi.org/10.1002/lsm.22067 LSMEDI 0196-8092 Google Scholar
D. Abookasiset al.,
“Imaging cortical absorption, scattering, and hemodynamic response during ischemic stroke using spatially modulated near-infrared illumination,”
J. Biomed. Opt., 14
(2), 024033
(2009). http://dx.doi.org/10.1117/1.3116709 JBOPFO 1083-3668 Google Scholar
S. D. Koneckyet al.,
“Spatial frequency domain tomography of protoporphyrin IX fluorescence in preclinical glioma models,”
J. Biomed. Opt., 17
(5), 056008
(2012). http://dx.doi.org/10.1117/1.JBO.17.5.056008 JBOPFO 1083-3668 Google Scholar
A. J. Linet al.,
“Spatial frequency domain imaging of intrinsic optical property contrast in a mouse model of Alzheimer’s disease,”
Ann. Biomed. Eng., 39
(4), 1349
–1357
(2011). http://dx.doi.org/10.1007/s10439-011-0269-6 ABMECF 0090-6964 Google Scholar
T. D. O’Sullivanet al.,
“Diffuse optical imaging using spatially and temporally modulated light,”
J. Biomed. Opt., 17
(7), 071311
(2012). http://dx.doi.org/10.1117/1.JBO.17.7.071311 JBOPFO 1083-3668 Google Scholar
S. D. Koneckyet al.,
“Quantitative optical tomography of sub-surface heterogeneities using spatially modulated structured light,”
Opt. Express, 17
(17), 14780
–14790
(2009). http://dx.doi.org/10.1364/OE.17.014780 OPEXFF 1094-4087 Google Scholar
A. Mazharet al.,
“Structured illumination enhances resolution and contrast in thick tissue fluorescence imaging,”
J. Biomed. Opt., 15
(1), 010506
(2010). http://dx.doi.org/10.1117/1.3299321 JBOPFO 1083-3668 Google Scholar
C. D’Andreaet al.,
“Fast 3D optical reconstruction in turbid media using spatially modulated light,”
Biomed. Opt. Express, 1
(2), 471
–481
(2010). http://dx.doi.org/10.1364/BOE.1.000471 BOEICL 2156-7085 Google Scholar
J. Q. Nguyenet al.,
“Effects of motion on optical properties in the spatial frequency domain,”
J. Biomed. Opt., 16
(12), 126009
(2011). http://dx.doi.org/10.1117/1.3662454 JBOPFO 1083-3668 Google Scholar
R. B. SaagerD. J. CucciaA. J. Durkin,
“Determination of optical properties of turbid media spanning visible and near-infrared regimes via spatially modulated quantitative spectroscopy,”
J. Biomed. Opt., 15
(1), 017012
(2010). http://dx.doi.org/10.1117/1.3299322 JBOPFO 1083-3668 Google Scholar
W. G. ZijlstraA. BuursmaW. P. Meeuwsen-van der Roest,
“Absorption spectra of human fetal and adult oxyhemoglobin, de-oxyhemoglobin, carboxyhemoglobin, and methemoglobin,”
Clin. Chem., 37
(9), 1633
–1638
(1991). 0009-9147 Google Scholar
A. K. Dunnet al.,
“Spatial extent of oxygen metabolism and hemodynamic changes during functional activation of the rat somatosensory cortex,”
Neuroimage, 27
(2), 279
–290
(2005). http://dx.doi.org/10.1016/j.neuroimage.2005.04.024 NEIMEF 1053-8119 Google Scholar
H. J. van Staverenet al.,
“Light scattering in Intralipid-10% in the wavelength range of 400–1100 nm,”
Appl. Opt., 30
(31), 4507
–4514
(1991). http://dx.doi.org/10.1364/AO.30.004507 APOPAI 0003-6935 Google Scholar
S. T. Flocket al.,
“Optical properties of Intralipid: a phantom medium for light propagation studies,”
Lasers Surg. Med., 12
(5), 510
–519
(1992). http://dx.doi.org/10.1002/(ISSN)1096-9101 LSMEDI 0196-8092 Google Scholar
R. MichelsF. FoschumA. Kienle,
“Optical properties of fat emulsions,”
Opt. Express, 16
(8), 5907
–5925
(2008). http://dx.doi.org/10.1364/OE.16.005907 OPEXFF 1094-4087 Google Scholar
J. R. Mourantet al.,
“Predictions and measurements of scattering and absorption over broad wavelength ranges in tissue phantoms,”
Appl. Opt., 36
(4), 949
–957
(1997). http://dx.doi.org/10.1364/AO.36.000949 APOPAI 0003-6935 Google Scholar
D. J. WeissK. J. WardropO. W. Schalm, Schalm’s Veterinary Hematology,
(2010) Google Scholar
R.B. Saageret al.,
“Method for depth-resolved quantitation of optical properties in layered media using spatially modulated quantitative spectroscopy,”
J. Biomed. Opt., 16
(7), 077002
(2011). http://dx.doi.org/10.1117/1.3597621 JBOPFO 1083-3668 Google Scholar
|


