
|
|
1.IntroductionRaman microscopy is a powerful tool for biochemical observation and analysis that enables nonstaining, noninvasive imaging with high selectivity of specific chemical structures and properties by directly detecting their molecular vibrations.1,2 Some biological studies demand observation times on the order of several seconds to minutes, such as observation of lipid droplet dynamics (e.g., exchange and transfer of lipid droplet contents),3,4 fatty acid uptake into lipid droplets for energy storage,5 and fatty acid oxidation for providing bioenergy in muscle and heart tissue.6,7 However, biological processes may occur faster, and therefore, an imaging system capable of acquiring images at video rates or faster would be advantageous. Unfortunately, conventional spontaneous Raman microscopy requires long acquisition times due to the extremely small Raman scattering cross-section.8 Coherent Raman scattering (CRS) microscopy, particularly coherent anti-Stokes Raman scattering (CARS) and stimulated Raman scattering (SRS), offers a solution for more-reliable, label-free, fast imaging in biochemical and biomedical applications. CRS microscopy employs two laser sources with slightly different frequencies (, ). If the frequency difference between the two lasers coincides with a specific molecular vibration (), CRS images can be obtained due to new emission at (CARS)9–11 or energy transfer from to (SRS).12–14 Though CRS microscopy provides fast imaging with high spatial resolution, it is capable of detecting only a specific wavelength or Raman shift. A further challenge to enhance the potential of CRS microscopy for biological applications is to realize fast spectral imaging in order to instantly detect changes in a specific molecular structure and to simultaneously show multiple molecular structures. A tunable laser source is required for providing a Stokes beam for exciting various molecular vibrations so that specific vibrational signatures in Raman spectra can be obtained. Therefore, the tunable laser should have high spectral resolution yet wide-range tunability. To observe the dynamics of biochemical processes, the laser should also have a fast tuning ability while providing sufficient, stable power. Moreover, good synchronization between the pump and Stokes beams should be maintained during the wavelength tuning. A picosecond mode-locked laser has been used as a narrowband tunable laser source to achieve high spectral resolution.12,15–17 In biological applications, Raman spectra are usually observed in fingerprint and CH vibrational regions, typically around 1000 and , respectively.10,11,14 Further enhancement can be achieved by extending the observation range to the silent region at 1800 to where some Raman-tag molecules generate signals without any interference from biological specimens.18–20 The most common light sources for CRS microscopy are based on optical parametric oscillators (OPOs).13,21–27 OPOs have a sufficiently wide tunable range to cover the entire Raman spectral region. However, OPOs require at least several tens of seconds to cover such a wide tuning range.25 Taking advantage of maintenance-free and compact designs, recent CRS microscopy systems employ all-fiber lasers28 or a combination of a fiber laser and a picosecond mode-locked laser.29 Because of material nonlinearity, the length of the fiber should be taken into account, and this limits the spectral width and tunable range of the laser pulses.28 In this study, we developed a CARS microscopy system capable of fast acquisition and high-speed spectral scanning. The system employed a picosecond mode-locked laser equipped with an acousto-optic tunable filter (AOTF) inside the laser cavity to change the laser wavelength. We modified the laser to compensate for fluctuations in the repetition frequency of the output laser pulses by installing a moveable end mirror of the laser cavity attached on a piezoelectric actuator and a pair of controllable parallel plates on galvanometer motors. During synchronization, the AOTF laser was tunable from 800 to 940 nm with a typical pulse duration of 10 ps and a resynchronization duration of change.30 An average laser power was high enough for obtaining CARS images with multifocus scanning.30 For demonstration purposes, fast spectral images of lipid droplets in 3T3-L1 adipocytes were obtained every within a Raman spectral region around at . We also obtained fast-switching CARS images of a mixture of deuterated and nondeuterated stearic acid at . For that purpose, we rapidly switched the wavelength of the AOTF laser between 844 and 900 nm, whereas another laser wavelength remained at 709 nm. Those wavelengths correspond to Raman shifts of ( stretching in deuterated stearic acid) and ( stretching in nondeuterated stearic acid). 2.Development of Fast Spectral Imaging System2.1.Picosecond Laser with High-Speed Wavelength Scanning SystemWe found that the development of an ideal tunable laser source for realization of fast spectral CRS microscopy still remains a challenge. We decided to construct a CARS system with two picosecond mode-locked Ti:sapphire lasers, one of which was a high-speed tunable laser (Mega Opto Co. Ltd., Saitama, Japan). The high-speed tunable laser was equipped with an AOTF inside its cavity for tuning the wavelength electrically.31 The AOTF was a piezoelectric device made from a birefringent crystal that alters the diffracted wavelength of incident light by applying suitable radio frequency waves without the need for any mechanical parts.32 Therefore, the laser could be rapidly tuned from 800 to 940 nm with a typical pulse duration of 10 ps within change. An average laser power was high enough for obtaining CARS images with multifocus scanning.15 Figure 1 shows a schematic diagram of the modified AOTF laser for synchronization with another picosecond mode-locked laser. A prism pair was provided to passively reduce the dispersion of the laser cavity. An end mirror attached on a piezoelectric actuator and a pair of parallel plates driven by galvanometer motors were provided to actively compensate for changes in the repetition frequency. Fig. 1Modified acousto-optic tunable filter (AOTF) laser with a moveable end mirror attached on a piezoelectric actuator and a pair of parallel plates on galvanometer motors.  The repetition frequency of a mode-locked laser depends on the cavity length. During the wavelength scanning of the AOTF laser from 800 to 940 nm, the repetition frequency varied greatly, by a value of 44 kHz. This mainly occurred due to the refractive index dispersion of the AOTF crystal, even though a prism pair (SF-10) was placed inside the laser cavity. The relationship between the repetition frequency, , and the laser cavity length, , is given by , where is the speed of light. A large change in the repetition frequency leads to difficulty in pulse synchronization; thus, compensation is required to maintain the repetition frequency. We attached the end mirror of the laser cavity on a piezoelectric actuator (Model 840.10, 15 μm, Physik Instrumente GmbH & Co.KG, Karlsruhe, Germany) to compensate for small changes in the repetition frequency and to synchronize both lasers. Unfortunately, its controllable range of 300 Hz was not enough for compensation of the 44-kHz repetition frequency change. To achieve larger compensation, we placed a pair of parallel plates (BK7, ) mounted on galvanometer motors (LSA-20B-30, Harmonic Drive Systems, Tokyo, Japan) inside the laser cavity. The parallel plates were rotated in opposite directions by the same angular increment, which was rapidly and precisely controlled by the galvanometer motors. This configuration allowed repetition frequency compensation of 65 kHz, which was sufficient for our purposes. 2.2.Synchronization System for Picosecond Mode-Locked LasersBoth laser pulses in CARS microscopy must spatio-temporally overlap. To achieve spatial overlapping, one can adjust the beam pathways in the optical setup. The degree of temporal overlapping is determined by timing jitter during synchronization of both laser pulses. Reduction of timing jitter is very important for improving the signal-to-noise ratio of the CARS image. We employed two types of timing-jitter detection systems to synchronize the lasers: an electronic phase detector for coarse control of synchronization and a balanced cross-correlator for fine control (Fig. 2).33,34 Fig. 2Synchronization system: timing jitter detection system, proportional-integral-differential (PID) and digital signal processor (DSP) for feedback control to galvanometer motors and piezoelectric actuator controllers in the AOTF laser.  The output from the electronic phase detector represented picosecond-order temporal differences between the two laser pulses.33 This signal was fed back to the galvanometer motors via a digital signal processor (DSP) controller (C6713DSK, Texas Instruments Inc., Texas) to rotate the pair of parallel plates to compensate for variations in the repetition frequency caused by wavelength scanning and to synchronize both the lasers. The electronic phase detector output depended on the time difference and amplitudes of the two input pulses. Therefore, we introduced an autogain amplifier (AD8368, Analog Devices Inc., Boston) after each photodetector (Fig. 3) to keep the amplitudes stable. The autogain amplifier generated a 224 mV rms electrical output signal for any photodetector signal with an amplitude rms. The output from the balanced cross-correlator obtained by optical detection was used for fine control of synchronization because it could detect the femtosecond-order temporal differences between the two laser pulses.34 Since the stability of the balanced cross-correlator output highly depended on the balance of cross-correlation signals detected by two-photon detectors, it was necessary to conserve equal separation of the pump and Stokes pulses to both detectors. As shown in Fig. 4, a polarizing beam splitter (PBS052, Thorlabs Inc., New Jersey) together with two achromatic half-wave plates (AHWP05M-980, Thorlabs Inc., New Jersey) enabled us to easily control and maintain the balance of the transmitted and reflected intensities of the incident pulses so that the balanced cross-correlator could minimize the timing jitter significantly. The output from the balanced cross-correlator was fed back to the piezoelectric actuator via an analog proportional-integral-differential (PID) controller (T-PID01Z, Turtle Industry Co. Ltd., Ibaraki, Japan) and to the galvanometer motors. 2.3.Fast Spectral CARS Imaging SystemWe developed a fast spectral CARS microscopy system by adopting a multifocus CARS configuration with a microlens array scanner and used the AOTF laser described above as one of the laser sources in the multifocus CARS imaging system (Fig. 5). Details of the multifocus microscopy system have been described in our previous article.35 The system covers the Raman spectral range from 400 to with a pump beam at 775 nm and from 1600 to with a pump beam at 709 nm. Fig. 5Fast spectral coherent anti-Stokes Raman scattering (CARS) imaging system with microlens array and high-speed tunable laser.  Personal computers (PC 1 and PC 2) were mainly used for controlling the AOTF laser operation and image acquisition, respectively. Before starting spectral imaging, the AOTF laser pulses and the picosecond mode-locked laser pulses should be synchronized. This synchronization was conducted by employing a phase-locked loop mechanism using the electronic phase detector and the balanced cross-correlator as parts of the pulse synchronization system. It was also necessary to store proper amplitude and frequency values of the RF wave in the AOTF driver for determining the wavelength change of the AOTF laser. During the wavelength scanning, PC 1 sent trigger pulses to the AOTF driver to start the wavelength changes. Wavelength changes were performed rapidly within 1 ms or less, and the pulse synchronization system attempted to recover the synchronization within 20 ms. Then, the DSP sent a trigger signal to an electron multiplying CCD (EM-CCD) camera (Ixon, Andor Technology Plc, Belfast, United Kingdom) for image acquisition, and the images were stored in PC 2. The total time required to complete imaging at every wavelength change should include both the image acquisition and the resynchronization process. The wavelength change, the resynchronization, and the image acquisition processes were repeated until the scanning process was completed. 3.Application of Fast Spectral CARS ImagingLipids play an important role in living cells for protein sorting and transport, construction of cellular compartments, storage of biofuels, and other biological functions.36,37 The observation of lipid metabolism in living cells is challenging since it still remains unclear due to the complex metabolic pathways involved as well as a wide diversity of structures and functions. Observation of lipids using Raman-based microscopy techniques can be easily performed since lipids contain abundant CH bonds, which have a strong Raman band at a specific region around . Thus, imaging of lipids in living cells with Raman-based microscopy can be achieved by detecting intracellular lipid accumulation in lipid droplets.38–40 3.1.Fast Spectral CARS Imaging of Lipid Droplets in 3T3-L1 Adipose CellsWe demonstrated the performance of our CARS microscopy system for imaging at rates faster than video rates (). We tuned the Raman vibration to for imaging lipid droplets in 3T3-L1 adipocytes and acquired CARS images at . The sample stage was moved during imaging. CARS images observed at some time points are shown in Fig. 6. Movie 1 presents a recording of a 100-fps imaging process, showing timestamps. Fig. 6(a)–(d) CARS images of lipid droplets in 3T3-L1 adipocytes from different locations taken at (Movie 1, QuickTime, 1.1 MB) [URL: http://dx.doi.org/10.1117/1.JBO.18.9.096009.1]. (). . The color scale in Movie 1 is the same as in Fig. 6.  Spectral CARS images of 3T3-L1 adipocytes were observed by scanning the wavelength of the AOTF laser every 0.5 nm from 875.0 to 905.0 nm, which corresponded to a Raman shift of 2663.21 to . For a 100-ms exposure time, the imaging process requires to cover the wavelength change, laser resynchronization after the wavelength change, and image acquisition. To produce final images, we removed the contributions of dark noise and the fundamental lights by subtraction. We also considered intensity fluctuations of the AOTF laser during wavelength scanning and took this into account by division. Figure 7 shows spectral CARS images of 3T3-L1 adipocytes at (a) , (b) , and (c) , which were assigned to off-resonant vibration, symmetric stretching vibration, and stretching vibration, respectively. Movie 2 presents a recording of spectral CARS images, showing the Raman shift. A CARS spectral profile in Fig. 7(d) was reconstructed by averaging the intensity in a -pixel area of interest in Movie 2 [indicated by white arrow in Figs. 7(a)–7(c)]. The reconstructed CARS spectral profile included both resonant and nonresonant contributions and it agrees with the results in previous reports.25,41,42 However, lipid abundantly contained CH bonds and they were highly accumulated in the lipid droplets. It led to the generation of large CARS signal that was relatively higher than the nonresonant background. Fig. 7Spectral CARS images of 3T3-L1 adipocytes at (a) , (b) , and (c) , assigned to nonresonant vibration, symmetric stretching vibration, and stretching vibration, respectively, taken with fast spectral CARS imaging system. . included the wavelength change, laser resynchronization after the wavelength change, and exposure time (Movie 2, QuickTime, 435 kB) [URL: http://dx.doi.org/10.1117/1.JBO.18.9.096009.2]. (d) CARS spectral profile reconstructed from area of interest (averaged over pixels) indicated by white arrow in (a)–(c). .  3.2.CARS Imaging by Fast-Switching Between CD and CH Stretching BandsIntracellular lipids can be easily detected using CARS microscopy because they contain abundant CH bonds, which have a strong Raman vibration around . Lipids cover a large group of biochemical structures with various functions and complex metabolism profiles. Therefore, it is important to distinguish lipid subspecies. One potential solution for distinguishing them is to use a deuterated lipid that consists of CD bonds instead of CH bonds on its carbon chain. A deuterated lipid has a Raman vibration that is significantly downshifted to the silent region around where no interference from biological specimens occurs.11,43–47 A stable, rapid switching process between two or more different wavelengths is needed for fast imaging to obtain the CARS images of different structures at various Raman shifts. We observed a sample of colocalized deuterated and nondeuterated stearic acids for a rapid switching experiment using our fast spectral CARS microscopy system. Each fatty acid was separately prepared as a stock solution of 40 mM in methanol. First, 5 μL of the deuterated stearic acid solution was dropped onto a glass-based dish (12 mm, AGC Techno Glass Co. Ltd., Shizuoka, Japan). The solvent easily evaporated in the room temperature and the deuterated stearic acid crystals were formed. Then, 5 μL of the nondeuterated stearic acid solution was added. With such small amount of solution, the solvent of the added solution was inadequate to dissolve the deuterated stearic acid crystals because it quickly evaporated. Therefore, we were able to obtain the colocalized deuterated and nondeuterated stearic acids crystals. This sample enabled us to detect sufficiently high Raman signals of stretching and stretching at 2850 and , respectively [Figs. 8(a) and 8(b)]. For that purpose, the AOTF laser was rapidly switched between 833 and 888 nm, and CARS images were acquired within . The merged CARS image indicated the locations where the deuterated and nondeuterated stearic acids were independently and colocatedly recrystallized [Fig. 8(c)]. Hence, the CD bond serves as a powerful chemical tag in CARS microscopy. For instance, in the detection of lipid uptake metabolism by cells, the exogenous lipid can be prepared using its deuterated isotope. The exogenous lipid should be easily detectable because naturally no deuterated isotope presents inside the cells. Thus, it is possible to observe lipid dynamics and metabolism in cells. Fig. 8Fast-switching CARS images of recrystallized sample of deuterated and nondeuterated stearic acid mixture at (a) and (b) , assigned to and symmetric stretching vibrations. . included the wavelength change, laser resynchronization after the wavelength change, and exposure time. (c) Merged CARS images from (a) and (b). (d) Spontaneous Raman spectra of each fatty acid. , . . 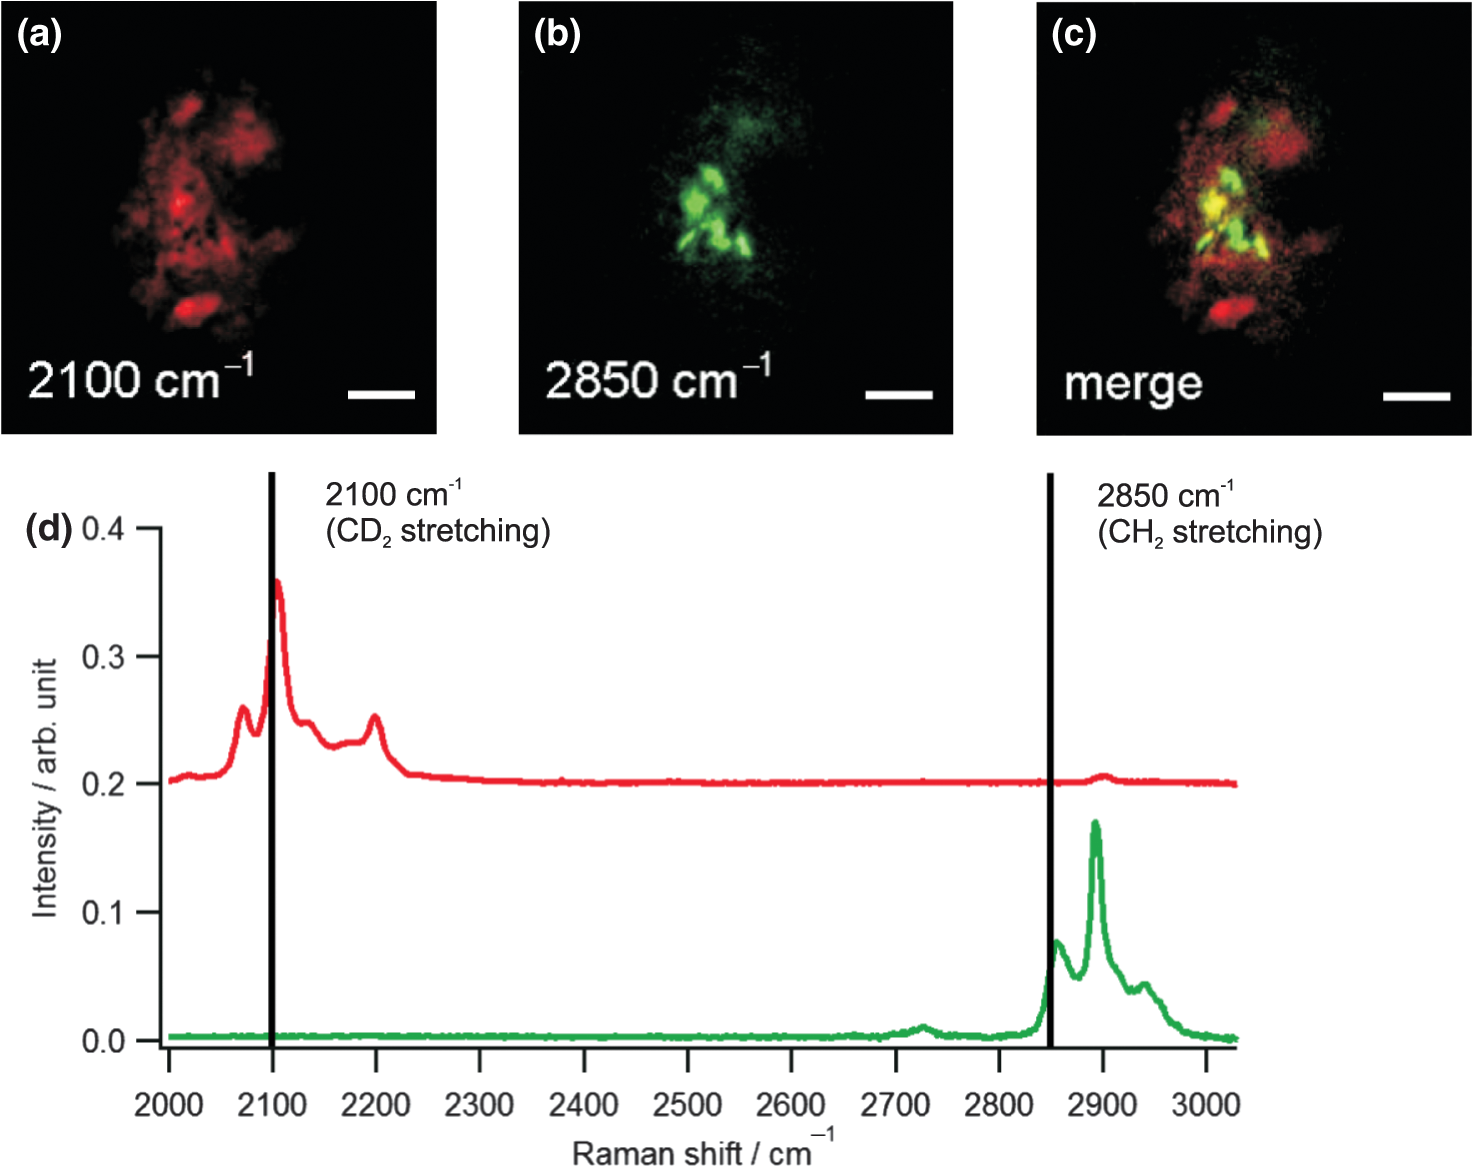 4.ConclusionWe succeeded in compensating for changes in the repetition frequency of an AOTF laser by using a pair of parallel plates mounted on galvanometer motors and a moveable end mirror of the cavity attached on a piezoelectric actuator. We employed the AOTF laser as a Stokes pulse source and constructed a fast spectral CARS microscopy system. Fast imaging was achieved by use of a microlens array, and good spectral imaging was demonstrated by using the AOTF laser. To improve the performance of spectral CARS microscopy, we minimized the timing jitter of both laser pulses and optimized the synchronization. The tunable wavelength range of the AOTF laser was from 800 to 940 nm, which is assigned to Raman shift regions of 400 to and 1600 to with the pump laser set at 775 and 709 nm, respectively. Molecular vibrations in the fingerprint region are highly sensitive to distinguish various molecular species. Therefore, it enables a molecularly sensitive detection for biological applications using CARS microscopy. Detection of CARS signals in the fingerprint region is still very challenging because the detected signals are typically weak and may possibly be overwhelmed by the nonresonant background contribution. Further experiments and careful observations in the fingerprint region are required to reveal the capability of our developed system. Fast spectral imaging of the Raman shift of the CH stretching vibration was demonstrated by observing lipid droplets in adipose cells. Our system was capable of fast switching and imaging between two significantly different wavelengths corresponding to stretching and stretching vibrations that belonged to deuterated and nondeuterated stearic acid, respectively. Similar to a four-wave mixing process, we also can employ the AOTF laser to realize fast spectral SRS microscopy. AcknowledgmentsThis research is partially supported by a Grant-in-Aid for Scientific Research from the Ministry of Education, Culture, Sports, Science, and Technology (MEXT) and the Japanese Science and Technology Agency (JST). ReferencesG. J. Puppelset al.,
“Studying single living cells and chromosomes by confocal Raman microspectroscopy,”
Nature, 347
(6290), 301
–303
(1990). http://dx.doi.org/10.1038/347301a0 NATUAS 0028-0836 Google Scholar
K. Hamadaet al.,
“Raman microscopy for dynamic molecular imaging of living cells,”
J. Biomed. Opt., 13
(4), 044027
(2008). http://dx.doi.org/10.1117/1.2952192 JBOPFO 1083-3668 Google Scholar
Z. Sunet al.,
“Perilipin1 promotes unilocular lipid droplet formation through the activation of Fsp27 in adipocytes,”
Nat. Commun., 4
(1594), 1594
(2013). http://dx.doi.org/10.1038/ncomms2581 NCAOBW 2041-1723 Google Scholar
R. SomwarC. T. RobertsO. Varlamov Jr.,
“Live-cell imaging demonstrates rapid cargo exchange between lipid droplets in adipocytes,”
FEBS Lett., 585
(12), 1946
–1950
(2011). http://dx.doi.org/10.1016/j.febslet.2011.05.016 FEBLAL 0014-5793 Google Scholar
L. KuerschnerC. MoessingerC. Thiele,
“Imaging of lipid biosynthesis: how a neutral lipid enters lipid droplets,”
Traffic, 9
(3), 338
–352
(2008). http://dx.doi.org/10.1111/tra.2008.9.issue-3 1398-9219 Google Scholar
C. D. L. Folmeset al.,
“High rates of residual fatty acid oxidation during mild ischemia decrease cardiac work and efficiency,”
J. Mol. Cell. Cardiol., 47
(1), 142
–148
(2009). http://dx.doi.org/10.1016/j.yjmcc.2009.03.005 JMCDAY 0022-2828 Google Scholar
T. R. Koveset al.,
“Mitochondrial overload and incomplete fatty acid oxidation contribute to skeletal muscle insulin resistance,”
Cell Metab., 7
(1), 45
–56
(2008). http://dx.doi.org/10.1016/j.cmet.2007.10.013 CMEEB5 1550-4131 Google Scholar
M. D. DuncanJ. ReintjesT. J. Manuccia,
“Scanning coherent anti-Stokes Raman microscope,”
Opt. Lett., 7
(8), 350
–352
(1982). http://dx.doi.org/10.1364/OL.7.000350 OPLEDP 0146-9592 Google Scholar
A. ZumbuschG. R. HoltomX. S. Xie,
“Three-dimensional vibrational imaging by coherent anti-Stokes Raman scattering,”
Phys. Rev. Lett., 82
(20), 4142
–4145
(1999). http://dx.doi.org/10.1103/PhysRevLett.82.4142 PRLTAO 0031-9007 Google Scholar
M. HashimotoT. ArakiS. Kawata,
“Molecular vibration imaging in the fingerprint region by use of coherent anti-Stokes Raman scattering microscopy with a collinear configuration,”
Opt. Lett., 25
(24), 1768
–1770
(2000). http://dx.doi.org/10.1364/OL.25.001768 OPLEDP 0146-9592 Google Scholar
X. NanW. Y. YangX. S. Xie,
“CARS microscopy: lights up lipids in living cells,”
Biophoton. Int., 11 44
–47
(2004). Google Scholar
P. NandakumarA. KovalevA. Volkmer,
“Vibrational imaging based on stimulated Raman scattering microscopy,”
New J. Phys., 11
(3), 033026
(2009). http://dx.doi.org/10.1088/1367-2630/11/3/033026 NJOPFM 1367-2630 Google Scholar
C. W. Freudigeret al.,
“Label-free biomedical imaging with high sensitivity by stimulated Raman scattering microscopy,”
Science, 322
(5909), 1857
–1861
(2008). http://dx.doi.org/10.1126/science.1165758 SCIEAS 0036-8075 Google Scholar
Y. Ozekiet al.,
“High-speed molecular spectral imaging of tissue with stimulated Raman scattering,”
Nat. Photon., 6
(12), 845
–851
(2012). http://dx.doi.org/10.1038/nphoton.2012.263 1749-4885 Google Scholar
L. Ujjet al.,
“Vibrational spectrum of a picosecond intermediate in the artificial BR5.12 photoreaction: picosecond time-resolved CARS of T5.12,”
J. Am. Chem. Soc., 122
(1), 96
–106
(2000). http://dx.doi.org/10.1021/ja991447e JACSAT 0002-7863 Google Scholar
J. X. Chenget al.,
“An epi-detected coherent anti-Stokes Raman scattering (E-CARS) microscope with high spectral resolution and high sensitivity,”
J. Phys. Chem. B, 105
(7), 1277
–1280
(2001). http://dx.doi.org/10.1021/jp003774a JPCBFK 1520-6106 Google Scholar
M. N. Slipchenkoet al.,
“Vibrational imaging of tablets by epi-detected stimulated Raman scattering microscopy,”
Analyst, 135
(10), 2613
–2619
(2010). http://dx.doi.org/10.1039/c0an00252f ANLYAG 0365-4885 Google Scholar
S. SunderR. MendelsohnH. J. Bernstein,
“Raman studies of the C-H and C-D stretching regions in stearic acid and some specifically deuterated derivatives,”
Chem. Phys. Lipids, 17
(4), 456
–465
(1976). http://dx.doi.org/10.1016/0009-3084(76)90047-5 CPLIA4 0009-3084 Google Scholar
M. Noesthedenet al.,
“Synthesis and characterization of CN-modified protein analogues as potential vibrational contrast agents,”
Bioorg. Chem., 35
(3), 284
–293
(2007). http://dx.doi.org/10.1016/j.bioorg.2006.12.004 BOCMBM 0045-2068 Google Scholar
H. Yamakoshiet al.,
“Imaging of EdU, an alkyne-tagged cell proliferation probe, by Raman microscopy,”
JACS, 133
(16), 6102
–6105
(2011). http://dx.doi.org/10.1021/ja108404p JACSAT 0045-2068 Google Scholar
C. L. Evanset al.,
“Chemical imaging of tissue in vivo with video-rate coherent anti-Stokes Raman scattering microscopy,”
Proc. Nat. Acad. Sci. U. S. A., 102
(46), 16807
–16812
(2005). http://dx.doi.org/10.1073/pnas.0508282102 PNASA6 0027-8424 Google Scholar
F. Ganikhanovet al.,
“Broadly tunable dual-wavelength light source for coherent anti-Stokes Raman scattering microscopy,”
Opt. Lett., 31
(9), 1292
–1294
(2006). http://dx.doi.org/10.1364/OL.31.001292 OPLEDP 0146-9592 Google Scholar
T. Hellereret al.,
“Monitoring of lipid storage in Caenorhabditis elegans using coherent anti-Stokes Raman scattering (CARS) microscopy,”
Proc. Nat. Acad. Sci. U. S. A., 104
(37), 14658
–14663
(2007). http://dx.doi.org/10.1073/pnas.0703594104 PNASA6 0027-8424 Google Scholar
M. Windbergset al.,
“Chemical imaging of oral solid dosage forms and changes upon dissolution using coherent anti-Stokes Raman scattering microscopy,”
Anal. Chem., 81
(6), 2085
–2091
(2009). http://dx.doi.org/10.1021/ac8020856 ANCHAM 0003-2700 Google Scholar
C. Y. Linet al.,
“Picosecond spectral coherent anti-Stokes Raman scattering imaging with principal component analysis of meibomian glands,”
J. Biomed. Opt., 16
(2), 021104
(2011). http://dx.doi.org/10.1117/1.3533716 JBOPFO 1083-3668 Google Scholar
Y. Ozekiet al.,
“Analysis and experimental assessment of the sensitivity of stimulated Raman scattering microscopy,”
Opt. Express, 17
(5), 3651
–3658
(2009). http://dx.doi.org/10.1364/OE.17.003651 OPEXFF 1094-4087 Google Scholar
L. Konget al.,
“Multicolor stimulated Raman scattering microscopy with a rapidly tunable optical parametric oscillator,”
Opt. Lett., 38
(2), 145
–147
(2013). http://dx.doi.org/10.1364/OL.38.000145 OPLEDP 0146-9592 Google Scholar
M. Baumgartlet al.,
“All-fiber laser source for CARS microscopy based on fiber optical parametric frequency conversion,”
Opt. Express, 20
(4), 4484
–4493
(2012). http://dx.doi.org/10.1364/OE.20.004484 OPEXFF 1094-4087 Google Scholar
Y. Ozekiet al.,
“Stimulated Raman hyperspectral imaging based on spectral filtering of broadband laser pulses,”
Opt. Lett., 37
(3), 431
–433
(2012). http://dx.doi.org/10.1364/OL.37.000431 OPLEDP 0146-9592 Google Scholar
M. Hashimotoet al.,
“High-speed spectral tuning CARS microscopy using AOTF laser,”
Proc. SPIE, 8226 82261N
(2012). http://dx.doi.org/10.1117/12.909507 PSISDG 0277-786X Google Scholar
S. Wadaet al.,
“Electronically tuned picosecond Ti:sapphire laser,”
RIKEN Rev., 2002
(49), 7
–9
(2002). RIREE6 0919-3405 Google Scholar
J. GengS. WadaH. Tashiro,
“A widely tunable picosecond Ti:sapphire laser without any mechanical action,”
in Conference on Lasers and Electro-Optics (CLEO 2000),
486
–487
(2000). Google Scholar
M. Hashimotoet al.,
“Automatic pulse duration control of picosecond laser using two-photon absorption detector,”
Jpn. J. Appl. Phys., 44
(6A), 3958
–3961
(2005). http://dx.doi.org/10.1143/JJAP.44.3958 JJAPA5 0021-4922 Google Scholar
T. Minamikawaet al.,
“Jitter reduction of two synchronized picosecond mode-locked lasers using balanced-cross correlator with two-photon detectors,”
Appl. Phys. Lett., 89
(19), 191101
(2006). http://dx.doi.org/10.1063/1.2374803 APPLAB 0003-6951 Google Scholar
T. Minamikawaet al.,
“Multi-focus excitation coherent anti-Stokes Raman scattering (CARS) microscopy and its applications for realtime imaging,”
Opt. Express, 17
(12), 9526
–9536
(2009). http://dx.doi.org/10.1364/OE.17.009526 OPEXFF 1094-4087 Google Scholar
K. SimonsE. Ikonen,
“Functional rafts in cell membranes,”
Nature, 387
(6633), 569
–572
(1997). http://dx.doi.org/10.1038/42408 NATUAS 0028-0836 Google Scholar
N. AbumradC. HarmonA. Ibrahimi,
“Membrane transport of long-chain fatty acids: evidence for a facilitated process,”
J. Lipid Res., 39
(12), 2309
–2318
(1998). JLPRAW 0022-2275 Google Scholar
X. NanJ. X. ChengX. S. Xie,
“Vibrational imaging of lipid droplets in live fibroblast cells with coherent anti-Stokes Raman scattering microscopy,”
J. Lipid Res., 44
(11), 2202
–2208
(2003). http://dx.doi.org/10.1194/jlr.D300022-JLR200 JLPRAW 0022-2275 Google Scholar
J. P. Pezackiet al.,
“Chemical contrast for imaging living systems: molecular vibrations drive CARS microscopy,”
Nat. Chem. Biol., 7
(3), 137
–145
(2011). http://dx.doi.org/10.1038/nchembio.525 1552-4450 Google Scholar
M. Paaret al.,
“Remodeling of lipid droplets during lipolysis and growth in adipocytes,”
J. Biol. Chem., 287
(14), 11164
–11173
(2012). http://dx.doi.org/10.1074/jbc.M111.316794 JBCHA3 0021-9258 Google Scholar
M. Bonnet al.,
“Imaging of chemical and physical state of individual cellular lipid droplets using multiplex CARS microscopy,”
J. Raman Spectrosc., 40
(7), 763
–769
(2009). http://dx.doi.org/10.1002/jrs.v40:7 JRSPAF 0377-0486 Google Scholar
T. Meyeret al.,
“Expanding multimodal microscopy by high spectral resolution coherent anti-Stokes Raman scattering imaging for clinical disease,”
Anal. Chem., 85
(14), 6703
–6715
(2013). http://dx.doi.org/10.1021/ac400570w ANCHAM 0003-2700 Google Scholar
S. SunderR. MendelsohnH. J. Bernstein,
“Raman studies of the C-H and C-D stretching region in stearic acid and some specifically deuterated derivatives,”
Chem. Phys. Lipids, 17
(4), 456
–465
(1976). http://dx.doi.org/10.1016/0009-3084(76)90047-5 CPLIA4 0009-3084 Google Scholar
B. P. GaberP. YagerW. L. Peticolas,
“Deuterated phospholipids as nonperturbing components for Raman studies of biomembranes,”
Biophys. J., 22
(2), 191
–207
(1978). http://dx.doi.org/10.1016/S0006-3495(78)85484-8 BIOJAU 0006-3495 Google Scholar
C. Matthäuset al.,
“New ways of imaging uptake and intracellular fate of liposomal drug carrier systems inside individual cells based on Raman microscopy,”
Mol. Pharm., 5
(2), 287
–293
(2008). http://dx.doi.org/10.1021/mp7001158 1543-8384 Google Scholar
E. O. PotmaX. S. Xie,
“Direct visualization of lipid phase segregation in single lipid bilayers with coherent anti-Stokes Raman scattering microscopy,”
Chem. Phys. Chem., 6
(1), 77
–79
(2005). http://dx.doi.org/10.1002/(ISSN)1439-7641 CPCHFT 1439-4235 Google Scholar
L. LiH. WangJ. X. Cheng,
“Quantitative coherent anti-Stokes Raman scattering imaging of lipid distribution in coexisting domains,”
Biophys. J., 89
(5), 3480
–3490
(2005). http://dx.doi.org/10.1529/biophysj.105.065607 BIOJAU 0006-3495 Google Scholar
|


