
|
|
1.IntroductionEstablishing reliable treatment response metrics remains a significant challenge in the preclinical and clinical evaluation of cancer therapeutics.1–3 Traditional approaches to evaluating treatment efficacy include measurement of tumor regression, stabilization of disease, number of disease nodules, and the functional characteristics of disease.1,4 Despite efforts to standardize these criteria, variability in the evaluation of these metrics may lead to misinterpretation and inconsistency in reporting treatment outcomes.2 Conventional methods used to quantify disease burden measure the gross physical properties of tumors but may fail to account for the functional status of disease.1,2,5–9 Various attempts have been made to address these limitations, including the development of more sophisticated in-vivo imaging tools that functionally assess treatment response.10,11 Many of these technologies are still in their infancy and have yet to be widely adopted.5,6,12 Additionally, xenograft animal models that are commonly used to evaluate cancer therapeutics are time and resource intensive and exhibit treatment response profiles that are partially host specific.13–15 Three-dimensional (3-D) tumor models can rapidly and functionally assess the evolution of treatment response and drug–cell interactions and may inform broader treatment evaluation strategies.16–21 This study utilizes a 3-D model for ovarian cancer (OvCa) to demonstrate that the interpretation of therapeutic outcomes is significantly impacted by the metrics used to define efficacy. These concepts were explored within the context of treatment planning for photodynamic therapy (PDT), an emerging light-based modality.22 OvCa is a particularly deadly disease that accounts for 6% of all cancer deaths among women in the United States.23 Approximately 75% of all OvCa cases are diagnosed at a late stage, which is characterized by intra- and extraperitoneal metastases ranging in size from microscopic to several centimeters in diameter.24 An important prognostic indicator for late stage OvCa is the size of residual disease.7,24–26 Winter et al. reported that optimal cytoreduction of OvCa tumor burden, where the larges t nodule is in diameter, results in an improved overall survival (OS) time of 64.1 months, the longest of all groups in the study.7 However, reduction of tumor burden to microscopic disease is not always achievable and requires significant expertise.7,27 Despite these and other advancements in surgery, radio-, and chemotherapeutic management of OvCa,24,28 late stage OvCa still exhibits a dismal mean OS time of 33 months and a mean 5-year progression free survival (PFS) rate of just 35%.23 Therapeutic modalities that complement the current standard of care by reducing the size of nodules and priming nodules for subsequent treatments are needed to afford better OS and PFS for OvCa patients. PDT is an emerging treatment modality that involves the excitation of a photosensitizer (PS) by light of a specific wavelength to produce reactive species that are toxic to cells.22 PDT is mechanistically distinct from chemo- or biologic therapies and has proven effective in cell populations that are resistant to chemo- or radiotherapy.29,30 We21,29,31–33 and others34–39 have shown PDT to be a promising treatment for a variety of cancers, including intraperitoneal sarcomatoses and carcinomatoses.40–44 A study by Molpus et al. reported that benzoporphyrin derivative (BPD)-PDT significantly reduced tumor burden in an orthotopic mouse model of advanced stage OvCa.45 However, multiple cycles of PDT were necessary to reduce tumor burden and manageable toxicities were noted in mice that received higher concentrations of BPD. Later, del Carmen et al. showed that BPD-PDT synergized with Erbitux-based anti-epidermal growth factor receptor therapy to improve tumor reduction and enhance survival with lower toxicities and fewer PDT cycles.33 A phase II clinical trial that utilized photofrin-PDT to treat intraperitoneal sarcomatoses and carcinomatoses demonstrated a survival benefit in patients. Reversible toxicities from this nonoptimized regimen included capillary leak syndrome and hydronephrosis.46 In rare cases, severe toxicities including pulmonary embolism, intra-abdominal abscesses, and fistulae occurred.46 As with traditional therapies used to manage OvCa,27,47 these results suggest that no single therapy, including PDT, will be sufficient to treat diseases in complex sites such as the peritoneal cavity.27,40 Combination therapies that are designed to leverage mechanistically distinct pathways can mitigate the limitations of each modality and may achieve improved outcomes.33 PDT-based combination regimens represent a promising approach for the management of OvCa because PDT operates by mechanisms that are distinct from chemo-, radio-, and immunotherapies,44 reduces OvCa nodule size,20 and synergizes with traditional therapies.21,33,44,48 PDT-based combination regimens represent a promising approach for the management of OvCa. Incorporation of PDT into a comprehensive treatment plan requires an improved understanding of how PDT dose parameters impact key prognostic indicators of OvCa such as size and viability. Preclinical treatment planning has traditionally involved the use of animal models to probe various treatment-related parameters, including dosage, schedule, pharmacokinetics, and pharmacodynamics, with the overall goal of standardizing a treatment regimen that maximizes efficacy while minimizing toxicity.33,40,49,50 The use of animal cancer models has been historically necessary for these studies because in-vitro cancer models (e.g., monolayer cell culture) do not exhibit the required biological or architectural features that would make treatment planning possible.13 Animal models are time and resource intensive, exhibit confounding issues related to host-specific treatment response, and do not facilitate the usage of functional analysis tools that could greatly enhance treatment evaluation.2,6,13,14,16,51 Recent advances in cell culture,12,18,21,52 imaging,16,20,53,54 and treatment evaluation9,55 techniques have led to the development of tumor cell line based high throughput treatment screening (HTS) platforms.56 Among these, 3-D platforms have emerged as attractive tools for treatment planning because they restore essential biological and structural features of tumors observed in-vivo and enable physiologically relevant, inexpensive, and highly reproducible studies.5,57–59 We20,21,31,60–62 and others18,58,63–67 have used tumor models that restore critical cues from the extracellular matrix to evaluate and optimize treatments for OvCa and other cancers. Previous studies from our group have demonstrated that BPD-PDT significantly decreases the size of 3-D OvCa nodules20 and synergistically enhances carboplatin efficacy.21 These and other studies31,59,61,68 suggest a role for 3-D models in improved treatment planning, including for PDT regimens. The myriad of variables that influence PDT outcomes, including the marginal benefit gained from dose escalation, PS concentration, fluence, and the metrics used to evaluate treatment response require further optimization.59 Furthermore, many efforts have been made to standardize treatment response criteria, most notably by the World Health Organization (WHO), the RECIST group, and recently in a study by Wolchok et al.1,4,69 These treatment response criteria have been regularly revised to account for important effects of newer modalities in order to avoid exclusion of otherwise promising regimens from the translational research pipeline.1,3,70 These concepts related to critical evaluation of treatment response metrics can be translated to HTS platforms as bioengineered 3-D tumor models become increasingly sophisticated and could complement current treatment planning approaches. The past three decades have seen the introduction of new functional imaging-based assays that enable rapid measurement of physiologic, metabolic, or biochemical changes in tissues.2,3,6,10 These technologies have the potential to greatly enhance treatment planning because they allow insights into the mechanisms that underlie treatment response.3,10 However, functional treatment response metrics still require development and validation before they can be reliably used in treatment planning studies.2 3-D tumor models may provide unique advantages to assess the utility of functional analysis for treatment planning purposes because they provide a simplified, yet physiologically relevant, environment in which to probe relevant metrics. The strengths and limitations of 3-D models for this role are still emerging, and studies that establish and validate relevant functional response metrics are required. In the present study, a comparative analysis of two key metrics was performed: (1) total volume (Fig. 1, middle row), calculated from viable (calcein) and nonviable (ethidium bromide) cells and (2) live volume, calculated from residual viable cells (calcein) (Fig. 1, bottom row). In contrast to viability, which was calculated by ratiometric analysis of calcein acetoxymethyl ester (AM) and ethidium bromide fluorescence intensity, the volume-based metrics described here were calculated from the physical borders of nodules demarcated by calcein AM (live volume) or calcein AM and ethidium bromide fluorescence (total volume).20 A PDT dose escalation study was performed to identify optimal PDT parameters that yielded maximal marginal therapeutic benefit. Fine-grained analyses of hundreds of individual nodules using multiple treatment response metrics provided unique insights into heterogeneities in PDT response that were not revealed by global averages. Live volume provided a better representation of PDT outcome than total volume. These findings highlight the importance of critically evaluating and characterizing functional treatment response metrics. Fig. 1Identification of problematic residual disease requires refinement of functional imaging approaches. Representative images taken at 72 h post-PDT depicting morphologic, total, and live volumes are shown for no-treatment controls, and nodules treated with 0.25, 1, and 10 μM BPD at a dose of . Total volume images (middle row) include both viable (calcein, green) and nonviable (ethidium bromide, red) cells and serve as a functional surrogate for morphologic volume images (bright-field, top row). Live volume images (bottom row) show corresponding viable tumors. Yellow arrows indicate the morphologic, total, and live volume images for the same BPD-PDT treated nodule. Scale bars (white) indicate 250 μm.  2.Materials and Methods2.1.Cell LinesHuman ovarian carcinoma cells NIH:OVCAR5 (OVCAR5) were obtained from Fox Chase Cancer Center (Philadelphia, Pennsylvania), where they were characterized by microsatellite marker analysis. The cells were grown in Roswell Park Memorial Institute 1640 medium (Mediatech Inc., Herndon, Virginia) and supplemented with 10% heat inactivated fetal calf serum (GIBCO Life Technologies, Grand Island, New York), penicillin, and streptomycin. Growth factor reduced (GFR) Matrigel (Catalog number 354230, BD Biosciences, San Jose, California) was used as a basement membrane in 3-D cultures. 2.2.3-D OvCa Model3-D OvCa cultures were plated as previously described.20,21,59,61 Briefly, GFR-Matrigel beds were prepared by pipetting 250 μL of chilled GFR-Matrigel solution onto a 24-well plate. The plate was placed in an incubator and matrigel beds were allowed to gel for 30 min at 37°C. OVCAR5 cells were prepared as a single-cell suspension in complete growth media containing 2% GFR-Matrigel and were pipetted at a density of . Nodules were allowed to form over a period of 10 days at 37°C in a 5% atmosphere. 2.3.Photodynamic TherapyPDT regimens were delivered to 3-D OvCa nodules as previously described.59 Briefly, wells containing 10-day old OvCa nodules were treated with 0.25, 1, or 10 μM BPD for 90 min in complete growth media. The media was replaced with 2% GFR-Matrigel media immediately prior to irradiation. Each well was irradiated with a 690-nm fiber-coupled diode laser (Model 7401, Intense Inc., North Brunswick, NJ) at an irradiance of . Fixed PDT doses [(PS) X Fluence] of 1.25, 5 and were applied to nodules incubated with 0.25, 1, or 10 μM BPD. Laser irradiation times and delivery were calculated and controlled as previously described.59 2.4.Evaluation of Treatment ResponseThe treatment response of 3-D OvCa nodules was assessed in situ via staining with calcein AM and ethidium bromide (live/dead, Invitrogen, L-3224, Carlsbad, California) to label live and dead cells, respectively, as previously described.20,21,59 Images were acquired with an Olympus FV-1000 confocal microscope at an objective magnification of . Laser and photomultiplier settings, optimized for maximum dynamic range, were kept internally consistent across experimental groups. The normalized viability was calculated as previously described.59 Pixel intensities from the calcein AM (live) and ethidium bromide (dead) channels were determined using custom matlab routines (Mathworks, Natick, Massachusetts) and separately averaged within individual nodules or across the entire field of view. Subsequently, the viability of individual nodules and the average viability for all nodules were calculated from appropriately scaled mean intensities of fluorescent signals per the following formula:20,59 Both total and live volumes were approximated from the major and minor axes of individual nodules using the following formula: Total volume was calculated by demarcating the major and minor axes of individual nodules after adding calcein AM and ethidium bromide fluorescence. The volume was then calculated using reported custom written matlab script.20 Live volume was calculated by segmenting calcein AM fluorescence from ethidium bromide fluorescence using a custom written matlab script. The major and minor axes of individual nodules were demarcated using only calcein AM fluorescence prior to calculating volume. Throughout the manuscript, the descriptor “average” refers to a mean taken from multiple wells, where each well contained hundreds of 3-D OvCa nodules. For example, average normalized live volume refers to the mean live volume of PDT-treated wells, divided by the mean live volume of PDT nontreated wells. Normalized live volume was also generated for individual nodules by dividing the live volume of an individual-treated nodule by the average normalized live volume of all nontreated nodules. BPD photobleaching was quantified as previously described.53,59 Briefly, photobleaching was evaluated in 10-day old 3-D OvCa nodules incubated with 0.25, 1, or 10 μM BPD for 90 min in complete growth media. Images of BPD fluorescence were acquired before and immediately after PDT. The change in BPD fluorescence was calculated using a custom-written matlab routine and reported as percentages (Table 3). Histograms describing OvCa nodule volume distributions were generated using previously described, custom-written, matlab routines.20,21,53 Live volume histograms, in which individual nodules were segmented into logarithmically spaced bins,20 were generated for PDT-treated (colored bars) and untreated (black bars) nodules at 24 and 72 h post-PDT (Fig. 3). 2.5.Classification of Nodules as “Highly Viable” and “Large”Thresholds for “highly viable” and “large” nodules are based on the 95th percentile of normalized viabilities and normalized live volumes for nodules treated with the most effective dose parameters (0.25 μM BPD at a dose of ). Twenty-four hours after PDT, nodules that exhibited a normalized viability were considered highly viable, and nodules that exhibited a normalized live volume were considered large. Seventy-two hours after PDT, nodules that exhibited a normalized viability were considered highly viable, and nodules that exhibited a normalized live volume were considered large. 2.6.Statistical AnalysisUnless otherwise indicated, values indicate the number of wells devoted to the treatment condition from a 24-well plate. Each well contains hundreds of OvCa nodules. The comparisons of cytotoxic efficacy were performed with one-way analysis of variance (ANOVA) or two-tailed test as appropriate. The comparisons for which a statistical test is not indicated were conducted via two-tailed test. values of were considered significant. For all figures, error bars indicate standard error of the mean. Regressions were evaluated by a least squares fit approach, and correlation coefficients were determined using Pearson’s product-moment correlation. The correlations between normalized live volume and PDT dose, or normalized viability and PDT dose, were constrained through (0,1) to account for untreated nodules. 3.ResultsCompared to live volume, total and morphologic volumes underestimated PDT efficacy, particularly when treatment was most effective. The morphologic, total, and live volume images of the same OvCa nodule treated with either 0.25 μM (left column) or 10 μM (right column) BPD-PDT are indicated by yellow arrows (Fig. 1). A significantly greater morphologic/total volume was evident for the nodule treated with 0.25 μM BPD-PDT compared to live volume. More nonviable fluorescence (ethidium bromide, red) was apparent in the total volume images for wells treated with 0.25 and 1 μM BPD-PDT compared to 10 μM BPD-PDT or no-treatment controls (Fig. 1). A comparative analysis of average normalized total volume and average normalized live volume was performed to determine which functional treatment response metrics provided a better representation of PDT outcome (Fig. 2). Fig. 2Percent difference in functional imaging metrics increases with PDT dose. An average normalized total volume (black bars) and average normalized live volume (gray bars) are plotted for nodules treated with 0.25, 1, and 10 μM BPD-PDT at doses of 1.25 (top row) and (bottom row) at both 24 (left column) and 72 (right column) h post-PDT (a). Average total and average live volume were normalized to no-treatment controls, which are indicated by a dotted black line. The percent difference in average normalized total volume relative to average normalized live volume is plotted for nodules treated with 0.25 μM (black), 1 μM (shaded gray), and 10 μM (white) BPD-PDT at doses of 1.25, 5, and at both 24 (left) and 72 (right) h post-PDT (b).  The average normalized live volume of wells treated with 0.25 μM BPD-PDT at a dose (24 h: , 72 h: ) was significantly less than the average normalized total volume (24 h: , 72 h: ) at both time points [Fig. 2(a), , ]. In addition, average normalized live volume of wells treated with 1 μM BPD-PDT at a dose of (24 h: , 72 h: ) was significantly less than the average normalized total volume (24 h: , 72 h: ) at both time points [Fig. 2(a), , ]. The average normalized live volume of wells treated with 0.25, 1, and 10 μM BPD-PDT at a dose of was not significantly different from no-treatment controls (dotted line) either 24 or 72 h post-PDT [Fig. 2(a), , , and , one-way ANOVA]. For wells treated with 0.25 μM BPD-PDT, the average normalized total volume measured at 24 h post-PDT was greater than the average normalized live volume at a PDT dose of and greater than the average normalized live volume at a PDT dose of [Fig. 2(b)]. For wells treated with 1 μM BPD-PDT, the normalized total volume was greater than the average normalized live volume at a PDT dose of and greater than the average normalized live volume at a PDT dose of [Fig. 2(b)]. For wells treated with 0.25 μM BPD-PDT, the average normalized total volume measured at 72 h post-PDT was greater than the average normalized live volume at a PDT dose of and greater than the average normalized live volume at a PDT dose of [Fig. 2(b)]. For wells treated with 1 μM BPD-PDT at the same time point, the normalized total volume was greater than the average normalized live volume at a PDT dose of and greater than the average normalized live volume at a PDT dose of [Fig. 2(b)]. Wells treated with 0.25 and 1 μM BPD at a PDT dose of exhibited a significant and sustained reduction in normalized live volume, which wells treated with 10 μM BPD-PDT did not exhibit. Because PDT dose-dependent correlations could be established between the average normalized live volume and the normalized viability or percent photobleached BPD for several BPD-PDT conditions, average normalized live volume likely provided a more accurate representation of PDT efficacy than average normalized total volume (Tables 1 and 2). Thus, the normalized live volume was subsequently used in conjunction with normalized viability to establish optimal PDT dose parameters to treat 3-D OvCa nodules. Wells treated with 0.25, 1, and 10 μM BPD at a dose of exhibited average normalized live volumes (, , , respectively) that were significantly less than no-treatment controls (dotted line) at 24 h post-PDT [Fig. 3(a) left, , ]. Normalized live volume histograms revealed that wells treated with 0.25, 1, and 10 μM BPD-PDT (, 6430, and 4677 nodules, respectively) exhibited a larger proportion of nodules with volumes compared to no-treatment controls (black bars) at 24 h post-PDT [Fig. 3(a), right]. This indicated that the PDT-induced reduction in average normalized live volume caused a population shift from nodules of large live volume to those of small live volume. Fig. 30.25 and 1 μM BPD-PDT resulted in a sustained reduction in normalized live nodule volume. Average normalized live volume measured at 24 h post-PDT is plotted for wells treated with 0.25 μM (blue), 1 μM (red), and 10 μM (green) BPD at a PDT dose of (a, left). An average normalized live volume of no treatment controls is indicated as a dotted line. Live volume histograms of nodules treated with 0.25, 1, and 10 μM BPD, and no-treatment controls (black bars) are shown at 24 h post-PDT (a, right). Average normalized live volume measured at 72 h post-PDT is plotted for wells treated with 0.25, 1, and 10 μM BPD at a PDT dose of (b, left). Live volume histograms of nodules treated with 0.25, 1, and 10 μM BPD, and no-treatment controls (black bars) are shown 72 h post-PDT (b, right). The dotted black line indicates no-treatment controls (a and b, left). 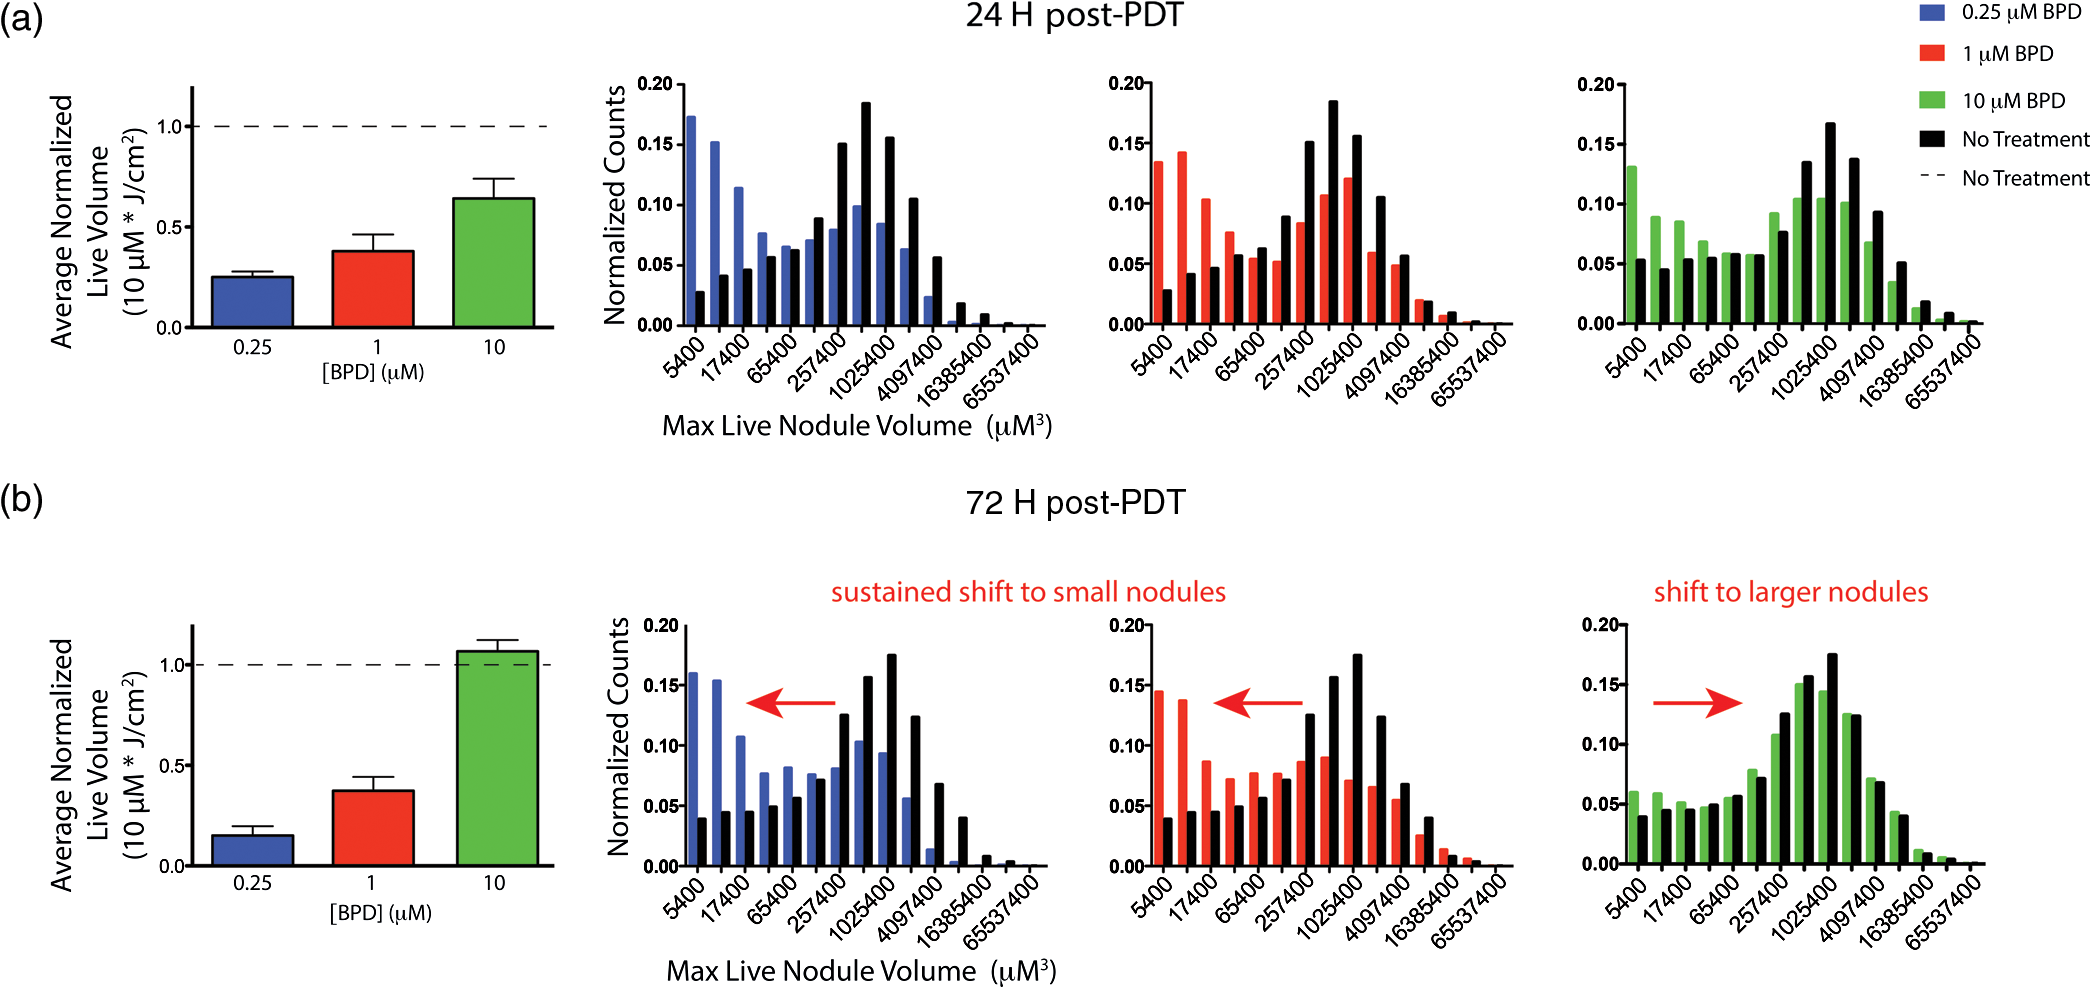 At 72 h post-PDT, wells treated with 0.25 and 1 μM BPD at a dose of exhibited the average normalized live volumes (, , respectively) that were significantly less than no-treatment controls [Fig. 3(b) left, wells, ]. The average normalized live volumes of wells treated with 0.25 and 1 μM at a PDT dose of in 72 h post-PDT were not significantly different from those observed in 24 h post-PDT [Figs. 3(a) and 3(b), left wells]. Furthermore, the normalized live volume histograms of wells treated with 0.25 and 1 μM BPD-PDT ( and 5737 nodules, respectively) revealed a larger proportion of nodules with volumes compared to no-treatment controls (black bars) at 72 h post-PDT [Fig. 3(b), right]. This indicated that, for wells treated with these BPD-PDT parameters, the shift from nodules of large volume to those of small volume was sustained up to 72 h post-PDT. Wells treated with 10 μM BPD at a dose of exhibited an average normalized live volume that was not significantly different from no-treatment controls at 72 h post-PDT [Fig. 3(b), left, wells]. Wells treated with 10 μM BPD-PDT exhibited a similar proportion of nodules with volumes compared to no-treatment controls [Fig. 3(b), right, wells]. Thus, although there was an initial reduction in normalized live volume of nodules treated with 10 μM BPD-PDT at a dose of in 24 h post-PDT, by 72 h post-PDT, this reduction in volume was lost [Figs. 4(a) and 4(b)]. Fig. 4Treatment response distributions comprised of individual nodules reveal PDT parameter-dependent benefits not reflected in average outcomes. For data acquired 24 h post-PDT, average normalized live volume is plotted against increasing dose for tumors treated with 0.25 μM (a, top row, left), 1 μM (a, top row, center), and 10 μM (a, top row, right) BPD-PDT (a). Normalized viability of corresponding individual nodules is plotted against normalized live volume for tumors treated with 0.25 μM (A, middle row, left), 1 μM (A, middle row, center), and 10 μM (A, middle row, right) BPD-PDT at doses of 5 and (a). Average normalized viability is plotted against increasing PDT dose for tumors treated with 0.25 μM (a, bottom row, left), 1 μM (a, bottom row, center), and 10 μM (a, bottom row, right) BPD-PDT (a). Corresponding plots for treatment response 72 h post-PDT are provided in (b). Red shaded regions indicate normalized live volumes and normalized viabilities in the 95th percentile of nodules treated with the most effective dose parameters (0.25 μM BPD at a dose of ).  Wells treated with 0.25 μM BPD-PDT at a PDT dose of exhibited the greatest reduction in average normalized live volume compared to those treated with 1 or 10 μM BPD-PDT in both 24 and 72 h post-PDT [Figs. 3(a) and 3(b), left, one-way ANOVA, ]. PDT dose escalation resulted in a linear increase in efficacy when measured by normalized live volume but a nonlinear increase in efficacy when measured by normalized viability. Wells treated with a PDT dose of exhibit a smaller percentage of nodules that are large and highly viable than wells treated with . To determine the marginal therapeutic benefit of increasing PDT dose, average normalized live volume [Fig. 4(a), top row] and average normalized viability [Fig. 4(a), bottom row] were plotted against increasing PDT dose for wells treated with 0.25, 1, and 10 μM BPD at 24 h post-PDT [Fig. 4(a)]. Significant, monotonically decreasing, linear correlations were established between average normalized live volume and increasing PDT dose for wells treated with 0.25 μM (top left), 1 μM (top center), and 10 μM (top right) BPD at 24 h post-PDT [Fig. 4(a), top row, , ]. This suggested that increasing the delivered PDT dose from 1.25 to resulted in linearly increasing therapeutic efficacy as evaluated by the average normalized live volume at 24 h post-PDT. A nonlinear correlation characterized by decreasing slope was observed between average normalized viability and increasing PDT dose for wells treated with 0.25 μM (bottom left), 1 μM (bottom center), and 10 μM (bottom right) BPD-PDT at 24 h post-PDT [Fig. 4(a) bottom row, nonlinear exponential decay, ]. Thus, increasing the PDT dose resulted in diminishing returns to PDT efficacy as evaluated by the average normalized viability at 24 h post-PDT. Because average normalized live volume and average normalized viability provided conflicting information regarding the efficacy of PDT dose escalation, a fine-grained treatment response analysis that included the normalized live volume and viability of hundreds of individual nodules was performed. Normalized live volume was plotted against normalized viability for individual OvCa nodules treated with 0.25 (middle row left), 1 (middle row center) and 10 (middle row right) μM BPD at PDT doses of 5 and at 24 [Fig. 4(a)] and 72 h post-PDT [Fig. 4(b)]. Wells treated with 0.25 μM BPD at a dose of exhibited a smaller percentage of nodules that were large and highly viable (5% of nodules exhibited a normalized viability , and 5% of nodules exhibited a normalized live volume ) compared to those treated at a dose of (28.3% of nodules exhibited a normalized viability , and 14.2% of nodules exhibited a normalized live volume ) at 24 h post-PDT [Fig. 4(a), middle left, and 4780 nodules, respectively]. Wells treated with 1 μM BPD at a dose of also exhibited a smaller percentage of nodules that were highly viable (28.0% of nodules exhibited a normalized viability ) than those treated at a dose of (48.2% of nodules exhibited a viability that was ) at 24 h post-PDT [Fig. 4(a), middle center]. However, the percentage of large nodules following 1 μM BPD-PDT at a dose of (8.2% of nodules exhibited a normalized live volume ) was not different from (7.7% of nodules exhibited a normalized live volume ) at 24 h post-PDT [Fig. 4(a), middle row center, and 6878 nodules, respectively]. The percentage of highly viable and large nodules present following 10 μM BPD-PDT at a dose of (55.8% of nodules exhibited a normalized viability , and 8.5% of nodules exhibited a normalized live volume ) was not different from (59.4% of nodules exhibited a normalized viability , and 7.9% of nodules exhibited a normalized live volume ) at 24 h post-PDT [Fig. 4(a), middle row right, and 4677 nodules, respectively]. Similar trends in PDT efficacy were observed in 72 h post-PDT. Significant, monotonically decreasing correlations were established between average normalized live volume and PDT dose for wells treated with 0.25 μM [Fig. 4(b), top left], 1 μM (top center), and 10 μM (top right) BPD at 72 h post-PDT [Fig. 4(b), top row, , ]. This suggested that increasing the delivered PDT dose from 1.25 to resulted in increasing therapeutic efficacy when treatment response was evaluated by normalized live volume at 72 h post-PDT. A nonlinear correlation characterized by decreasing slope was observed between average normalized viability and increasing PDT dose for wells treated with 0.25 μM [Fig. 4(b), bottom left], 1 μM (bottom center), and 10 μM (bottom right) BPD-PDT at 72 h post-PDT [Fig. 4(b), bottom row, nonlinear exponential decay model, ]. This suggested that increasing the PDT dose resulted in diminishing returns to marginal PDT efficacy as evaluated by average normalized viability. Wells treated with 0.25 μM BPD at a dose of exhibited a smaller percentage of highly viable and large nodules (5% of nodules exhibited normalized viabilities , and 5% of nodules exhibited normalized live volumes ) than those treated with (11.8% of nodules exhibited normalized viabilities , and 10.2% of nodules exhibited normalized live volumes ) at 72 h post-PDT [Fig. 4(b), middle row left, and 3153 nodules, respectively]. Wells treated with 1 μM BPD at a dose of exhibited a smaller percentage of highly viable and large nodules (9.3% of nodules exhibited normalized viabilities , and 17.7% of nodules exhibited normalized live volumes ) than those treated with (16.8% of nodules exhibited normalized viabilities , and 21.2% of nodules exhibited normalized live volumes ) at 72 h post-PDT [Fig. 4(b), middle row center, and 2907, respectively]. Wells treated with 10 μM BPD at a dose of exhibited a percentage of highly viable and large nodules (35.1% of nodules exhibited a normalized viability , and 42.2% nodules exhibited a normalized live volume ) that was minimally different from those treated at a dose of (36.1% of nodules exhibited a normalized viability that was , and 40.0% of nodules exhibited a normalized live volume ) at 72 h post-PDT [Fig. 4(b), middle row right, and 2825 nodules, respectively]. Nodules treated with 0.25 μM BPD at a dose of exhibited the greatest reduction in average normalized live volume and average normalized viability of all BPD-PDT conditions tested at both time points (, one-way ANOVA). Furthermore, nodules treated with 0.25 μM BPD at a dose of exhibited the smallest percentage of large and highly viable nodules at both time points. Nodules treated with 10 μM BPD exhibited the smallest reduction in both the average normalized live volume and the average normalized viability of BPD-PDT conditions tested at 24 and 72 h post-PDT [Figs. 4(a) and 4(b), right column]. Furthermore, the normalized live volume versus normalized viability distribution of individual wells treated with 10 μM BPD revealed no reduction in the number of highly viable and large nodules after increasing PDT dose from 5 to . Normalized live volume correlates with two-independent metrics for PDT efficacy, normalized viability and percent photobleached BPD, in wells treated with 0.25 and 1 μM BPD-PDT. It was unclear whether average normalized live volume or average normalized total volume provided a better volume-based treatment response metrics. Thus, the relationship between these metrics and two independent metrics of treatment efficacy, normalized viability, and percent photobleached BPD, was investigated at 24 h post-PDT (Table 1) and 72 h post-PDT (Table 2). Table 1Normalized live volume of nodules treated with 0.25 μM BPD-PDT correlates with independent metrics of PDT efficacy, whereas normalized total volume does not correlate at 24 h post-PDT.
Table indicates the average normalized live volume and average normalized total volume of BPD-PDT treated wells, and whether significant non-zero correlations could be established between these metrics and either normalized viability or PS photobleaching at 24 h post-PDT. Table 2Normalized live volume of nodules treated with 0.25 μM BPD-PDT correlates with independent metrics of PDT efficacy, whereas normalized total volume does not correlate at 72 h post-PDT.
Table indicates the average normalized live volume and average normalized total volume of BPD-PDT treated wells, and whether significant nonzero correlations could be established between these metrics and either normalized viability or PS photobleaching 72 h post-PDT. PS photobleaching (Table 3) is a widely used dosimetric parameter that is characterized by a loss of PS fluorescence and depending on context, can be a function of reactive oxygen species produced as a result of PDT.53,59,71–74 Normalized viability, a ratiometric of calcein and ethidium bromide fluorescence intensity, provided a measure of cytotoxicity in treated cells relative to no-treatment controls and is a well established treatment response metrics for in-vitro treatment screening applications.75,76 Table 3Percent BPD photobleached resulting from 0.25, 1, and 10 μM BPD-PDT.
Table indicates the average percentages of BPD that photobleached resulting from 0.25, 1 and 10 μM BPD-PDT at doses of 1.25, 5, and 10 μM* J/cm2. BPD fluorescence was measured immediately before and after PDT. Percent photobleached BPD was used to establish correlations with average normalized live volume and average normalized total volume. A significant PDT dose-dependent correlation was established between the normalized viability and the average normalized live volume for wells treated with 0.25 and 1 μM BPD-PDT in both 24 and 72 h post-PDT (Tables 1 and 2, wells). No correlation between normalized viability and average normalized total volume could be established for any BPD concentration at either time point. A significant PDT dose-dependent correlation was observed between average normalized live volume and percent photobleached BPD for wells treated with 0.25 and 1 μM BPD-PDT in both 24 and 72 h post-PDT (Tables 1 and 2, wells). No correlation between normalized total volume and percent photobleached BPD could be established for any concentration of BPD at either time point. Data points for percent photobleached BPD are shown in Table 3. For wells treated with 10 μM BPD-PDT, a significant correlation between normalized live volume and normalized viability could be established at 24 h after PDT (Table 1, wells) but not at 72 h post-PDT (Table 2, wells). The same was true of correlations between normalized live volume and percent photobleached BPD for wells treated at this dose, in that a correlation could only be established at 24 h post-PDT (Table 1, ) but not at 72 h post-PDT (Table 2, ). This may be because, at 72 h post-PDT, the average normalized live volumes of wells treated with 10 μM BPD-PDT were not significantly different from no-treatment controls at all three PDT doses. 4.DiscussionIn an effort to contribute to a quantitative treatment evaluation framework being developed by us and others,6,20,21,53,59,61,77 two functional volume-based metrics of treatment response were critically evaluated: (1) total volume, a surrogate for morphological evaluation of tumor volume; and (2) live volume, which identifies the residual viable portions of tumor nodules. Two independent and distinct metrics, normalized viability,20,59 and PS photobleaching53,74,78,79 were used to corroborate this volume-based interpretation of treatment response. Within this framework, four major conclusions to guide the evaluation of PDT-based regimens in preclinical settings are highlighted by this study: (1) morphologic imaging systematically misrepresents treatment efficacy, often when treatment is most effective; (2) live volume, which indicates residual viable cells, likely provides a more accurate representation of therapeutic efficacy than morphologic and total volume; (3) fine-grained analysis of individual nodules provides unique insights into susceptibilities of tumor populations that are missed in global averages; and (4) the interpretation of marginal therapeutic benefit from increasing PDT dose depends on the PS-light parameters and the metrics used to evaluate efficacy. To minimize variation in the reporting of treatment outcomes, there have been several attempts to standardize response criteria of solid tumors to therapy, most notably by the WHO69 and the RECIST group.1 In 1979, the WHO defined tumor regression as a primary therapeutic endpoint, implying that any successful treatment would result in a reduction in tumor volume, whereas unsuccessful treatments would result in a maintenance of tumor size or tumor progression.1,3,4 Although a reduction in tumor volume resulting from surgical and cytotoxic regimens is an appropriate prognostic indicator for OvCa,8,28,70,80 several clinically available therapies, including antibodies and small molecule inhibitors, often stabilize disease progression rather than eliciting tumor shrinkage.2,4 As a result, RECIST revised treatment response criteria in 2000 to include guidelines for reporting stable disease as a clinical endpoint. A study published by Wolchok et al. built on these efforts by establishing new criteria that capture subtle treatment response profiles characteristic of targeted therapies.4 These criteria included “durable stable disease,” which denoted tumors characterized by a slow decline in volume following therapy and “responses after an initial increase in total tumor burden.4” The guidelines for tumor reduction and stabilization continue to be revised by the WHO, RECIST, and others to encompass response to emerging therapies, highlighting the challenges associated with defining relevant metrics.2,4 There remains a need in preclinical and clinical settings to validate new metrics that can detect subtle anatomical, functional, and morphological changes in tumors to more fully leverage emerging therapies in treatment planning.2,3,6,10,11 This study adds to these efforts by comparatively evaluating two functional volume-based metrics, total and live volumes, which assess both the size and functional status of 3-D tumor nodules. It was observed that the average normalized total volume was often different from the average normalized live volume for wells treated with the same BPD-PDT conditions (Figs. 1 and 2). This can likely be attributed to important differences in the metrics. Normalized total volume is similar to the morphologic volume of disease (Fig. 1), which is based on structural boundaries distinguished by white-light contrast.1,70 Total and morphologic volume may misrepresent treatment efficacy because they inconsistently report reductions in viable disease (Fig. 2, Tables 1 and 2). Normalized live volume is a functional metric that quantitates the volume of only viable cells in tumors based on their esterase activity (Fig. 1).20,21 In the present study, normalized total volume and morphologic volume under-reported treatment response, particularly in situations where PDT was most effective. This was because, following treatment, a large proportion of dead nodules remained in the well and contributed to the calculation of total volume but not live volume (Figs. 1 and 2). This was particularly apparent in wells treated with 0.25 μM BPD at a dose of , in which normalized total volume was not significantly different from no-treatment controls, but the normalized live volume was significantly less than all other BPD-PDT conditions tested (Fig. 2). Conversely, in situations where PDT was not effective and only a few nonviable cells remained in a well (as in the case of 10 μM BPD-PDT at a dose of ), normalized total volume was not significantly different from normalized live volume and tended to accurately report efficacy (Fig. 2). This was because the volume of dead cells did not appreciably contribute to the calculation of total nodule volume. Thus, differences in the calculation of functional treatment response metrics significantly contribute to the interpretation of treatment outcome. As discussed by Sullivan et al., in the absence of a “gold-standard” metric, it is important to consider efficacy from multiple perspectives to provide complementary viewpoints regarding the physical and biological effects of any treatment.2–4 Guided by this perspective, the present study validated two functional volume-based metrics, live volume and total volume, with two additional independent metrics for treatment response: normalized viability and PS photobleaching.2 In cases where PDT caused a significant reduction in normalized live volume, normalized live volume correlated well with both normalized viability and percent BPD photobleaching (Tables 1 and 2). Normalized total volume, however, likely provided a poor representation of PDT efficacy because no significant correlations were observed with normalized viability or percent BPD photobleached for all conditions tested in this study (Tables 1 and 2). Because normalized total volume most significantly under-reported PDT efficacy in cases where PDT was particularly effective, these results suggest that commonly used approaches to evaluate treatment response based solely on morphological changes in disease, such as white light imaging, may lead to exclusion of potentially effective therapies. Metrics that incorporate information from functional imaging techniques, such as the measurement of viable cells in-vivo,10 will likely require substantial application-specific refinement. These findings highlight the importance of critically evaluating the metrics derived from functional imaging–based assays to ensure accurate evaluation of therapeutic efficacy in both in-vitro and in-vivo settings. Additional confounding factors in defining appropriate treatment response metrics are the differential cell death and survival processes that affect PDT efficacy.81,82 These pathways are impacted by many factors including the PS properties,82,83 the cellular localization and aggregation status of the PS,84–86 biological cues from the microenvironment,87 and the light delivery regimen.59,88,89 Depending on the concentration and the target tissue, BPD-PDT could induce cell death by various mechanisms including autophagy, necrosis, and apoptosis.81,90–93 Autophagy is a programmed lysosomal degradation pathway in which a cell self digests via autophagosomes to maintain homeostasis, adapt to stress, or recycle resources as part of either a cytotoxic or cytoprotective response depending on context.94 Although cell death with autophagy is characterized by large-scale vacuolization of the cytoplasm and the absence of chromatin condensation,95 the impact of these features on tumor volume remains poorly explored. Necrosis is a cell-death process that may be programmed and results from the depletion of bioenergetic molecules that are necessary for cell survival.81,82,90 Cells that are stressed or dying from necrotic mechanisms exhibit a swelling phenotype that leads to an increase in cell diameter.95,96 In these cases, an increase in normalized live volume may occur, and falsely under-report therapeutic efficacy resulting from PDT. Thus, multiple metrics should be used to complement normalized live volume to increase the probability of accurately reporting therapeutic efficacy. In addition, BPD-PDT has been shown to induce cell death by apoptosis, a well-studied biochemical process that is characterized by many morphological changes including chromatin condensation, fragmentation of DNA, and, importantly, cell shrinkage.2,59,82,97 PDT that results in a significant reduction in normalized live volume may be mediated in part by apoptotic mechanisms. An understanding of the relationships among cell-death mechanisms, the structural features of the disease following treatment, and the metrics that capture these features is necessary to develop more potent therapies that specifically target these cell-death pathways.59,98 An interesting finding was diminished efficacy with 10 μM BPD compared to 0.25 or 1 μM BPD at a fixed PDT dose (Figs. 3 and 4). This observation was echoed in a previous study by our group59 and is in contrast to a previous study by Andrzejak et al. who demonstrated that at an equivalent PDT dose, 10 μM BPD-PDT is significantly more effective than 1 μM BPD-PDT in preventing colony formation of 1c1c7 murine hepatoma cells.81 The authors suggested that this potentiation of PDT with higher concentrations of BPD is due to inhibition of autophagy because autophagosomes that are formed as a result of an autophagy-mediated cellular response can be inhibited by 10 μM BPD.99 It has been shown in several instances that autophagy can be cytoprotective against phototoxicity.81,100 However, biological variability between cell lines and disease models significantly impacts overall PDT efficacy for many reasons including differential PS uptake, PS localization, and differences in the photochemical and photophysical mechanisms lead to cytotoxicity.101,102 These factors may contribute to inconsistencies between this study and previous ones. The BPD concentration-dependent efficacy observed in this study could be due to a variety of factors including BPD aggregation,85 BPD self shielding,83,103 the high extinction coefficient of BPD,83 and concentration-dependent subcellular localization of BPD.59 Furthermore, lowering the irradiance of incident light while maintaining a fixed PDT dose was shown to increase cytotoxicity associated with 10 μM BPD-PDT.59 This suggests that oxygen diffusion to the site of photodynamic activity may play a significant role in mediating PDT efficacy in 3-D OvCa nodules. However, further study into the disease-specific biological and physical mechanisms that govern PDT efficacy will be required to fully optimize PDT regimens in both preclinical and clinical settings. The findings of the present study indicate that the response of 3-D OvCa nodules to PDT is heterogeneous. Following treatment with the same conditions, some nodules exhibited significant reductions in normalized live volume and viability, whereas others did not (Fig. 4). A number of physical and biological factors could explain this apparent PDT resistance exhibited by certain 3-D OvCa nodules. As discussed in a comprehensive review by Casas et al., variations in PS uptake and efflux, intracellular PS trafficking, PS aggregation, subcellular localization of the PS, expression of PDT cytoprotective proteins, hypoxia at tissue depth, and the specific cell-death pathways activated by PDT, could all potentially protect target tissues from phototoxicity.104 In addition, light attenuation due to depth-dependent scattering and absorption is well known to significantly diminish PDT efficacy and cause apparent PDT resistance.105,106 Because the biology of seemingly identical 3-D OvCa nodules may be in reality quite diverse,20 it is possible that variability in any of the above PDT cytoprotective mechanisms nonuniformly affected PDT efficacy across 3-D OvCa nodule distributions. An understanding of the specific physical and biological mechanisms that underlie PDT resistance will be required to design more effective treatment regimens. Heterogeneity in the treatment response characteristics of OvCa nodules may have potential relevance to clinical observations of advanced stage disease. As discussed in an elegant review by Bast et al., the growth and treatment response of clinical OvCa are often highly varied.47 Even if small numbers of treatment resistant OvCa cells persist in the peritoneal cavity following treatment, recurrence and eventually death can occur.47 In line with these observations, a previous study by our group demonstrated that the growth dynamic of 3-D OvCa nodules is diverse, exhibiting a bimodal log-normal size distribution.20 It is possible that this variability in OvCa nodule growth partially reflects the heterogeneity that is typical of OvCa biology and treatment response. The present study found that when the delivered PDT dose was increased from 5 to for nodules treated with 0.25 and 1 μM BPD, a significant linear reduction in average normalized live volume was observed at both 24 and 72 h post-PDT. In contrast, a nonlinear reduction was observed using average normalized viability as a treatment response metric [Figs. 4(a) and 4(b)]. The discrepancy between average normalized viability and average normalized live volume indicated ambiguity in marginal therapeutic benefit from PDT dose escalation. However, when the normalized live volume and viability of individual nodules were evaluated using fine-grained analysis routines, a smaller percentage of residual large and highly viable nodules were found to be present after compared to at both 24 and 72 h post-PDT. Therefore, considering average normalized live volume, but not viability, accurately revealed the therapeutic benefit afforded by increasing PDT dose. Because nodule volume is a key indicator of OvCa progression,7,24–26 these findings suggest PDT with low concentrations of BPD could yield nodules better primed for additional therapies29 and could result in better OS and PFS for patients. Furthermore, these custom fine-grained analysis routines facilitate the usage of multiple metrics to reveal heterogeneity and create a picture of treatment response that is more comprehensive than global averages. This framework, however, will require further refinement and validation toward its implementation for treatment planning purposes. As with all treatment modalities, none of the PDT regimens evaluated in this study completely eliminated residual large and highly viable nodules (Fig. 4). This was apparent after compiling individual nodules from a treatment group into a treatment response distribution based on their normalized viability and normalized live volume. Individual nodules were segmented into groups of PDT responders and nonresponders. Although the methodology underlying this segmentation is statistically robust, clearly defines responders from nonresponders, and reveals heterogeneity in treatment response, it does not include a physically or biologically relevant rationale that underlies segmentation. Segmentation of nodules based on features related to PDT resistance, such as expression of cytoprotective proteins, degree of hypoxia, or nodule size, could be a more robust method to classify nodules as PDT responders versus nonresponders. The present study demonstrates how in-vitro 3-D platforms may be a useful tool to identify populations of nodules that do not fully respond to treatment, allowing for the development of a combination treatment regimens that can address potentially problematic diseases. Although promising functional imaging techniques are currently in development for various cancer applications, the most commonly used methodologies to evaluate treatment response ignore subtle yet potentially important aspects of drug–cell interactions.3,10,11 This is especially important in context of late-stage OvCa because 80% of patients develop recurrent disease, indicating that a proportion of cells did not respond to initial treatment.7,8,27 Along with critical consideration of appropriately defined treatment response metrics, in-vitro 3-D platforms can be leveraged to aid in the development and optimization of rationally designed combination strategies that target problematic residual disease with the goal of reducing toxicities and improving outcomes. AcknowledgmentsWe would like to thank Ms. Sriya Anbil for advice regarding analysis of complex data sets, Dr. Akilan Palanisami for discussion regarding quantification of photosensitizer photobleaching, and Dr. Bryan Spring for advice regarding image processing. Dr. Hasan and Dr. Celli wish to acknowledge support from the National Cancer Institute and the National Institutes of Health: 1RC1CA146337 (T.H.), R01CA158415 (T.H.), R01CA1609998 (T.H.), and R00CA155045 (J.P.C.). ReferencesP. Therasseet al.,
“New guidelines to evaluate the response to treatment in solid tumors. European Organization for Research and Treatment of Cancer, National Cancer Institute of the United States, National Cancer Institute of Canada,”
J. Natl. Cancer Inst., 92
(3), 205
–216
(2000). http://dx.doi.org/10.1093/jnci/92.3.205 JNCIEQ 0027-8874 Google Scholar
D. C. SullivanC. Gatsonis,
“Response to treatment series: part 1 and introduction, measuring tumor response—challenges in the era of molecular medicine,”
AJR Am. J. Roentgenol., 197
(1), 15
–17
(2011). http://dx.doi.org/10.2214/AJR.11.7083 AJROAM 0092-5381 Google Scholar
V. Yaghmaiet al.,
“Response to treatment series: part 2, tumor response assessment—using new and conventional criteria,”
AJR Am. J. Roentgenol., 197
(1), 18
–27
(2011). http://dx.doi.org/10.2214/AJR.11.6581 AJROAM 0092-5381 Google Scholar
J. D. Wolchoket al.,
“Guidelines for the evaluation of immune therapy activity in solid tumors: immune-related response criteria,”
Clin. Cancer Res., 15
(23), 7412
–7420
(2009). http://dx.doi.org/10.1158/1078-0432.CCR-09-1624 CCREF4 1078-0432 Google Scholar
N. T. ElliottF. Yuan,
“A review of three-dimensional in vitro tissue models for drug discovery and transport studies,”
J. Pharm. Sci., 100
(1), 59
–74
(2011). http://dx.doi.org/10.1002/jps.22257 JPMSAE 0022-3549 Google Scholar
F. Leblondet al.,
“Pre-clinical whole-body fluorescence imaging: review of instruments, methods and applications,”
J. Photochem. Photobiol. B, 98
(1), 77
–94
(2010). http://dx.doi.org/10.1016/j.jphotobiol.2009.11.007 JPPBEG 1011-1344 Google Scholar
W. Winteret al.,
“Tumor residual after surgical cytoreduction in prediction of clinical outcome in stage IV epithelial ovarian cancer: a Gynecologic Oncology Group Study,”
J. Clin. Oncol., 26
(1), 83
–92
(2008). http://dx.doi.org/10.1200/JCO.2007.13.1953 JCONDN 0732-183X Google Scholar
E. J. Tanneret al.,
“Surveillance for the detection of recurrent ovarian cancer: survival impact or lead-time bias?,”
Gynecol. Oncol., 117
(2), 336
–340
(2010). http://dx.doi.org/10.1016/j.ygyno.2010.01.014 GYNOA3 0090-8258 Google Scholar
O. Keppet al.,
“Cell death assays for drug discovery,”
Nat. Rev. Drug Discov., 10
(3), 221
–237
(2011). http://dx.doi.org/10.1038/nrd3373 NRDDAG 1474-1776 Google Scholar
Y. Uranoet al.,
“Selective molecular imaging of viable cancer cells with pH-activatable fluorescence probes,”
Nat. Med., 15
(1), 104
–109
(2009). http://dx.doi.org/10.1038/nm.1854 1078-8956 Google Scholar
J. Grimmet al.,
“Use of gene expression profiling to direct in vivo molecular imaging of lung cancer,”
Proc. Natl Acad. Sci. U. S. A., 102
(40), 14404
–14409
(2005). http://dx.doi.org/10.1073/pnas.0503920102 PNASA6 0027-8424 Google Scholar
W. Mueller-Klieser,
“Three-dimensional cell cultures: from molecular mechanisms to clinical applications,”
Am. J. Physiol., 273
(4 Pt 1), C1109
–C1123
(1997). AJPHAP 0002-9513 Google Scholar
M. SinghC. L. MurrielL. Johnson,
“Genetically engineered mouse models: closing the gap between preclinical data and trial outcomes,”
Cancer Res., 72
(11), 2695
–2700
(2012). http://dx.doi.org/10.1158/0008-5472.CAN-11-2786 CNREA8 0008-5472 Google Scholar
S. Loiselet al.,
“Relevance, advantages and limitations of animal models used in the development of monoclonal antibodies for cancer treatment,”
Crit. Rev. Oncol. Hematol., 62
(1), 34
–42
(2007). http://dx.doi.org/10.1016/j.critrevonc.2006.11.010 CCRHEC 1040-8428 Google Scholar
N. E. SharplessR. A. Depinho,
“The mighty mouse: genetically engineered mouse models in cancer drug development,”
Nat. Rev. Drug Discov., 5
(9), 741
–754
(2006). http://dx.doi.org/10.1038/nrd2110 NRDDAG 1474-1776 Google Scholar
F. PampaloniE. G. ReynaudE. H. Stelzer,
“The third dimension bridges the gap between cell culture and live tissue,”
Nat. Rev. Mol. Cell Biol., 8
(10), 839
–845
(2007). http://dx.doi.org/10.1038/nrm2236 NRMCBP 1471-0072 Google Scholar
A. L. CorreiaM. J. Bissell,
“The tumor microenvironment is a dominant force in multidrug resistance,”
Drug Resist. Updat., 15
(1–2), 39
–49
(2012). http://dx.doi.org/10.1016/j.drup.2012.01.006 1368-7646 Google Scholar
G. Y. Leeet al.,
“Three-dimensional culture models of normal and malignant breast epithelial cells,”
Nat. Methods, 4
(4), 359
–365
(2007). http://dx.doi.org/10.1038/nmeth1015 1548-7091 Google Scholar
P. A. VidiM. J. BissellS. A. Lelievre,
“Three-dimensional culture of human breast epithelial cells: the how and the why,”
Methods Mol. Biol., 945 193
–219
(2013). http://dx.doi.org/10.1007/978-1-62703-125-7 MMBIED 0097-0816 Google Scholar
J. P. Celliet al.,
“Quantitative imaging reveals heterogeneous growth dynamics and treatment-dependent residual tumor distributions in a three-dimensional ovarian cancer model,”
J. Biomed. Opt., 15
(5), 051603
(2010). http://dx.doi.org/10.1117/1.3483903 JBOPFO 1083-3668 Google Scholar
I. Rizviet al.,
“Synergistic enhancement of carboplatin efficacy with photodynamic therapy in a three-dimensional model for micrometastatic ovarian cancer,”
Cancer Res., 70
(22), 9319
–9328
(2010). http://dx.doi.org/10.1158/0008-5472.CAN-10-1783 CNREA8 0008-5472 Google Scholar
T. J. Doughertyet al.,
“Photodynamic therapy,”
J. Natl. Cancer Inst., 90
(12), 889
–905
(1998). http://dx.doi.org/10.1093/jnci/90.12.889 JNCIEQ 0027-8874 Google Scholar
R. SiegelD. NaishadhamA. Jemal,
“Cancer Statistics, 2012,”
CA: Cancer J. Clin., 62
(1), 10
–29
(2012). http://dx.doi.org/10.3322/caac.20138 0007-9235 Google Scholar
V. Guarneriet al.,
“Achievements and unmet needs in the management of advanced ovarian cancer,”
Gynecol. Oncol., 117
(2), 152
–158
(2010). http://dx.doi.org/10.1016/j.ygyno.2009.11.033 GYNOA3 0090-8258 Google Scholar
W. J. Hoskinset al.,
“The effect of diameter of largest residual disease on survival after primary cytoreductive surgery in patients with suboptimal residual epithelial ovarian carcinoma,”
Am. J. Obstet. Gynecol., 170
(4), 974979
–979980
(1994). http://dx.doi.org/10.1016/S0002-9378(94)70090-7 AJOGAH 0002-9378 Google Scholar
J. I. Akahiraet al.,
“Prognostic factors of stage IV epithelial ovarian cancer: a multicenter retrospective study,”
Gynecol. Oncol., 81
(3), 398
–403
(2001). http://dx.doi.org/10.1006/gyno.2001.6172 GYNOA3 0090-8258 Google Scholar
S. Vaughanet al.,
“Rethinking ovarian cancer: recommendations for improving outcomes,”
Nat. Rev. Cancer, 11
(10), 719
–725
(2011). http://dx.doi.org/10.1038/nrc3144 NRCAC4 1474-175X Google Scholar
D. Chiet al.,
“Improved progression-free and overall survival in advanced ovarian cancer as a result of a change in surgical paradigm,”
Gynecol. Oncol., 114
(1), 26
–57
(2009). http://dx.doi.org/10.1016/j.ygyno.2009.03.018 GYNOA3 0090-8258 Google Scholar
J. P. Celliet al.,
“Verteporfin-based photodynamic therapy overcomes gemcitabine insensitivity in a panel of pancreatic cancer cell lines,”
Lasers Surg. Med., 43
(7), 565
–574
(2011). LSMEDI 0196-8092 Google Scholar
M. Triesscheijnet al.,
“Photodynamic therapy in oncology,”
Oncologist, 11
(9), 1034
–1044
(2006). http://dx.doi.org/10.1634/theoncologist.11-9-1034 1083-7159 Google Scholar
C. L. Evanset al.,
“Killing hypoxic cell populations in a 3D tumor model with EtNBS-PDT,”
PLoS One, 6
(8), e23434
(2011). http://dx.doi.org/10.1371/journal.pone.0023434 1932-6203 Google Scholar
I. Rizviet al.,
“Photoimmunotherapy and irradiance modulation reduce chemotherapy cycles and toxicity in a murine model for ovarian carcinomatosis: perspective and results,”
Israel J. Chem., 52
(8–9), 776
–787
(2012). http://dx.doi.org/10.1002/ijch.v52.8/9 ISJCAT 0021-2148 Google Scholar
M. G. del Carmenet al.,
“Synergism of epidermal growth factor receptor-targeted immunotherapy with photodynamic treatment of ovarian cancer in vivo,”
J. Natl. Cancer Inst., 97
(20), 1516
–1524
(2005). http://dx.doi.org/10.1093/jnci/dji314 JNCIEQ 0027-8874 Google Scholar
C. M. Peterson,
“Photodynamic therapy of human ovarian epithelial carcinoma, OVCAR-3, heterotransplanted in the nude mouse,”
Am. J. Obstet. Gynecol., 167
(6), 1852
–1855
(1992). http://dx.doi.org/10.1016/0002-9378(92)91786-A AJOGAH 0002-9378 Google Scholar
N. Pfeiffer,
“Photodynamic therapy curbs ovarian cancer,”
J. Clin. Laser Med. Surg., 11
(3), 151
–152
(1993). JCLSEO Google Scholar
L. Lilgeet al.,
“Light dosimetry for intraperitoneal photodynamic therapy in a murine xenograft model of human epithelial ovarian carcinoma,”
Photochem. Photobiol., 68
(3), 281
–288
(1998). http://dx.doi.org/10.1111/php.1998.68.issue-3 PHCBAP 0031-8655 Google Scholar
B. A. Goffet al.,
“Treatment of ovarian cancer with photodynamic therapy and immunoconjugates in a murine ovarian cancer model,”
Br. J. Cancer, 74
(8), 1194
–1198
(1996). http://dx.doi.org/10.1038/bjc.1996.516 BJCAAI 0007-0920 Google Scholar
K. Songet al.,
“Intraperitoneal photodynamic therapy for an ovarian cancer ascite model in Fischer 344 rat using hematoporphyrin monomethyl ether,”
Cancer Sci., 98
(12), 1959
–1964
(2007). http://dx.doi.org/10.1111/cas.2007.98.issue-12 CSACCM 1347-9032 Google Scholar
L. Guyonet al.,
“Photodiagnosis and photodynamic therapy of peritoneal metastasis of ovarian cancer,”
Photodiagn. Photodyn. Ther., 9
(1), 16
–47
(2012). http://dx.doi.org/10.1016/j.pdpdt.2011.08.003 PPTHBF 1572-1000 Google Scholar
P. Agostiniset al.,
“Photodynamic therapy of cancer: an update,”
CA Cancer J. Clin., 61
(4), 250
–281
(2011). http://dx.doi.org/10.3322/caac.v61:4 CAMCAM 0007-9235 Google Scholar
K. A. CengelE. GlatsteinS. M. Hahn,
“Intraperitoneal photodynamic therapy,”
Cancer Treat. Res., 134 493
–514
(2007). http://dx.doi.org/10.1007/978-0-387-48993-3_34 CTRREP 0927-3042 Google Scholar
M. Ascencioet al.,
“The place of photodynamic therapy in gynecology,”
Gynecol. Obstet. Fertil., 35
(11), 1155
–1165
(2007). http://dx.doi.org/10.1016/j.gyobfe.2007.07.035 1297-9589 Google Scholar
W. Zhonget al.,
“In vivo high-resolution fluorescence microendoscopy for ovarian cancer detection and treatment monitoring,”
Br. J. Cancer, 101
(12), 2015
–2022
(2009). http://dx.doi.org/10.1038/sj.bjc.6605436 BJCAAI 0007-0920 Google Scholar
M. F. ZuluagaN. Lange,
“Combination of photodynamic therapy with anti-cancer agents,”
Curr. Med. Chem., 15
(17), 1655
–1673
(2008). http://dx.doi.org/10.2174/092986708784872401 CMCHE7 0929-8673 Google Scholar
K. L. Molpuset al.,
“Intraperitoneal photodynamic therapy of human epithelial ovarian carcinomatosis in a xenograft murine model,”
Cancer Res., 56
(5), 1075
–1082
(1996). CNREA8 0008-5472 Google Scholar
S. K. Hendrenet al.,
“Phase II trial of debulking surgery and photodynamic therapy for disseminated intraperitoneal tumors,”
Ann. Surg. Oncol., 8
(1), 65
–71
(2001). http://dx.doi.org/10.1007/s10434-001-0065-x 1068-9265 Google Scholar
R. C. Bast Jr.B. HennessyG. B. Mills,
“The biology of ovarian cancer: new opportunities for translation,”
Nat. Rev. Cancer, 9
(6), 415
–428
(2009). http://dx.doi.org/10.1038/nrc2644 NRCAC4 1474-175X Google Scholar
L. R. Duskaet al.,
“Combination photoimmunotherapy and cisplatin: effects on human ovarian cancer ex vivo,”
J. Natl. Cancer Inst., 91
(18), 1557
–1563
(1999). http://dx.doi.org/10.1093/jnci/91.18.1557 JNCIEQ 0027-8874 Google Scholar
D. K. Armstrong,
“Relapsed ovarian cancer: challenges and management strategies for a chronic disease,”
Oncologist, 7
(90005), 20
–28
(2002). http://dx.doi.org/10.1634/theoncologist.7-suppl_5-20 1083-7159 Google Scholar
Z. Huanget al.,
“Photodynamic therapy for treatment of solid tumors—potential and technical challenges,”
Technol. Cancer Res. Treat., 7
(4), 309
–320
(2008). TCRTBS 1533-0346 Google Scholar
M. Vinciet al.,
“Advances in establishment and analysis of three-dimensional tumor spheroid-based functional assays for target validation and drug evaluation,”
BMC Biol., 10
(1), 29
(2012). http://dx.doi.org/10.1186/1741-7007-10-29 1741-7007 Google Scholar
S. V. SharmaD. A. HaberJ. Settleman,
“Cell line-based platforms to evaluate the therapeutic efficacy of candidate anticancer agents,”
Nat. Rev. Cancer, 10
(4), 241
–253
(2010). http://dx.doi.org/10.1038/nrc2820 NRCAC4 1474-175X Google Scholar
M. D. Gliddenet al.,
“Image-based quantification of benzoporphyrin derivative uptake, localization, and photobleaching in 3D tumor models, for optimization of PDT parameters,”
Theranostics, 2
(9), 827
–839
(2012). http://dx.doi.org/10.7150/thno.4334 THERDS 1838-7640 Google Scholar
J. P. Celliet al.,
“Imaging and photodynamic therapy: mechanisms, monitoring, and optimization,”
Chem. Rev., 110
(5), 2795
–2838
(2010). http://dx.doi.org/10.1021/cr900300p CHREAY 0009-2665 Google Scholar
J. Hatoket al.,
“In vitro assays for the evaluation of drug resistance in tumor cells,”
Clin. Exp. Med., 9
(1), 1
–7
(2009). http://dx.doi.org/10.1007/s10238-008-0011-3 CLEPEY 1591-9528 Google Scholar
L. A. Kunz-Schughartet al.,
“The use of 3-D cultures for high-throughput screening: the multicellular spheroid model,”
J. Biomol. Screen., 9
(4), 273
–285
(2004). http://dx.doi.org/10.1177/1087057104265040 JBISF3 1087-0571 Google Scholar
J. DebnathJ. S. Brugge,
“Modelling glandular epithelial cancers in three-dimensional cultures,”
Nat. Rev. Cancer, 5
(9), 675
–688
(2005). http://dx.doi.org/10.1038/nrc1695 NRCAC4 1474-175X Google Scholar
J. M. Leeet al.,
“A three-dimensional microenvironment alters protein expression and chemosensitivity of epithelial ovarian cancer cells in vitro,”
Lab. Invest., 93
(5), 528
–542
(2013). LAINAW 0023-6837 Google Scholar
I. Rizviet al.,
“PDT dose parameters impact tumoricidal durability and cell death pathways in a 3D ovarian cancer model,”
Photochem. Photobiol., 89
(4), 942
–952
(2013). http://dx.doi.org/10.1111/php.12065 PHCBAP 0031-8655 Google Scholar
C. L. Evanset al.,
“Visualizing photodynamic therapy response with time-lapse OCT in an in vitro model of metastatic ovarian cancer,”
Proc. SPIE, 7551 75510J
(2010). http://dx.doi.org/10.1117/12.843271 PSISDG 0277-786X Google Scholar
R. Rahmanzadehet al.,
“Ki-67 as a molecular target for therapy in an in vitro three-dimensional model for ovarian cancer,”
Cancer Res., 70
(22), 9234
–9242
(2010). http://dx.doi.org/10.1158/0008-5472.CAN-10-1190 CNREA8 0008-5472 Google Scholar
A. O. Abu-Yousifet al.,
“PuraMatrix encapsulation of cancer cells,”
J. Vis. Exp., 17
(34), e1692
(2009). http://dx.doi.org/10.3791/1692 JVEOA4 1940-087X Google Scholar
Y. C. Tunget al.,
“High-throughput 3D spheroid culture and drug testing using a 384 hanging drop array,”
Analyst, 136
(3), 473
–478
(2011). http://dx.doi.org/10.1039/c0an00609b ANLYAG 0365-4885 Google Scholar
H. Hosoyaet al.,
“Engineering fibrotic tissue in pancreatic cancer: a novel three-dimensional model to investigate nanoparticle delivery,”
Biochem. Biophys. Res. Commun., 419
(1), 32
–37
(2012). http://dx.doi.org/10.1016/j.bbrc.2012.01.117 BBRCA9 0006-291X Google Scholar
Z. YangX. Zhao,
“A 3D model of ovarian cancer cell lines on peptide nanofiber scaffold to explore the cell-scaffold interaction and chemotherapeutic resistance of anticancer drugs,”
Int. J. Nanomed., 6 303
–310
(2011). http://dx.doi.org/10.2147/IJN IJNNHQ 1178-2013 Google Scholar
M. J. BissellH. G. HallG. Parry,
“How does the extracellular matrix direct gene expression?,”
J. Theor. Biol., 99
(1), 31
–68
(1982). http://dx.doi.org/10.1016/0022-5193(82)90388-5 JTBIAP 0022-5193 Google Scholar
K. Lawrensonet al.,
“In vitro three-dimensional modelling of human ovarian surface epithelial cells,”
Cell Prolif., 42
(3), 385
–393
(2009). http://dx.doi.org/10.1111/cpr.2009.42.issue-3 CPROEM 1365-2184 Google Scholar
S. Coutieret al.,
“Effects of fluence rate on cell survival and photobleaching in meta-tetra-(hydroxyphenyl)chlorin-photosensitized Colo 26 multicell tumor spheroids,”
Photochem. Photobiol., 73
(3), 297
–303
(2001). http://dx.doi.org/10.1562/0031-8655(2001)073<0297:EOFROC>2.0.CO;2 PHCBAP 0031-8655 Google Scholar
WHO Handbook for Reporting Results Of Cancer Treatment, World Health Organization Offset Publication, Geneva, Switzerland
(1979). Google Scholar
F. Cademartiriet al.,
“Imaging for oncologic staging and follow-up: review of current methods and novel approaches,”
Acta Biomedica Atenei Parmensis, 79
(2), 85
–91
(2008). Google Scholar
B. C. WilsonM. S. PattersonL. Lilge,
“Implicit and explicit dosimetry in photodynamic therapy: a new paradigm,”
Lasers Med. Sci., 12
(3), 182
–199
(1997). http://dx.doi.org/10.1007/BF02765099 LMSCEZ 1435-604X Google Scholar
T. S. Manget al.,
“Photobleaching of porphyrins used in photodynamic therapy and implications for therapy,”
Photochem. Photobiol., 45
(4), 501
–506
(1987). http://dx.doi.org/10.1111/php.1987.45.issue-4 PHCBAP 0031-8655 Google Scholar
B. W. Pogueet al.,
“Protoporphyrin IX fluorescence photobleaching increases with the use of fractionated irradiation in the esophagus,”
J. Biomed. Opt., 13
(3), 034009
(2008). http://dx.doi.org/10.1117/1.2937476 JBOPFO 1083-3668 Google Scholar
M. WestonM. Patterson,
“Calculation of singlet oxygen dose using explicit and implicit dose metrics during benzoporphyrin derivative monoacid ring A (BPD-MA)-PDT in vitro and correlation with MLL cell survival,”
Photochem. Photobiol., 87
(5), 1129
–1166
(2011). http://dx.doi.org/10.1111/php.2011.87.issue-5 PHCBAP 0031-8655 Google Scholar
S. J. Morris,
“Real-time multi-wavelength fluorescence imaging of living cells,”
Biotechniques, 8
(3), 296
–308
(1990). BTNQDO 0736-6205 Google Scholar
I. MacCoubreyP. MooreR. Haugland,
“Quantitative fluorescence measurements of cell viability (cytotoxicity) with a multi-well plate scanner,”
J. Cell Biol., 111
(5 pt 2), 58a
(1990). JCLBA3 0021-9525 Google Scholar
M. RudinR. Weissleder,
“Molecular imaging in drug discovery and development,”
Nat. Rev. Drug Discov., 2
(2), 123
–131
(2003). http://dx.doi.org/10.1038/nrd1007 NRDDAG 1474-1776 Google Scholar
M. Ascencioet al.,
“Protoporphyrin IX fluorescence photobleaching is a useful tool to predict the response of rat ovarian cancer following hexaminolevulinate photodynamic therapy,”
Lasers Surg. Med., 40
(5), 332
–341
(2008). http://dx.doi.org/10.1002/(ISSN)1096-9101 LSMEDI 0196-8092 Google Scholar
S. Anbilet al.,
“A photobleaching-based PDT dose metric predicts PDT efficacy over certain BPD concentration ranges in a three-dimensional model of ovarian cancer,”
Proc. SPIE, 8568 85680S
(2013). http://dx.doi.org/10.1117/12.2010840 Google Scholar
E. L. Eisenhaueret al.,
“The effect of maximal surgical cytoreduction on sensitivity to platinum-taxane chemotherapy and subsequent survival in patients with advanced ovarian cancer,”
Gynecol. Oncol., 108
(2), 276
–281
(2008). http://dx.doi.org/10.1016/j.ygyno.2007.10.022 GYNOA3 0090-8258 Google Scholar
M. AndrzejakM. PriceD. H. Kessel,
“Apoptotic and autophagic responses to photodynamic therapy in 1c1c7 murine hepatoma cells,”
Autophagy, 7
(9), 979
–984
(2011). http://dx.doi.org/10.4161/auto AUTOC9 1554-8627 Google Scholar
E. BuytaertM. DewaeleP. Agostinis,
“Molecular effectors of multiple cell death pathways initiated by photodynamic therapy,”
BBA Rev. Cancer, 1776
(1), 86
–107
(2007). http://dx.doi.org/10.1016/j.bbcan.2007.07.001 0304-419X Google Scholar
B. AvelineT. HasanR. W. Redmond,
“Photophysical and photosensitizing properties of benzoporphyrin derivative monoacid ring A (BPD-MA),”
Photochem. Photobiol., 59
(3), 328
–335
(1994). http://dx.doi.org/10.1111/php.1994.59.issue-3 PHCBAP 0031-8655 Google Scholar
D. Kesselet al.,
“The role of subcellular localization in initiation of apoptosis by photodynamic therapy,”
Photochem. Photobiol., 65
(3), 422
–426
(1997). http://dx.doi.org/10.1111/php.1997.65.issue-3 PHCBAP 0031-8655 Google Scholar
B. M. AvelineT. HasanR. W. Redmond,
“The effects of aggregation, protein binding and cellular incorporation on the photophysical properties of benzoporphyrin derivative monoacid ring A (BPDMA),”
J. Photochem. Photobiol. B Biol., 30
(2–3), 161
–169
(1995). http://dx.doi.org/10.1016/1011-1344(95)07174-Z JPPBEG 1011-1344 Google Scholar
B. AvelineR. Redmond,
“Can cellular phototoxicity be accurately predicted on the basis of sensitizer photophysics?,”
Photochem. Photobiol., 69
(3), 306
–316
(1999). http://dx.doi.org/10.1562/0031-8655(1999)069<0306:CCPBAP>2.3.CO;2 PHCBAP 0031-8655 Google Scholar
C. M. Whitacreet al.,
“Photodynamic therapy of human breast cancer xenografts lacking caspase-3,”
Cancer Lett., 179
(1), 43
–49
(2002). http://dx.doi.org/10.1016/S0304-3835(01)00853-9 CALEDQ 0304-3835 Google Scholar
T. H. Fosteret al.,
“Fluence rate effects in photodynamic therapy of multicell tumor spheroids,”
Cancer Res., 53
(6), 1249
–1254
(1993). CNREA8 0008-5472 Google Scholar
B. C. Wilson,
“Photodynamic therapy: light delivery and dosage for second-generation photosensitizers,”
in Photosensitizing Compounds: Their chemistry, Biology and Clinical Use,
60
–77
(1989). Google Scholar
S. G. Parekhet al.,
“Photodynamic modulation of wound healing with BPD-MA and CASP,”
Lasers Surg. Med., 24
(5), 375
–381
(1999). http://dx.doi.org/10.1002/(ISSN)1096-9101 LSMEDI 0196-8092 Google Scholar
P. C. AnaN. D. TatianaR. H. Michael,
“Mechanisms in photodynamic therapy: part two—cellular signaling, cell metabolism and modes of cell death,”
Photodiagn. Photodyn. Ther., 2
(1), 1
–23
(2005). PPTHBF 1572-1000 Google Scholar
D. KesselY. Luo,
“Photodynamic therapy: a mitochondrial inducer of apoptosis,”
Cell Death Differ., 6
(1), 28
–35
(1999). http://dx.doi.org/10.1038/sj.cdd.4400446 CDDIEK 1350-9047 Google Scholar
D. KesselM. G. VicenteJ. J. Reiners Jr.,
“Initiation of apoptosis and autophagy by photodynamic therapy,”
Lasers Surg. Med., 38
(5), 482
–488
(2006). http://dx.doi.org/10.1002/(ISSN)1096-9101 LSMEDI 0196-8092 Google Scholar
B. LevineG. Kroemer,
“Autophagy in the pathogenesis of disease,”
Cell, 132
(1), 27
–42
(2008). http://dx.doi.org/10.1016/j.cell.2007.12.018 CELLB5 0092-8674 Google Scholar
G. KroemerB. Levine,
“Autophagic cell death: the story of a misnomer,”
Nat. Rev. Mol. Cell. Biol., 9
(12), 1004
–1010
(2008). http://dx.doi.org/10.1038/nrm2529 NRMCBP 1471-0072 Google Scholar
A. L. EdingerC. B. Thompson,
“Death by design: apoptosis, necrosis and autophagy,”
Curr. Opin. Cell Biol., 16
(6), 663
–669
(2004). http://dx.doi.org/10.1016/j.ceb.2004.09.011 COCBE3 0955-0674 Google Scholar
L. G. Ratkayet al.,
“Amelioration of antigen-induced arthritis in rabbits by induction of apoptosis of inflammatory cells with local application of transdermal photodynamic therapy,”
Arthritis Rheum., 41
(3), 525
–534
(1998). http://dx.doi.org/10.1002/(ISSN)1529-0131 ARHEAW 0004-3591 Google Scholar
A. CastanoT. DemidovaM. Hamblin,
“Mechanisms in photodynamic therapy: part two—cellular signaling, cell metabolism and modes of cell death,”
Photodiagn. Photodyn. Ther., 2
(1), 1
–23
(2005). http://dx.doi.org/10.1016/S1572-1000(05)00030-X PPTHBF 1572-1000 Google Scholar
E. Donohueet al.,
“Inhibition of autophagosome formation by the benzoporphyrin derivative verteporfin,”
J. Biol. Chem., 286
(9), 7290
–7300
(2011). http://dx.doi.org/10.1074/jbc.M110.139915 JBCHA3 0021-9258 Google Scholar
J. J. Reiners Jr.et al.,
“Assessing autophagy in the context of photodynamic therapy,”
Autophagy, 6
(1), 7
–18
(2010). http://dx.doi.org/10.4161/auto AUTOC9 1554-8627 Google Scholar
K. T. Moestaet al.,
“Lack of reciprocity in drug and light dose dependence of photodynamic therapy of pancreatic adenocarcinoma in vitro,”
Cancer Res., 55
(14), 3078
–3084
(1995). CNREA8 0008-5472 Google Scholar
T. Osakiet al.,
“Intracellular localization and concentration as well as photodynamic effects of benzoporphyrin derivative monoacid ring A in four types of rodent tumor cells,”
Cancer Lett., 243
(2), 281
–292
(2006). http://dx.doi.org/10.1016/j.canlet.2005.11.044 CALEDQ 0304-3835 Google Scholar
I. Georgakoudi,
“Singlet oxygen- versus nonsinglet oxygen-mediated mechanisms of sensitizer photobleaching and their effects on photodynamic dosimetry,”
Photochem. Photobiol., 67
(6), 612
–625
(1998). http://dx.doi.org/10.1111/j.1751-1097.1998.tb09102.x PHCBAP 0031-8655 Google Scholar
A. Casaset al.,
“Mechanisms of resistance to photodynamic therapy,”
Curr. Med. Chem., 18
(16), 2486
–2515
(2011). http://dx.doi.org/10.2174/092986711795843272 CMCHE7 0929-8673 Google Scholar
B. C. WilsonG. Adam,
“A Monte Carlo model for the absorption and flux distributions of light in tissue,”
Med. Phys., 10
(6), 824
–830
(1983). http://dx.doi.org/10.1118/1.595361 MPHYA6 0094-2405 Google Scholar
T. S. Mang,
“Lasers and light sources for PDT: past, present and future,”
Photodiagn. Photodyn. Ther., 1
(1), 43
–48
(2004). http://dx.doi.org/10.1016/S1572-1000(04)00012-2 PPTHBF 1572-1000 Google Scholar
|
|||||||||||||||||||||||||||||||||||||||||||||||||||||||||||||||||||||||||||||||||||||||||||||||||||||||||||||||||||||||||||||||||||||||||||||||||||||||||||||||||||||||||||||||||||||||||||||||||||


