

|
|
1.IntroductionInterferometric phase microscopy (IPM) provides quantitative phase imaging of transparent biological samples, including live cells in vitro.1 At each spatial point, the quantitative phase of light passing through the sample is proportional to its optical thickness, which is the product of the physical thickness of the sample and its integral refractive index, i.e., the sum of all refractive indices across the sample thickness.2 For this reason, IPM lacks molecular specificity, and is not able to selectively visualize targets of interest inside the cells, as can be done by fluorescence microscopy. The use of gold nanoparticles (AuNPs) as molecular contrast agents in photothermal (PT) imaging has been researched over the past decade.3–5 PT imaging can be explained by introducing the concept of plasmon resonance. When applying an electric field on a metal by illuminating it with light with a certain wavelength, plasmon resonance in the form of nanostructure oscillations of free electrons occurs.6 AuNPs in particular have large absorption coefficients in relatively narrow spectral bands, depending on their size and shape. In general, the spectral response of the plasmon resonance of gold nanospheres is within the visible range. The plasmon resonance causes local heating of the AuNPs, which can be detected optically, e.g., by recording the induced local changes in the sample refractive index.7–13 The optical methods that were employed for imaging AuNPs within biological tissues using the PT effect include differential interference contrast (DIC)7,8 and optical coherence tomography.9–13 While most systems and methods are indeed capable of imaging AuNPs in various sizes down to the single particle level, they have not been implemented in scan-less mode for creating wide-field quantitative images.7–13 Alternatively, a total internal refraction (TIR) prism, on which the sample is placed, is required in order to generate an evanescence wave in the interface between the sample and air.14,15 Baffou et al.16 used white-light illumination and a special digital camera that can multiplex several interferograms simultaneously utilizing a modified Hartmann grating precisely positioned in front of it. In this setup, each image pixel translates into 4 pixels on the digital camera. This setup was used for identifying a single gold nanodisc of approximately 300 nm in diameter, and other larger patterns, by measuring the thermally induced refractive-index variations of the surrounding medium, without using it for obtaining molecular imaging in biological cells. In the current study, we introduce a wide-field IPM system with the capability of quantitatively identifying AuNPs in a far-field off-axis holographic manner, without the need for a TIR prism or a special grating, while conjugating the AuNPs to biological cells and thus obtaining molecular imaging. Due to the wide-field, scan-free imaging, acquisition time is shortened, while increasing field of view (FOV), and thus increasing overall efficiency of the entire imaging process. 2.Optical SetupThe proposed PT wide-field IPM system is presented in Fig. 1. To image the phase signatures of photothermally excited AuNPs, we have used a low-coherence off-axis Linnik interferometer illuminated by a titanium-sapphire (Ti:Sapph) laser. An additional laser with a wavelength that suits the peak plasmonic resonance of the AuNPs is integrated into the interferometer sample arm to obtain PT excitation of the AuNPs. Fig. 1Wide-field IPM setup with molecular specificity using a sample labeled with AuNPs. Ti:Sapph: titanium-sapphire laser (), used as the IPM imaging beam; DPSS: diode-pumped solid-state green laser (532 nm), used as the PT excitation source for the AuNPs; L1, L2, L3, L4: lenses; BS: beam splitter; LPF: spectral long-pass filter (cut-off wavelength at 593 nm); DM: dichroic mirror (cut-off wavelength at 593 nm); MO: microscope objective; CMOS: digital camera. 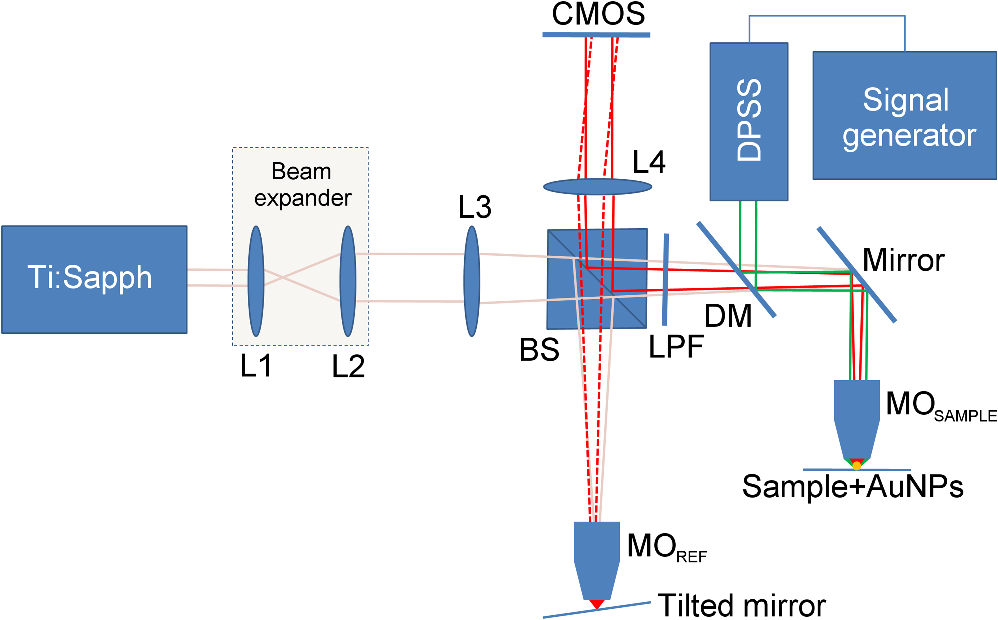 2.1.Wide-Field IPMFigure 1 shows an off-axis Linnik interferometer illuminated by a Ti:Sapph laser (Micra-5, Coherent), tuned to a central wavelength of 780 nm, and a full width half maximum spectral bandwidth of 40 nm, defining a coherence length of 6.7 μm.17 This coherence length allows elimination of erroneous interferences originated from back-reflections from optical elements in the system or from unfocused layers inside the sample, yielding low noise levels. As shown in Fig. 1, the illumination beam from the Ti:Sapph laser is expanded using lenses L1 and L2 in order to match the beam spot size upon the sample plane to the sensor size. After lens L3, positioned in a 4-f configuration with respect to the microscope objectives, the beam is split into reference and sample beams by beam splitter (BS). On the sample arm, a mirror directs the beam into microscope objective (, Newport) and the sample is illuminated. Light back-reflected from the sample is magnified by and projected through BS and lens L4 onto the CMOS digital camera (DCC1545M, Thorlabs, Newton, New Jersey). The reference beam, from the other output of the BS, goes through a compensating microscope objective , and is back-reflected by a slightly tilted mirror. Then, the reference beam is projected onto the camera with a small angle with respect to the sample beam, creating an off-axis interference pattern on the digital camera. 2.2.PT ExcitationSmall diameter (10 to 90 nm) spherical AuNPs have peak or near-peak absorption coefficient at a green wavelength of 532 nm.6 To excite the AuNPs at the peak absorption wavelength, we used a diode pump solid state (DPSS) laser (LRS-0532-PFM-00200-03, Laserglow, Toronto, Canada) connected to a signal generator (DSOX 2002A, Agilent, Santa Clara, California), which can modulate the beam at wide ranges of frequencies (we have used 30 Hz for cellular imaging). The green excitation beam is incorporated into the interferometric sample arm by dichroic mirror (DM) (FF593-Di03, Semrock, Rochester, New York) and passes through . A long-pass filter (LPF) (FF01-593/LP, Semrock) prevents green light back-reflection residues from reaching the camera. For some experiments, we have added a green beam narrower/expander and/or a focusing lens, in order to adjust the green spot size upon the sample and consequently the power density () to the excitation levels needed. 3.Data ProcessingAfter data acquisition, the digital processing includes the quantitative phase calculation from the off-axis interferogram, followed by an image-sequence time-resolved analysis for extracting the PT phase signal. 3.1.Phase AcquisitionAssuming that the off-axis interference pattern on the camera contains straight fringes with respect to the -direction, the off-axis interferogram of the sample can be expressed as follows:18,19 where and are the sample and reference beam intensities, respectively, is the angle of the reference beam relative to the sample beam upon the camera plane, is the wavenumber, and is the phase profile, which is proportional to the product of the refractive index difference and the thickness of the sample . Hence, the cosine term of the interference pattern captures the spatial phase modulation of the light going through the sample twice. When using a low-coherence source, however, the interference zone has a limited width of , where is the central wavelength and is the spectral bandwidth of the source. Therefore, we chose an area of inside the coherence-limited FOV, which was sufficient to image a single cell.The recorded interferogram is digitally two-dimensional (2-D) Fourier-transformed using MATLAB to create the image spectrum which consisted of a zero-order term and two high-order cross-correlation terms, spatially separated from the zero-order term.19 Then one of the cross-correlation terms is spatially filtered, centered, and padded with zeros. After an inverse Fourier-transform, we obtain a complex matrix, for which the argument represents the wrapped phase of the sample, . This phase profile is then digitally unwrapped to remove ambiguities.20 3.2.PT Signal AcquisitionWe first used spherical AuNPs with diameters of 70 nm (A11-70, Nanopartz, Loveland, Colorado), which strongly absorb light at a wavelength of 532 nm.6,21 This local light absorption produces a localized temperature rise and subsequent local variations of the refractive index, whereas the phase signal recorded by the camera explicitly depends on the refractive index. We modulated the excitation beam to illuminate the sample with an excitation frequency of and, as can be seen in Fig. 2(a), obtained local phase oscillations on the spatial point representing the nanoparticle position. Recording the image sequence at a frame rate higher than twice enabled us to analyze each pixel in the FOV, and de-modulate the temporal Fourier signal shown in Fig. 2(b) by filtering . We define the PT phase signal as the peak-to-peak magnitude of the local PT-induced phase oscillations , as obtained by an inverse Fourier-transform of the spectrum filtered around the excitation frequency. Fig. 2PT phase signal: (a) Phase oscillations in the AuNPs location caused by the PT effect, originated by a 30-Hz excitation of AuNPs at their plasmonic resonance peak wavelength. (b) The corresponding Fourier signal, showing a peak at the modulation frequency.  Analytical analysis for the absorption and heat conductivity was developed elsewhere.7 We present the spatial profile of the peak to peak phase shift at a distance from the center of the AuNPs as follows:9 where represents the refractive-index variations due to temperature rise, is the thermal conductivity of the surrounding medium, is the excitation beam intensity at a distance from the AuNP central location, is the number of AuNPs subjected to the excitation, and is the AuNPs absorption coefficient. If the beam covers the entire FOV, a wide-field image of the PT phase signal can be obtained.4.Imaging of Test Targets4.1.PT Imaging of Aqueous AuNPs Solution and AuNPs on a CoverslipTo demonstrate wide-field PT imaging, we prepared a 250-μm thick chamber filled with an aqueous solution of the 70-nm AuNPs mentioned above (70 ppm diluted to 25%). The sample was excited at various illumination powers, modulated at 50 Hz in time. As described earlier, the PT phase signal for each pixel was acquired by analysis of the time-resolved change of the sample phase, . For this experiment, we define the mean PT signal as the average signal over a small region of , overlapping with the excitation beam. Equation (2) determines the PT signal dependency on the excitation beam power, among other factors. By keeping all other parameters constant, the signal should rise linearly with an increase in the excitation beam power, which gives us an indication that we do measure a PT signal originated from the AuNPs. Figure 3 demonstrates this linear relation in our case. Indeed, since the thermal parameters and the concentration (estimated by , the number of AuNPs contributing to the temperature rise in the excited volume) were invariant, the sole contributor to the rise of was . This suggests that the measured PT signal was linearly dependent on excitation power, which supports the theoretical analysis. Fig. 3Spatially averaged PT phase signal as a function of the excitation power for an aqueous solution of 70 nm spherical AuNPs, as measured by wide-field IPM. Dashed red line is a linear fit, . Green line represents the theoretical response.  Next, we used wide-field IPM to image a coverslip covered with AuNPs. To prepare the sample, a drop of aqueous solution of AuNPs was carefully smeared upon a glass coverslip. Figures 4(a) and 4(b) show the phase signature of a FOV, containing three AuNP conjugates. This demonstrates the system ability to obtain wide-field interferometric PT signals and image several AuNP conjugates simultaneously, without the need for lateral scanning. Possible explanations for the nonuniform PT signal strength of the different aggregates are the relatively small beam diameter, which caused excitation by different power densities across the FOV, as well as the different dimensions of the aggregates and the number of nanoparticles creating each of them.22 AuNPs aggregation changes the absorption coefficient of the nanospheres,23 or , as defined in Eq. (2). This degrades our ability to conduct a thorough investigation of the PT signal as a function of the aggregate size. For this reason, we have also created a test target containing groups of isolated AuNPs using lithography, as presented in the next section. Fig. 4Wide-field PT phase signal of the AuNPs on a glass coverslip. (a) PT phase signal image. The white arrow indicates on the AuNPs located in the middle of the excitation beam. Video 1 shows the filtered phase oscillations in time (Video 1, MPEG, 5.3 MB) [URL: http://dx.doi.org/10.1117/1.JBO.18.11.111414.1. (b) Three-dimensional view of the same field of view shown in (a). (c) PT phase signal cross-section along the dashed white line shown in (a). Red-dashed graph: Gaussian fitted curve. (d) Blue dots: measured PT phase signal maxima as a function of the excitation power. Red-dashed line: linear fit. Green-solid line: theoretical graph.  For the case of AuNPs on a coverslip, in order to examine the PT phase signal response as a function of the excitation power, the excitation beam diameter was reduced to 5 μm and its power was gradually changed from 5 to 40 mW on the sample plane by the DPSS laser power control. The solid black line in Fig. 4(c) shows the PT phase signal cross section along the path indicated by the dotted white line in Fig. 4(a). The red-dashed line in Fig. 4(c) is a Gaussian fitted curve, with a good correlation to the measured PT phase signal ( of 0.989). This result is in agreement with previous works, as well as with theoretical analysis of plasmon resonance.9,24 The PT signal as a function of laser power is shown in Fig. 4(d) at the peak of the AuNPs aggregate marked by a white arrow in Fig. 4(a). Here too, the signal is linearly dependent on the laser power, as suggested by Eq. (2). Moreover, the actual measured PT signal is in good agreement with the theoretical values [solid line in Fig. 4(d)]. To assess the quality of the measurements, we define two types of signal-to-noise ratios (SNRs). Temporal SNR is defined as the PT phase signal at the center of the AuNPs when the PT excitation is active, divided by the phase value at the same spatial point, but without excitation. Spatial SNR is defined as the PT phase signal at the center of the AuNPs when the PT excitation is active, divided by the average phase value when the PT excitation is active but at an area where there are no AuNPs. In our case, the peak level of the PT phase signal is 0.420 rad [see green-dashed line in Fig. 4(c)], whereas the average background signal, which defines the spatial noise level for this measurement, is 0.023 [see dotted black line in Fig. 4(c)], producing a spatial SNR of 18.1. 4.2.PT Imaging of Isolated AuNPs Test TargetTo test the PT wide-field IPM system sensitivity with an aggregate-free test target, we have used electron-beam lithography to create a target containing groups of different numbers of isolated AuNPs, 40- to 100-nm wide and 40-nm high. In this assessment, we investigated isolated AuNPs groups starting from 1 AuNP, through , , , , , , , , , and up to AuNPs. Figure 5(a) presents a part of the AuNPs groups in this test target as imaged with environmental scanning electron microscope (eSEM), and Fig. 5(b) presents a magnified image of one of the groups ( AuNPs). As verified by eSEM, due to the lithography process limitation on glass substrate, a small part of the AuNPs was lithographed smaller than others. With the elimination of AuNPs aggregates, this approach enabled us to make a more accurate assessment of our detection threshold compliance to the theoretical model. Fig. 5Imaging of a test target created by electron-beam lithography, containing groups of isolated AuNPs, with a different number of AuNPs in each group. (a) An eSEM image of several of the AuNPs groups from the test target. Image contrast is inverted for a better presentation. (b) Enlarged eSEM image of the AuNPs group marked by a circle in (a), containing isolated AuNPs. (c) Black line: PT phase signal as a function of the AuNPs number in the group. Blue-dashed line: the effective the effective detection threshold. Orange-dotted line: the measured detection threshold. Green triangles: the averaged temporal SNR of the PT phase signal as a function of AuNPs number. 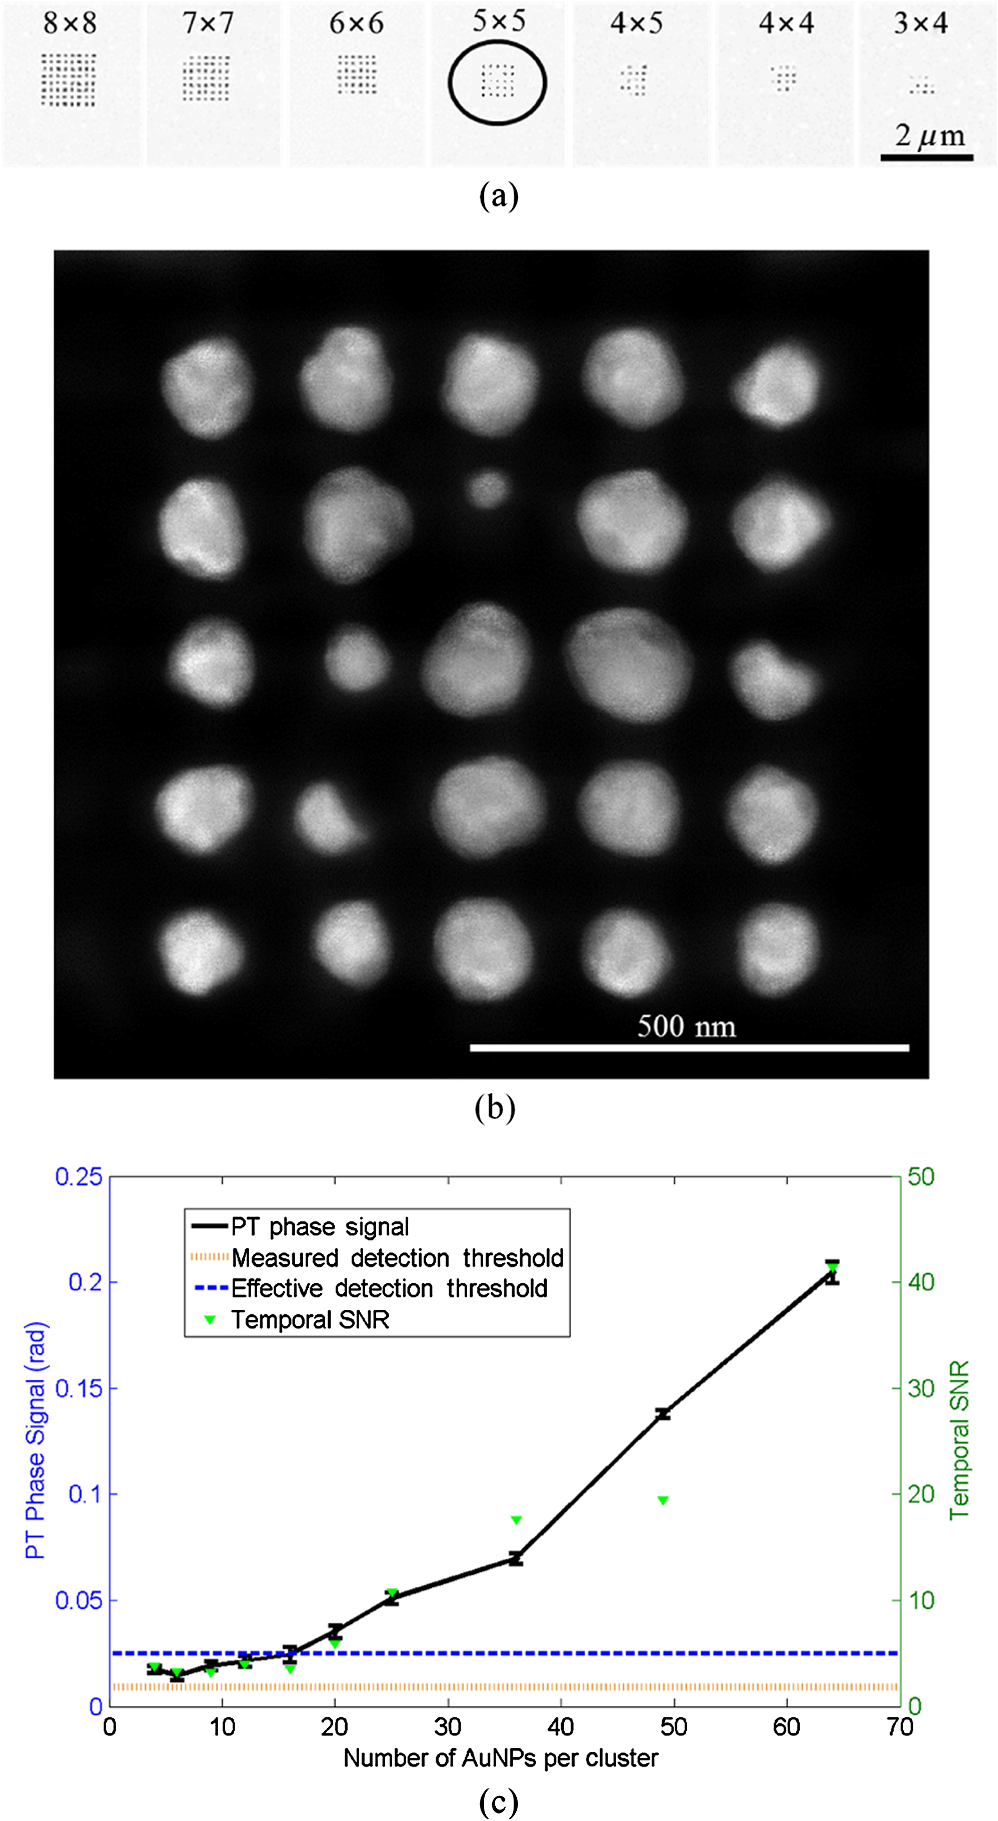 To analyze the results, we define two types of thresholds. The measured threshold is defined as the PT phase signal (as defined in Sec. 3.2) in an area where there are no AuNPs and when the PT excitation is active. When using PT excitation with power density of on the lithographed test target, the measured threshold is 9 mrad, as marked by the dotted orange line in Fig. 5(c). As shown in this figure, according to this threshold definition we have experimentally confirmed that groups of down to 4 AuNPs can be detected. However, since only groups containing 16 AuNPs and more produced a linear relation between the AuNPs number and the PT signal strength, as predicted by Eq. (2), we define another threshold, the effective detection threshold. This threshold is defined as the phase level above which the signal is linearly dependent on the AuNPs number according to Eq. (2). As shown in Fig. 5(c), the effective detection threshold in our case coincides with temporal SNR of 5, and all the groups containing AuNPs are above this threshold. 5.Imaging of Nanoparticles in Biological CellsWe next imaged biological cell samples with AuNPs using the PT wide-field IPM system, and compared the resulting images with images of the same cells obtained by a reflection-based confocal microscope.25 For this experiment, we have synthesized 22-nm AuNPs and then bio-functionalized them to attach to targets of interest in the cell samples. In our case, we functionalized the AuNPs to conjugate to epidermal growth factor receptors (EGFRs), overexpressed on the cell membrane in certain cancer cells. Therefore, we expected the AuNPs to be located mainly upon the cell membrane rather than inside the cell.26 When considering AuNPs conjugation to nonsparse targets in cells, aggregation of AuNPs might be inevitable. For this reason, in this case, one might choose to use smaller AuNPs which, when aggregated, have more stable absorption spectral peaks than larger particles.24 5.1.AuNP Synthesis and BiofunctionalizationColloidal AuNPs were prepared by citrate reduction of in solution.27 About 1.0 mL of 12.7 mM chloroauric acid solution was added to 49.0 mL of deionized water (18 MΩ) in 100.0-mL flask equipped with reflux condenser. The resulting solution was brought to boil while stirring constantly, and then 0.94 mL of 38.8 mM trisodium citrate solution was added quickly. The boiling was continued for several more minutes after the solution developed a rich red color. The nanoparticles have an absorption maximum at 521 nm, hydrodynamic radius of 21.9 nm, as we measured by dynamic light scattering, and average size of , as we measured by transmission electron microscopy. The suspensions were stored at 4°C in the dark in order to keep them from interacting with light. Next, AuNPs were conjugated to the anti-EGFR monoclonal antibodies (host mouse).26 AuNPs and anti-EGFR antibodies were both diluted with 20 mM 4-(2-hydroxyethyl)-1-piperazineethanesulfonic acid buffer separately, and then mixed for 20 min. Poly(ethylene glycol) solution (1%) was then added to the AuNPs dispersion and centrifuged at 6000 rpm for 30 min. After centrifuging, the anti-EGFR/AuNPs pellet was dispersed in phosphate-buffered saline (PBS) buffer and used immediately for immunolabeling, as described in the next section. 5.2.Cell Sample PreparationWe used MDA-MB 468 cell lines, which are known as EGFR-overexpressing () cells. RPMI-1640 (ATCC, Catalog No. 30-2001) medium was supplemented with fetal bovine serum (10%), L-glutamine (2 mM), and penicillin/streptomycin (0.1%). Cells were grown in an incubator keeping an atmosphere with 95% relative humidity, 5% and temperature of 37°C. Cells to be immunolabeled and imaged were grown on glass coverslips in CoverWell™ imaging chambers to approximately 30% confluence. Next, the solution of AuNPs conjugated to was added to the cancer cell culture. The cell culture was incubated with the anti-EGFR/AuNPs solution for 20 min and then rinsed with PBS buffer several times in order to keep AuNPs conjugated upon the cell membrane and to avoid their uptake inside the cells. Afterwards, to enable long measurements of the same cells using both IPM and confocal microscopy, the cells were fixated. To prepare the fixated cell sample, the labeled cells were first rinsed three times with PBS buffer, then fixated with 4% paraformaldehyde solution for 8 min, rinsed twice with PBS buffer, and finally mounted with Fluoromount medium. To ease finding the area of cells on two different imaging systems, a selected area was marked by a grid painted on the coverglass with a permanent pen. 5.3.Experimental SetupsFor PT IPM imaging of AuNP-conjugated cells, we used a oil-immersion objective (Plan-Apochromat with numerical aperture of 1.40, Zeiss). In practice, relatively weak excitation intensities were sufficient to produce significant PT signals. Therefore, the plane-wave excitation beam diameter was set to be and its power was 10 mW, producing a power density of approximately everywhere upon the imaged cell and its surroundings. Similar power densities were used on the previous PT imaging methods.9,10 Theoretically, in order to sample a 30-Hz signal, we should capture at least . We took 1000 full-field frames at a frame rate of , which improved signal clarity. Next, we used a confocal microscope (Leica TCS SP5 II) with a oil-immersion objective to image six layers in the same cell by lateral and axial scanning with movements of . Acquisition time for the entire FOV and all six sections was 50 s. Figure 6 compares the different operation modes of PT wide-field IPM and confocal microscopy, illustrating that the PT IPM signal is additive over the entire sample thickness, whereas confocal microscopy can produce separated slices, but might miss a part of the AuNPs due to great dependency of its axial resolution on the scanning parameters. This will be further discussed in the next section. Fig. 6Schematic comparison between the different operation modes of: (a) PT wide-field IPM and (b) confocal microscopy. MO, microscope objective. On the bottom, schematic illustration of possible AuNP images obtained from the setups. Discrete -scanning layers are denoted by . Each “” image illustrates an scanning of the beam focus across the layer. Blue and red arrows shown in (a) indicate on particles missed by confocal microscopy due to discrete -scanning, but are imaged by PT wide-field IPM, which requires no scanning.  5.4.Experimental Results and DiscussionSeveral cells were imaged with both techniques (PT wide-field IPM and confocal microscopy) for comparison. All measurements showed a good correlation between signal strength and location relative to the cell topography. Figure 7(a) shows several confocal slices of AuNPs attached to EGFRs on a cancer cell, by which we validated that the AuNPs are mainly conjugated to the membrane itself, so that AuNPs inner-cellular uptake is negligible. The cumulative confocal image obtained by summing these slices is shown in Fig. 7(b) in color, overlaying the DIC image of the cell shown in gray scale. Figure 7(c) shows the PT phase image of the AuNPs in the same cell shown in color, overlaying the regular quantitative phase map of the cell shown in gray scale. As shown in these figures, PT wide-field IPM is able to simultaneously yield the regular quantitative phase profile, which is proportional to the optical thickness of the cell per each of the cell spatial points in addition to the AuNPs PT phase signal. On the other hand, the confocal microscope we used was able to yield the qualitative DIC image of the cell in addition to the AuNPs reflection signal. Note that while the confocal reflection-based signal shown in Fig. 7(b) has good lateral resolution, the PT signal from the IPM system shown in Fig. 7(c) seems more spread-out. Fig. 7Imaging of MDA-MB 468 () cancer cell with conjugated AuNPs: (a) Confocal microscopy: six consecutive confocal images of the AuNPs in the cell, from top-left image, representing the bottom of the cell, to bottom-right image, representing the top of the cell, in axial steps of 0.5 μm apart. (b) Confocal plus DIC microscopy: cumulative confocal image of the AuNPs (colored) as obtained by summing the six consecutive confocal images shown in (a), overlaying a DIC image of the same cell (gray scale). (c) PT IPM plus regular IPM: PT phase image of the AuNPs (colored), overlaying a regular wide-field IPM phase image of the same cell (gray scale). (c) Comparison of the phase fluctuations at the excitation frequency with active excitation (green, dashed), representing the PT phase signal, which is almost 2 orders of magnitude larger than the sample ambient fluctuations at the excitation frequency, but when no excitation applied (blue, solid). Graphs shown are along the cell cross-section marked by a white-dashed line in (c). Vertical-dashed lines in (d) represent the cell borders.  Comparison of the relative normalized amplitudes of the two AuNPs-originated signals (PT wide-field IPM versus confocal) yielded 75.6% agreement. These results are explained either by the accumulative phase-signal nature and lack of good sectioning capabilities of PT IPM imaging, and also by the PT signal origin.24 The PT signal is originated in heat transfer from the AuNPs to the environment and as such is more likely to spread unless thermally confined by relatively higher excitation frequencies7 which were far beyond our CMOS camera capabilities, having an acquisition rate of . On the other hand, the confocal signal is originated in a point-like back-reflection source.28 This gives the back-reflection approach a lateral resolution advantage. On the other hand, as shown in Fig. 7(c), IPM generates phase signals which are cumulative along the -axis of the sample. The 2-D signal is therefore comprised of projections of AuNPs PT contributions from the entire three-dimensional volume of the cell at each spatial point. PT IPM has the advantages of acquisition rates and flexibility of objective selection, as it would be able to image thicker transparent samples. We next examined the phase fluctuations at the excitation frequency originated from the sample itself when the excitation is not active. This indicates on our ability to discriminate between the PT phase signal and the ambient cell phase fluctuations at the excitation frequency. Figure 7(d) shows a quantitative comparison between the phase fluctuation levels at the excitation frequency, with excitation (dashed green) and without excitation (blue). As shown in this figure, the fixated cell ambient phase fluctuations at the excitation frequency do not exceed 5 mrad, which is almost 2 orders of magnitude lower than the average of the PT phase signal, 0.22 rad. Therefore, these two signals are easily discriminated. In general, if there are cell biological phenomena which induce significant phase fluctuations at a frequency overlapping with the excitation frequency, the AuNPs excitation frequency can be adjusted to avoid overlap with these phenomena. Note that the discussion above was concerning the fluctuations of the cell at the excitation frequency. In any case, the system is capable of producing PT phase signals that are approximately independent of the actual phase of the sample. This is possible due to the phase signal response to according to Eq. (2), which confines the dependence of the signal on the sample thermal properties, applicable at the excitation frequency only and not on its physical static phase defining the optical thickness of the cell. 6.Discussion and ConclusionsWe presented a new method for PT wide-field imaging of AuNPs that is able to add molecular specificity to wide-field IPM. The method is based on measuring the change in the quantitative phase of the sample originated from the excitation of the AuNPs. We measured the signal sensitivity on an aqueous solution of AuNPs and on a dry isolated AuNPs target created by lithography. We obtained a linear dependency between the PT phase signal and both the excitation power density and the amount of AuNPs, which validated the PT theoretical model. Next, we functionalized AuNPs to attach to EGFRs in cancer cells, imaged them using our system, and compared the results with these obtained by back-reflection imaging of the AuNPs using confocal microscopy. While the confocal microscope had better resolution, our system had higher acquisition rates due to scan-free, wide-field imaging. We used a spatially broad excitation beam for exciting AuNPs in the entire cell volume containing multiple layers. This created a 2-D accumulative map of the AuNPs present in the entire sample volume, while not losing signals due to discrete layer acquisition. Although we used fixated cells to enable long measurements on two imaging systems, the presented method holds great potential in dynamic molecular and cellular imaging of live cells as well. By eliminating the need for transverse and lateral scanning, the time-resolved wide-field signal will be able to track fast cellular processes. AuNPs optical properties (such as the excitation wavelength as well as the scattering and absorption coefficients) are tunable and dependent on the size and shape of the particles.29–31 These properties can be more easily controlled in comparison to other fluorescent and nonlinear labels.32,33 The tunable optical properties of AuNPs allow improved specificity, where different nanoparticles may be bioconjugated to various functional intracellular organelles while imaging all of them simultaneously. Moreover, the wide-field nature of the method allows dynamic imaging at video rates. Future applications may combine multispectral and dynamic molecular imaging of intracellular processes. In contrast to fluorescent labels,32 which are widely used today, AuNPs do not photobleach and remain active as long as they are excited. The heating of the AuNPs is locally confined, and the temperature rise declines quickly as the reciprocal distance from the particle center.8 According to the thermal modeling of previous works,10 for our experiments we evaluate a maximal temperature rise of 1.1 K at the center of the AuNP, which is below the damage threshold of live cells.26,34,35 As we validated in experiments with live cells, the cells indeed survived after this temperature rise. At the current design, aggregates of AuNPs labeling cells are unavoidable. This problem might be solved in the future using AuNPs coating techniques36,37 or using low concentrations of different types of nanoparticles which are excitable by different wavelengths. AcknowledgmentsThis research was supported by a grant from GIF, the German-Israeli Foundation for Scientific Research and Development. ReferencesP. GirshovitzN. T. Shaked,
“Generalized cell morphological parameters based on interferometric phase microscopy and their application to cell life cycle characterization,”
Biomed. Opt. Express, 3
(8), 1757
–1773
(2012). http://dx.doi.org/10.1364/BOE.3.001757 BOEICL 2156-7085 Google Scholar
E. CucheF. BevilacquaC. Depeursinge,
“Digital holography for quantitative phase-contrast imaging,”
Opt. Lett., 24
(5), 291
–293
(1999). http://dx.doi.org/10.1364/OL.24.000291 OPLEDP 0146-9592 Google Scholar
P. K. Jainet al.,
“Review of some interesting surface plasmon resonance-enhanced properties of noble metal nanoparticles and their applications to biosystems,”
Plasmonics, 2
(3), 107
–118
(2007). http://dx.doi.org/10.1007/s11468-007-9031-1 1557-1955 Google Scholar
W. S. Vhanget al.,
“Radiative and nonradiative properties of single plasmonic nanoparticles and their assemblies,”
Acc. Chem. Res., 45
(11), 1936
–1945
(2012). http://dx.doi.org/10.1021/ar200337u ACHRE4 0001-4842 Google Scholar
K. Jakobsohnet al.,
“Towards real-time detection of tumor margins using photothermal imaging of immune-targeted gold nanoparticles,”
Int. J. Nanomed., 7 4707
–4713
(2012). http://dx.doi.org/10.2147/IJN.S34157 IJNNHQ 1178-2013 Google Scholar
V. M. ShalaevS. Kawata, Nanophotonics with Surface Plasmons, 219
–228 Elsevier, Amsterdam and Oxford
(2007). Google Scholar
L. Cognetet al.,
“Single metallic nanoparticle imaging for protein detection in cells,”
Proc. Natl. Acad. Sci. U. S. A., 100
(20), 11350
–11355
(2003). http://dx.doi.org/10.1073/pnas.1534635100 PNASA6 0027-8424 Google Scholar
D. Boyeret al.,
“Photothermal imaging of nanometer-sized metal particles among scatterers,”
Science, 297
(5584), 1160
–1163
(2002). http://dx.doi.org/10.1126/science.1073765 SCIEAS 0036-8075 Google Scholar
M. C. Skalaet al.,
“Photothermal optical coherence tomography of epidermal growth factor receptor in live cells using immunotargeted gold nanospheres,”
Nano Lett., 8
(10), 3461
–3467
(2008). http://dx.doi.org/10.1021/nl802351p NALEFD 1530-6984 Google Scholar
D. C. Adleret al.,
“Photothermal detection of gold nanoparticles using phase-sensitive optical coherence tomography,”
Opt. Express, 16
(7), 4376
–4393
(2008). http://dx.doi.org/10.1364/OE.16.004376 OPEXFF 1094-4087 Google Scholar
Y. Junget al.,
“Three-dimensional high-resolution imaging of gold nanorods uptake in sentinel lymph nodes,”
Nano Lett., 11
(7), 2938
–2943
(2011). http://dx.doi.org/10.1021/nl2014394 NALEFD 1530-6984 Google Scholar
R. V. Kuranovet al.,
“Depth-resolved blood oxygen saturation measurement by dual-wavelength photothermal (DWP) optical coherence tomography,”
Biomed. Opt. Express, 2
(3), 491
–504
(2011). http://dx.doi.org/10.1364/BOE.2.000491 BOEICL 2156-7085 Google Scholar
C. Pacheet al.,
“Fast three-dimensional imaging of gold nanoparticles in living cells with photothermal optical lock-in optical coherence microscopy,”
Opt. Express, 20
(19), 21385
–21399
(2012). http://dx.doi.org/10.1364/OE.20.021385 OPEXFF 1094-4087 Google Scholar
M. Atlanet al.,
“Heterodyne holographic microscopy of gold nanoparticles,”
Opt. Lett., 33
(5), 500
–502
(2008). http://dx.doi.org/10.1364/OL.33.000500 OPLEDP 0146-9592 Google Scholar
E. Absilet al.,
“Photothermal heterodyne holography of gold nanoparticles,”
Opt. Express, 18
(2), 780
–786
(2010). http://dx.doi.org/10.1364/OE.18.000780 OPEXFF 1094-4087 Google Scholar
G. Baffouet al.,
“Thermal imaging of nanostructures by quantitative optical phase analysis,”
ACS Nano, 6
(3), 2452
–2458
(2012). http://dx.doi.org/10.1021/nn2047586 1936-0851 Google Scholar
W. DrexlerJ. G. Fujimoto, Optical Coherence Tomography: Technology and Applications, Springer, New York
(2008). Google Scholar
J. Mertz, Introduction to Optical Microscopy, Roberts & Company, Greenwood Village
(2010). Google Scholar
N. T. Shakedet al., Quantitative Analysis of Biological Cells Using Digital Holographic Microscopy, Holography, Research and Technologies, Intech, New York
(2011). Google Scholar
D. C. GhigliaM. D. Pritt, Two-Dimensional Phase Unwrapping: Theory, Algorithms, and Software, Wiley, New York
(1998). Google Scholar
P. K. Jainet al.,
“Calculated absorption and scattering properties of gold nanoparticles of different size, shape, and composition: applications in biological imaging and biomedicine,”
J. Phys. Chem. B, 110
(14), 7238
–7248
(2006). http://dx.doi.org/10.1021/jp057170o JPCBFK 1520-6106 Google Scholar
U. KreibigL. Genzel,
“Optical absorption of small metallic particles,”
Surf. Sci., 156
(2), 678
–700
(1985). http://dx.doi.org/10.1016/0039-6028(85)90239-0 SUSCAS 0039-6028 Google Scholar
M. QuintenU. Kreibig,
“Optical properties of aggregates of small metal particles,”
Surf. Sci., 172
(3), 557
–577
(1986). http://dx.doi.org/10.1016/0039-6028(86)90501-7 SUSCAS 0039-6028 Google Scholar
S. Berciaudet al.,
“Photothermal heterodyne imaging of individual metallic nanoparticles: theory versus experiment,”
Phys. Rev. B, 73
(4), 045424
(2006). http://dx.doi.org/10.1103/PhysRevB.73.045424 PRBMDO 1098-0121 Google Scholar
C. Xuet al.,
“ dumbbell nanoparticles as dual-functional probes,”
Angew. Chem., Int. Ed. Engl., 47
(1), 173
–176
(2008). http://dx.doi.org/10.1002/(ISSN)1521-3773 ACIEAY 0570-0833 Google Scholar
I. H. El-SayedX. HuangM. A. El-Sayed,
“Selective laser photo-thermal therapy of epithelial carcinoma using anti-EGFR antibody conjugated gold nanoparticles,”
Cancer Lett., 239
(1), 129
–135
(2006). http://dx.doi.org/10.1016/j.canlet.2005.07.035 CALEDQ 0304-3835 Google Scholar
G. Frens,
“Controlled nucleation for the regulation of the particle size in monodisperse gold suspensions,”
Nat. Phys. Sci., 241 20
–22
(1973). http://dx.doi.org/10.1038/physci241020a0 NPAHAX 1745-2473 Google Scholar
J. Pawley, Handbook of Biological Confocal Microscopy, Springer, New York
(2006). Google Scholar
U. KreibigM. Vollmer, Optical Properties of Metal Clusters, Springer, New York
(1995). Google Scholar
A. BrioudeX. C. JiangM. P. Pileni,
“Optical properties of gold nanorods: DDA simulations supported by experiments,”
J. Phys. Chem. B, 109
(27), 13138
–13142
(2005). http://dx.doi.org/10.1021/jp0507288 JPCBFK 1520-6106 Google Scholar
S. LinkM. A. El-Sayed,
“Size and temperature dependence of the plasmon absorption of colloidal gold nanoparticles,”
J. Phys. Chem. B, 103
(21), 4212
–4217
(1999). http://dx.doi.org/10.1021/jp984796o JPCBFK 1520-6106 Google Scholar
J. W. LichtmanJ. A. Conchello,
“Fluorescence microscopy,”
Nat. Methods, 2
(12), 910
–919
(2005). http://dx.doi.org/10.1038/nmeth817 1548-7091 Google Scholar
J. Mertz,
“Nonlinear microscopy: new techniques and applications,”
Curr. Opin. Neurobiol., 14
(5), 610
–616
(2004). http://dx.doi.org/10.1016/j.conb.2004.08.013 COPUEN 0959-4388 Google Scholar
V. K. PustovalovA. S. SmetannikovV. P. Zharov,
“Photothermal and accompanied phenomena of selective nanophotothermolysis with gold nanoparticles and laser pulses,”
Laser Phys. Lett., 5
(11), 775
–792
(2008). http://dx.doi.org/10.1002/lapl.v5:11 1612-2011 Google Scholar
Y. TakedaT. KondowF. Mafune,
“Degradation of protein in nanoplasma generated around gold nanoparticles in solution by laser irradiation,”
J. Phys. Chem. B, 110
(5), 2393
–2397
(2006). http://dx.doi.org/10.1021/jp058204v JPCBFK 1520-6106 Google Scholar
D. J. Javieret al.,
“Aptamer-targeted gold nanoparticles as molecular-specific contrast agents for reflectance imaging,”
Bioconjug. Chem., 19
(6), 1309
–1312
(2008). http://dx.doi.org/10.1021/bc8001248 BCCHES 1043-1802 Google Scholar
Y. Liuet al.,
“Synthesis, stability, and cellular internalization of gold nanoparticles containing mixed peptide-poly(ethylene glycol) monolayers,”
Anal. Chem., 79
(6), 2221
–2229
(2007). http://dx.doi.org/10.1021/ac061578f ANCHAM 0003-2700 Google Scholar
|


