
|
|
1.IntroductionStroke is an important public health issue because it is a leading cause of death and disability. As a result of cerebral infarction, patients suffer severe disabilities such as consciousness disorder, paralysis, and aphasia. In the previous studies on the epidemiology of cerebral ischemia, risk factors such as hypertension, diabetes mellitus, and hypercholesterolemia were reported.1,2 The number of patients with cerebral ischemia has been increasing recently, in accordance with an increase in patients with risk factors. Therefore, the diagnosis and medical treatment of cerebral ischemia are becoming increasingly important. Assessment of cerebral perfusion is essential for the accurate diagnosis and medical treatment of patients with cerebral ischemia. In order to reduce permanent disability, the prevention and early detection of cerebral ischemia are very important. The development of a method for noninvasive and repeated measurement of cerebral perfusion is needed. Conventional methods for the evaluation of cerebral hemodynamics include cerebral catheter angiography,3,4 computed tomography (CT),5,6 magnetic resonance imaging (MRI),7–10 transcranial Doppler (TCD),11,12 single-photon emission computed tomography (SPECT),13,14 and positron emission tomography (PET).15,16 These techniques allow measurement of cerebral perfusion deficits, but they have several limitations. Cerebral catheter angiography is invasive, perfusion CT and MRI require injection of a contrast agent, and SPECT and PET require administration of a radioisotope. Repeated measurement is often difficult because of these limitations. TCD and arterial spin-labeling MRI have been developed as noninvasive in vivo imaging methods. However, with TCD, the measurement area is limited, and the examination is dependent on the skill of the operator. Arterial spin-labeling MRI does not yet have sufficient diagnostic accuracy to be used in clinical practice. All of the aforementioned methods require restraint of the patient. Furthermore, measurements at the bedside cannot be performed, because the equipment required for these examinations (other than TCD) is not portable. In contrast to these conventional methods, near-infrared spectroscopy (NIRS) can continuously measure real-time changes in the concentrations of oxygenated hemoglobin (Oxy-Hb), deoxygenated hemoglobin (Deoxy-Hb), and total hemoglobin (Total-Hb) in cerebral tissue.17–19 Total-Hb is defined as the sum of Oxy-Hb and Deoxy-Hb. We focused on Total-Hb in this article, because changes in Total-Hb indicate changes in cerebral blood volume (CBV) and correlate with regional cerebral blood flow (CBF).20 The basis of this approach is the modified Beer–Lambert law.21–23 This method is suitable for repeated measurement of cerebral perfusion at the bedside, because it is simple, noninvasive, requires minimal patient restraint, has high-temporal resolution, and is portable.24,25 NIRS has been increasingly used in recent years in various clinical fields including neurosurgery, neurology, psychiatry, and rehabilitation.26–29 Although methods have been developed that use NIRS to measure cerebral perfusion,30–32 these methods require improvement, because the measurements were performed using intravenous bolus injection of indocyanine green or oxygen inhalation. Spontaneous oscillations associated with various physiological changes can be observed in the raw data measured by NIRS. Applying a fast Fourier transform (FFT) to the NIRS raw data results in peaks within specific frequency bands of the power spectrum such as the low-frequency oscillation band (), respiratory oscillation band (around 0.2 Hz), and cardiac oscillation band (around 1.0 Hz).33–37 The cardiac oscillation was defined as the pulse wave. In a previous study, Voila et al. showed that the amplitude of the pulse wave was correlated with the changes in CBF in the middle cerebral artery (MCA) territory, and Kwan et al. reported a significant association between cortical perfusion and the pulse wave.38,39 The aim of this article was to develop a method for measuring cerebral perfusion using NIRS and to determine if pulse-wave power could serve as an index of cerebral ischemia. This technique has the potential to measure cerebral perfusion repeatedly and noninvasively at the bedside and does not suffer from the limitations of conventional methods that have been used to evaluate cerebral ischemia. 2.SubjectsTwenty patients with cerebral ischemia (16 men and 4 women; age range 59 to 77 years) participated in this study. In all subjects, a decrease in CBF in the MCA territory was observed on N-isopropyl-p- iodoamphetamine ()-SPECT imaging at rest. A stenosis or an occlusion of the internal carotid artery (ICA) or MCA was observed by cerebral catheter angiography or magnetic resonance angiography (MRA) in all cases, but cerebral infarction in the cerebral cortex of the MCA territory was not observed on MRI in any patient. Furthermore, none of the patients had arrhythmias. The average duration from the detection of vascular lesions by cerebral catheter angiography or MRA to the time of NIRS measurement was 15 weeks. This study was approved by the Ethics Committee of Jichi Medical University, and informed consent was obtained from all subjects. 3.Materials and Methods3.1.Methods of Measurement for NIRSMeasurements were performed on a continuous-wave NIRS system (ETG-4000, Hitachi Medical Corporation, Tokyo, Japan) using two sets of probe arrays (each set had eight light-emitting sources and seven light detectors). In this system, near-infrared light rays with wavelengths of 695 and 830 nm were guided by optical fiber bundles and transmitted into the cranium. Reflections of the near-infrared rays were detected in receiving probes set on the scalp 30 mm away from the transmitting probes.40 In order to measure the changes in concentrations of hemoglobin in the MCA territory, NIRS probes were symmetrically set on the subject’s scalp to cover the bilateral fronto-temporal areas.32 The NIRS signals were measured from 44 positions on the head (22 positions on each side). Measurement positions and covered areas are shown in Fig. 1. The sampling frequency used to extract the pulse-wave component was 10 Hz,35 and each signal was recorded for 60 s. We were not able to obtain a stable waveform of the pulse wave when shorter measuring periods were used. On the other hand, with longer measuring periods, there were no differences in the stability of the pulse waveform. Since there were no advantages in measuring for shorter or longer periods, we recorded for 60 s to ensure a stable waveform. In order to minimize the influence of environmental factors on CBF, the subjects were seated comfortably and continued ordinary breathing during the measurement in a quiet room. 3.2.NIRS Data AnalysisThe raw Total-Hb data [shown in Figs. 2(a) and 2(b)] measured by NIRS were analyzed by the following methods to investigate the changes in regional CBF associated with the cardiac oscillations. The NIRS data were processed using MATLAB R2011b (The MathWorks, Inc., Natick, Massachusetts). Fig. 2Waveform and power spectrum of the near-infrared spectroscopy (NIRS) signals. (a) Time course of raw Total-Hb data measured by NIRS in the resting state and (b) an enlarged view. (c) A fast Fourier transform (FFT) was applied to the Total-Hb data. The peak of the power spectrum is observed at the frequency band of the cardiac oscillation.  Spectral analysis of the Total-Hb signal showed that the peak of the power spectrum associated with the cardiac oscillation was centered around 1.0 Hz, as shown in Fig. 2(c). In order to extract the pulse-wave component, the raw Total-Hb data recorded from each position were band-pass filtered (0.8 to 2.0 Hz) and subjected to FFT to obtain the power spectrum of the pulse wave. In each measuring position, the peak in the power spectrum that was due to the pulse wave was calculated. In all subjects, we confirmed that the peak of the power spectrum associated with cardiac oscillation was within this frequency band. The peak in the power spectrum due to the pulse wave was defined as pulse-wave power. The reason for preprocessing the signals using the band-pass filter was to make it easier to confirm the waveform of the pulse wave. There was no difference between the pulse-wave power values determined with and without preprocessing using the band-pass filter. A contour map (topogram) was drawn using the pulse-wave power at each measuring position. In the topogram, the values between each measuring position were calculated by spline interpolation. 3.3.Evaluation of Cerebral Ischemiawas used to define the ischemic region. The ipsilateral region that had of the counts obtained on the contralateral side was defined as the ischemic region. No attempt was made to define the precise borders of the ischemic region. Thus, we evaluated the pulse-wave power from NIRS channels both within and outside the ischemic region. The mean of all pulse-wave power values on the ipsilateral side was compared with the mean of all pulse-wave power values from symmetrical recording sites on the contralateral side. A Shapiro–Wilk normality test was performed to determine whether the pulse-wave power values were normally distributed. Since not all of the pulse-wave power values had a normal distribution in each patient, the pulse-wave power values were compared between the ipsilateral and the contralateral sides using nonparametric methods. The pulse-wave power values from the two sides in each patient were treated as unpaired groups, and the mean pulse-wave power was compared between the two groups using a Mann–Whitney test. Differences with were considered significant. 4.ResultsThe mean pulse-wave power obtained from all of the NIRS channels on the ipsilateral side that included the ischemic region, as defined by , was significantly lower as compared with the contralateral side. Furthermore, the general location of the ischemic region could also be detected in the topogram of pulse-wave power, and this region was consistent with the ischemic region shown on . Results of all cases of cerebral ischemia are shown in Table 1. The cerebral ischemic side determined by and the mean of pulse-wave power measured by NIRS are shown in this table. In all cases, the side of lower pulse-wave power was consistent with the ischemic side as defined by , and there were significant differences in the pulse-wave power between the two sides in 17 patients (85%). Moreover, in two patients (Table 1: cases 14 and 15), who underwent carotid artery stenting (CAS), the NIRS findings were compared with those of imaging. After CAS, increase in CBF in the ischemic region were observed by both and pulse-wave power. Significant differences in the mean of pulse-wave power between the two sides were not observed after CAS, as shown in Table 1. When the power spectrum of the pulse wave was determined using either the Oxy-Hb or Deoxy-Hb data, the detection rate of cerebral ischemia was inferior compared with Total-Hb. Table 1Clinical features and pulse-wave power data in patients with cerebral ischemia.
R: right, L: left, N: no significant difference.MCA: middle cerebral artery.ICA: internal carotid artery.SPECT: single-photon emission computed tomography.NIRS: near-infrared spectroscopy.CAS: carotid artery stenting.Cerebral ischemic side determined by I123-IMP-SPECT and NIRS and the mean±one standard deviation of pulse-wave power measured by NIRS and P-values of Mann–Whitney U test are shown in the columns. P-values are for the difference between the R and L sides. 4.1.Typical Case of Cerebral Ischemia (Table 1: Case 14)A 65-year-old female patient had severe stenosis in the left cervical ICA that was observed by angiogram [Fig. 3(a)]. A decrease in CBF in the left cerebral hemisphere was observed on imaging [Fig. 3(b)]. CAS was performed in the left cervical ICA [Fig. 3(c)]. An increase in CBF in the left cerebral hemisphere was observed on imaging after CAS [Fig. 3(d)]. Before CAS, the amplitude and the power of the pulse-wave NIRS signals were lower in the ischemic region than those in the contralateral normal region (Fig. 4). This could be seen in the topogram of pulse-wave power [Fig. 5(a)]. The mean pulse-wave power on the ipsilateral side that included the ischemic region was 0.014 compared with 0.037 on the contralateral side (Table 1: case 14-1), and the difference was significant (, Mann–Whitney test). After CAS, the pulse-wave power from a single channel in the ischemic region was increased compared with that seen before CAS (Fig. 6). These findings were confirmed in the topogram [Fig. 5(b)]. The mean of pulse-wave power on the ipsilateral side that included the ischemic region after CAS was 0.027 compared with 0.034 on the contralateral side (Table 1: case 14-2), and the difference was not significant (, Mann–Whitney test). These findings were consistent with the findings. Fig. 3Angiogram and N-isopropyl-p- iodoamphetamine ()-SPECT images before and after carotid artery stenting (CAS). (a) Angiogram shows severe stenosis of the left cervical internal carotid artery (ICA). (b) demonstrates a decrease in cerebral blood flow (CBF) in the left MCA territory before CAS. (c) The ICA was dilated by CAS. (d) demonstrates an increase in CBF in the left MCA territory caused by CAS. 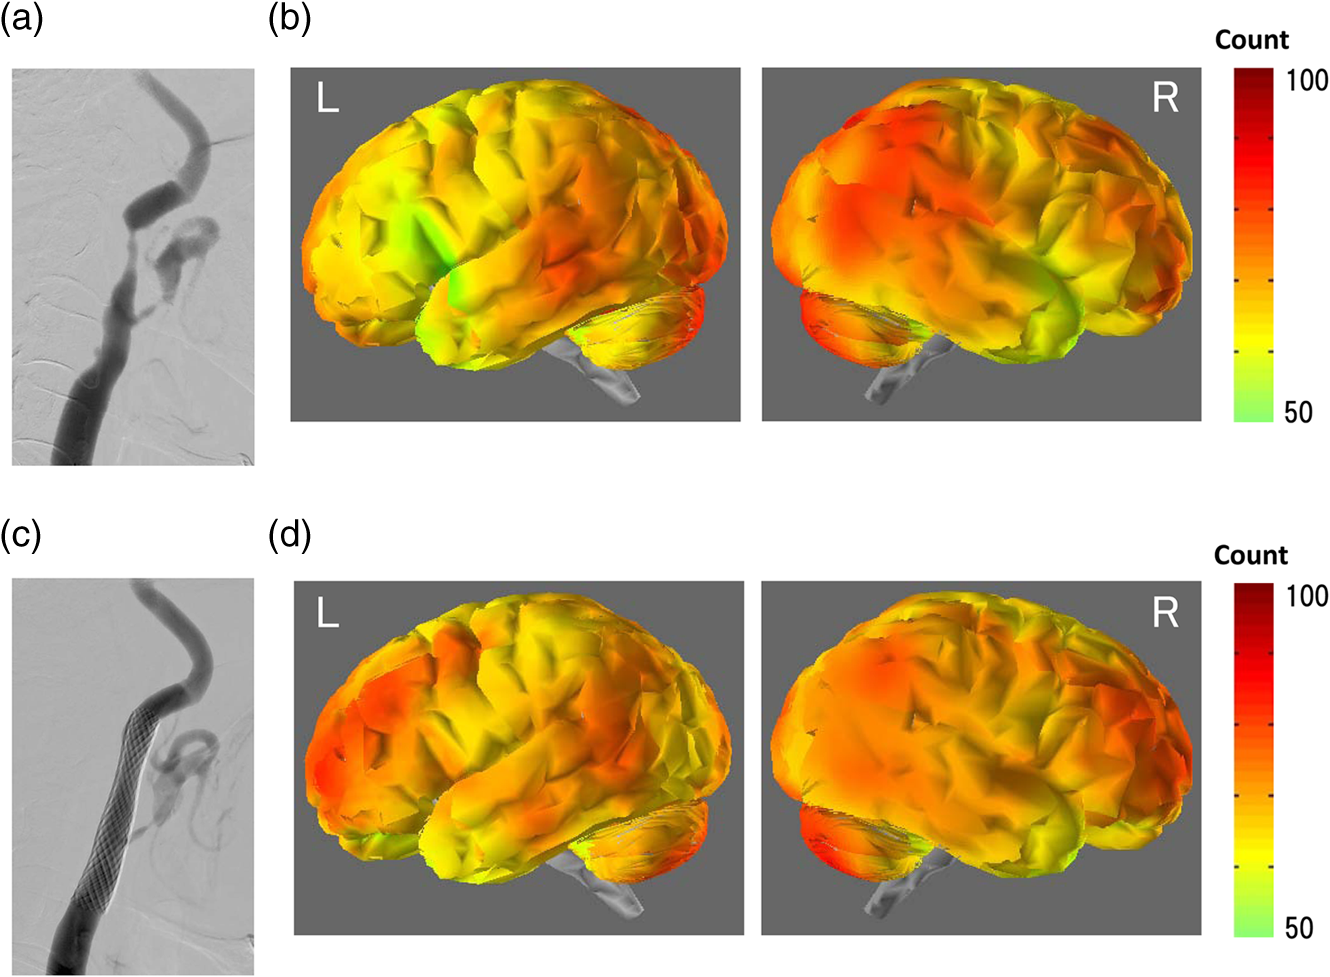 Fig. 4Waveforms and power spectra of the pulse wave (before CAS). (a) Waveforms of pulse wave in the ischemic region and (b) in the contralateral region. (c) Power spectra of pulse wave in the ischemic region and (d) in the contralateral region. The peak in power spectrum of the pulse wave is defined as pulse-wave power. 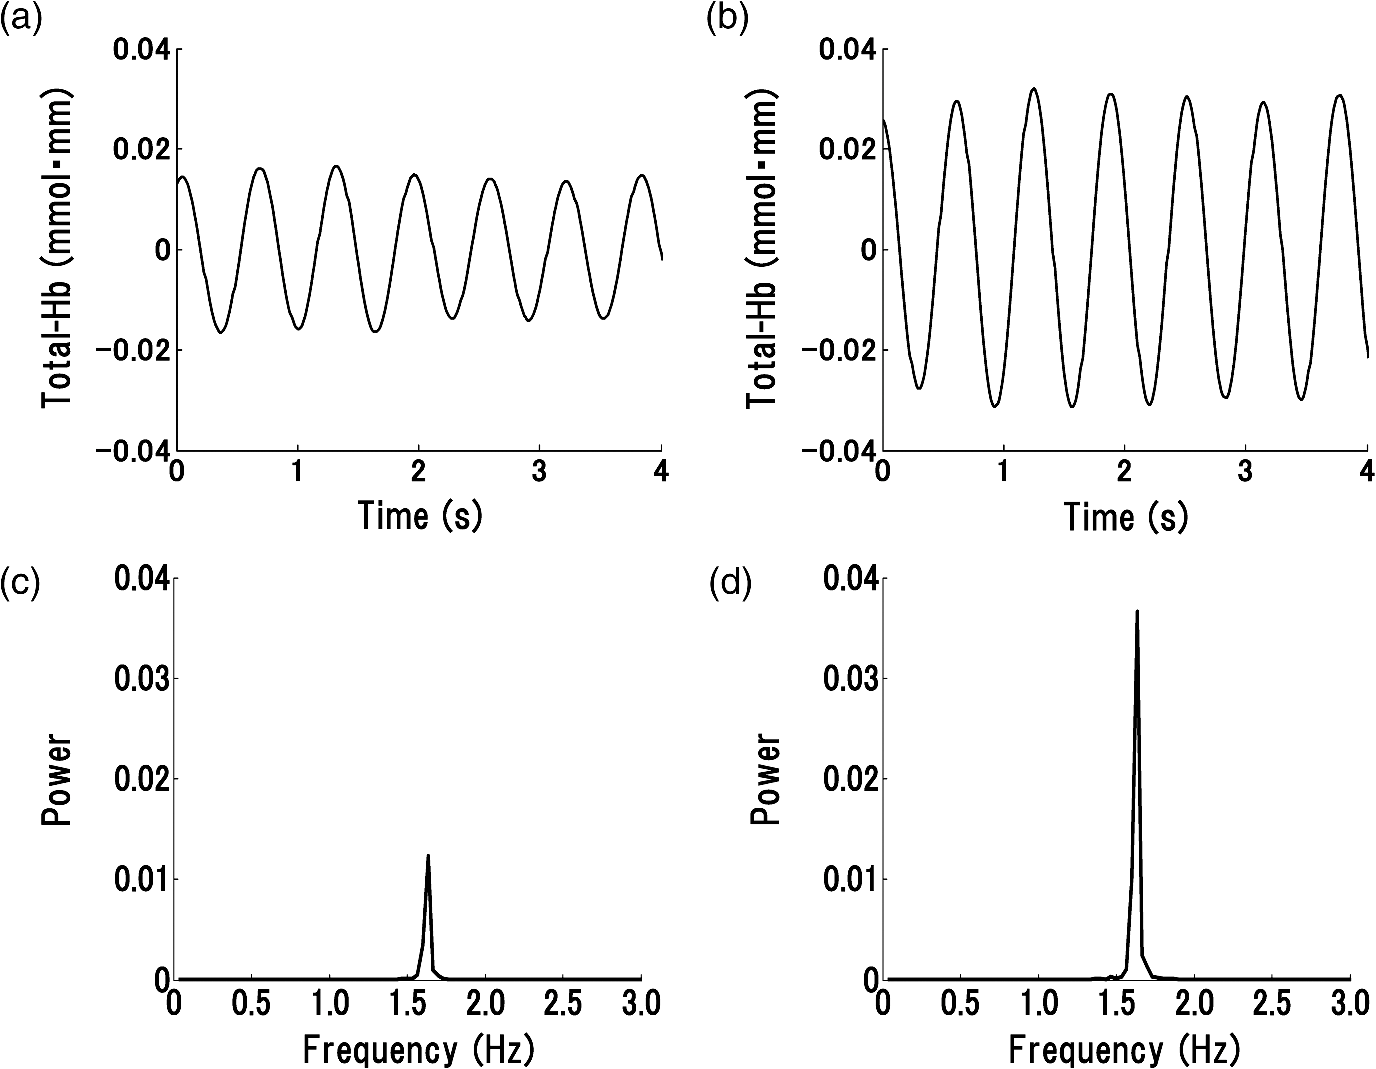 Fig. 5Topogram of pulse-wave power before and after CAS. (a) Lower pulse-wave power in the ischemic region compared with the contralateral region is shown in the topogram before CAS. (b) An increase in pulse-wave power in the ischemic region is shown in the topogram after CAS.  Fig. 6Waveforms and power spectra of pulse wave (after CAS). (a) Waveforms of the pulse wave in the ischemic region and (b) in the contralateral region. (c) Power spectra of the pulse wave in the ischemic region and (d) in the contralateral region.  Figure 7 shows the mean pulse-wave power on the side with cerebral ischemia plotted against the mean pulse-wave power on the contralateral side in all patients with cerebral ischemia. Fig. 7Scatter plot of the mean pulse-wave power. The -axis shows the mean of pulse-wave power on the ischemic side as defined by . The -axis shows the mean of pulse-wave power on the contralateral side. The results of cerebral ischemia are represented by closed circles, and the results after CAS are represented by open circles.  5.DiscussionMeasurement data using NIRS show complex changes in hemoglobin by various physiological factors such as blood pressure, respiration, and brain activity. Information from the pulse wave associated with cardiac oscillations could be obtained by investigating the changes in Total-Hb. Oscillations in the pulse wave measured by NIRS were often considered to be noise and eliminated by filtering. However, advanced signal-processing techniques applied to these oscillations can extract important information about cerebral perfusion. The present study showed that pulse-wave power was lower on the ipsilateral side that included the ischemic region compared with the normal region on the contralateral side. We could not measure the relative change in CBV due to cerebral ischemia, because we had no preischemic NIRS recordings. However, we substituted the NIRS measurements on the nonischemic contralateral side for a baseline, since symmetrical regions on the two hemispheres should have similar pulse-wave power values in the absence of ischemia. Thus, all the measurements on the ipsilateral side were compared with the values on the contralateral side. In all cases of cerebral ischemia, the side with lower pulse-wave power was consistently the ischemic side, as determined by imaging, and significant differences were obtained in 17 of 20 cases. In the cases without significant differences, only a slight CBF reduction was observed on the images. Differences in pulse-wave power were not significant between the two sides, because the decrease in the pulse wave amplitude were small in cases of mild ischemia. Therefore, it was thought that detection of mild ischemia was difficult with the present method. In order to improve the detection accuracy of cerebral ischemia, it will be important to determine the correlation between the decrease in pulse-wave power and the degree of reduction in CBF in different regions. The findings of imaging were compared before and after CAS in two patients in our study. In the regions where CBF was lower than the normal regions before CAS, an increase in CBF was only observed on the ipsilateral side after CAS. In these cases, the pulse-wave power measured by NIRS increased after CAS in the regions where it had been lower than normal before CAS. Increases in the pulse-wave power were consistent with improvements of CBF detected by imaging. Arterial pulsation is caused by cardiac systole, and the pressure pulse is transmitted throughout the arterial network, which results in local expansion of the elastic arterial walls. These local expansions of the arteries cause an increase in light absorption due to an increase in blood volume and consequently a decrease in the light intensity measured by NIRS.38,41 In the ischemic region, the local arterial expansion might be reduced due to the attenuation of arterial pressure caused by a decrease in CBF. Therefore, the pulse-wave power decreased, because the pulse wave oscillations are reduced compared with the normal region. Furthermore, the pulse-wave power increased after CAS, because the transmission of the pulse wave was restored by CAS. It is important to note that there was an unavoidable influence of blood flow to the scalp on pulse-wave power, because the concentration of hemoglobin is measured through the scalp with the NIRS system. A previous study reported that the NIRS system could measure pulse waves that reflected changes in Total-Hb in cerebral tissue associated with the cardiac oscillation, and the amplitude and the power of pulse wave were correlated with changes in CBF.38,39 Moreover, the change in pulse wave amplitude in the MCA territory was highly correlated with the change in CBF measured by TCD.38 In the present study, the improvement of blood flow that followed CAS in two cases was observed mainly in the region of the ICA, and there was little effect on blood flow in the region of the external carotid artery. Therefore, we believe that a change in blood flow through the ICA was mainly responsible for the change in pulse-wave power. In addition, measurement of continuous-wave NIRS is dependent on the modified Beer–Lambert law and includes optical path length as a component in the measured data. The optical path length is known to differ across different head regions. An unknown optical path length was a problem in the analysis of the data, because the true optical path length is difficult to measure by a continuous-wave NIRS system. The spatial variance on one side of the head may include variation due to differences in the optical path length as well as variation due to differences in CBF. Since no attempt was made to define the precise ischemic zone borders, we were not able to correlate the images from different local regions with their corresponding NIRS values recorded on the surface of the head. Also, we do not know the precise brain area registered by each different NIRS channel. However, a previous study showed that the optical path lengths were similar among nearby channels and between homologous regions of the left and right hemispheres within a subject.42 Asymmetry in cerebral hemodynamics between hemispheres due to cardiac oscillations could be detected by continuous-wave NIRS.43 We compared the mean pulse-wave power on the ipsilateral side that included the ischemic region with the mean pulse-wave power from a symmetrical region on the contralateral side of the head. This was done to reduce the influence of differences in optical path lengths at different recording sites. We could not absolutely classify the pulse-wave power recorded in each channel as ischemic or nonischemic. However, the general location of the lower pulse-wave power was similar to the ischemic region defined by imaging. Therefore, we could detect the presence of cerebral ischemia and the general location of the ischemic region using this method. 6.ConclusionsA method of using the power spectrum of the pulse wave measured by NIRS was developed to detect cerebral ischemia. It appeared that pulse-wave power could be a useful index of cerebral ischemia. The present method was clinically useful because we could detect cerebral ischemia repeatedly and noninvasively at the bedside. ReferencesM. Murat SumerO. Erturk,
“Ischemic stroke subtypes: risk factors, functional outcome and recurrence,”
Neurol. Sci., 22
(6), 449
–454
(2002). http://dx.doi.org/10.1007/s100720200004 1590-1874 Google Scholar
A. J. Grauet al.,
“Risk factors, outcome, and treatment in subtypes of ischemic stroke: the German stroke data bank,”
Stroke, 32
(11), 2559
–2566
(2001). http://dx.doi.org/10.1161/hs1101.098524 SJCCA7 0039-2499 Google Scholar
M. Komiyamaet al.,
“Prospective analysis of complications of catheter cerebral angiography in the digital subtraction angiography and magnetic resonance era,”
Neurol. Med. Chir., 38
(9), 534
–540
(1998). http://dx.doi.org/10.2176/nmc.38.534 0470-8105 Google Scholar
T. J. Kaufmannet al.,
“Complications of diagnostic cerebral angiography: evaluation of 19,826 consecutive patients,”
Radiology, 243
(3), 812
–819
(2007). http://dx.doi.org/10.1148/radiol.2433060536 RADLAX 0033-8419 Google Scholar
M. Wintermarket al.,
“Accuracy of dynamic perfusion CT with deconvolution in detecting acute hemispheric stroke,”
AJNR Am. J. Neuroradiol., 26
(1), 104
–112
(2005). Google Scholar
M. W. Parsons,
“Perfusion CT: is it clinically useful?,”
Int. J. Stroke, 3
(1), 41
–50
(2008). http://dx.doi.org/10.1111/ijs.2008.3.issue-1 1747-4930 Google Scholar
L. Ostergaardet al.,
“Absolute cerebral blood flow and blood volume measured by magnetic resonance imaging bolus tracking: comparison with positron emission tomography values,”
J. Cereb. Blood Flow Metab., 18
(4), 425
–432
(1998). http://dx.doi.org/10.1097/00004647-199804000-00011 JCBMDN 0271-678X Google Scholar
H. Endoet al.,
“Quantitative assessment of cerebral hemodynamics using perfusion-weighted MRI in patients with major cerebral artery occlusive disease: comparison with positron emission tomography,”
Stroke, 37
(2), 388
–392
(2006). http://dx.doi.org/10.1161/01.STR.0000199030.37274.88 SJCCA7 0039-2499 Google Scholar
Y. Uchihashiet al.,
“Clinical application of arterial spin-labeling MR imaging in patients with carotid stenosis: quantitative comparative study with single-photon emission CT,”
AJNR Am. J. Neuroradiol., 32
(8), 1545
–1551
(2011). http://dx.doi.org/10.3174/ajnr.A2525 0195-6108 Google Scholar
B. Wuet al.,
“Collateral circulation imaging: MR perfusion territory arterial spin-labeling at 3T,”
AJNR Am. J. Neuroradiol., 29
(10), 1855
–1860
(2008). http://dx.doi.org/10.3174/ajnr.A1259 0195-6108 Google Scholar
A. M. Demchuket al.,
“Specific transcranial Doppler flow findings related to the presence and site of arterial occlusion,”
Stroke, 31
(1), 140
–146
(2000). http://dx.doi.org/10.1161/01.STR.31.1.140 SJCCA7 0039-2499 Google Scholar
Y. Youet al.,
“Detection of the siphon internal carotid artery stenosis: transcranial Doppler versus digital subtraction angiography,”
J. Neuroimaging, 20
(3), 234
–239
(2010). http://dx.doi.org/10.1111/jon.2010.20.issue-3 JNERET 1051-2284 Google Scholar
W. H. KnappR. von KummerW. Kübler,
“Imaging of cerebral blood flow-to-volume distribution using SPECT,”
J. Nucl. Med., 27
(4), 465
–470
(1986). JNMEAQ 0161-5505 Google Scholar
I. Podrekaet al.,
“Quantification of regional cerebral blood flow with IMP-SPECT. Reproducibility and clinical relevance of flow values,”
Stroke, 20
(2), 183
–191
(1989). http://dx.doi.org/10.1161/01.STR.20.2.183 SJCCA7 0039-2499 Google Scholar
R. A. Koeppeet al.,
“Examination of assumptions for local cerebral blood flow studies in PET,”
J. Nucl. Med., 28
(11), 1695
–1703
(1987). JNMEAQ 0161-5505 Google Scholar
J. H. Greenberget al.,
“Validation studies of iodine-123-iodoamphetamine as a cerebral blood flow tracer using emission tomography,”
J. Nucl. Med., 31
(8), 1364
–1369
(1990). JNMEAQ 0161-5505 Google Scholar
F. F. Jöbsis,
“Noninvasive, infrared monitoring of cerebral and myocardial oxygen sufficiency and circulatory parameters,”
Science, 198
(4323), 1264
–1267
(1977). http://dx.doi.org/10.1126/science.929199 SCIEAS 0036-8075 Google Scholar
T. Yamamotoet al.,
“Development and application of noninvasive optical topography,”
Proc. SPIE, 4082 24
–33
(2000). http://dx.doi.org/10.1117/12.390538 PSISDG 0277-786X Google Scholar
E. M. Hillman,
“Optical brain imaging in vivo: techniques and applications from animal to man,”
J. Biomed. Opt., 12
(5), 051402
(2007). http://dx.doi.org/10.1117/1.2789693 JBOPFO 1083-3668 Google Scholar
W. LichtyK. SakataniaH. Zou,
“Application of near-infrared spectroscopy to investigate brain activity: clinical research,”
Proc. SPIE, 4082 34
–39
(2000). http://dx.doi.org/10.1117/12.390548 PSISDG 0277-786X Google Scholar
A. VillingerB. Chance,
“Non-invasive optical spectroscopy and imaging of human brain function,”
Trends Neurosci., 20
(10), 435
–442
(1997). http://dx.doi.org/10.1016/S0166-2236(97)01132-6 TNSCDR 0166-2236 Google Scholar
M. Copeet al.,
“Methods of quantitating cerebral near infrared spectroscopy data,”
Adv. Exp. Med. Biol., 222 183
–189
(1988). http://dx.doi.org/10.1007/978-1-4615-9510-6 AEMBAP 0065-2598 Google Scholar
A. Makiet al.,
“Spatial and temporal analysis of human motor activity using noninvasive NIR topography,”
Med. Phys., 22
(12), 1997
–2005
(1995). http://dx.doi.org/10.1118/1.597496 MPHYA6 0094-2405 Google Scholar
E. Watanabeet al.,
“Non-invasive functional mapping with multi-channel near infra-red spectroscopic topography in humans,”
Neurosci. Lett., 205
(1), 41
–44
(1996). http://dx.doi.org/10.1016/0304-3940(96)12376-4 NELED5 0304-3940 Google Scholar
K. Isobeet al.,
“Functional imaging of the brain in sedated newborn infants using near infrared topography during passive knee movement,”
Neurosci. Lett., 299
(3), 221
–224
(2001). http://dx.doi.org/10.1016/S0304-3940(01)01518-X NELED5 0304-3940 Google Scholar
E. Watanabeet al.,
“Noninvasive cerebral blood volume measurement during seizures using multichannel near infrared spectroscopic topography,”
J. Biomed. Opt., 5
(3), 287
–290
(2000). http://dx.doi.org/10.1117/1.429998 JBOPFO 1083-3668 Google Scholar
R. P. Kannanet al.,
“Non-invasive assessment of language lateralization by transcranial near infrared optical topography and functional MRI,”
Hum. Brain Mapp., 16
(3), 183
–189
(2002). http://dx.doi.org/10.1002/(ISSN)1097-0193 HBRME7 1065-9471 Google Scholar
K. Matsuoet al.,
“Alteration of hemoglobin oxygenation in the frontal region in elderly depressed patients as measured by near-infrared spectroscopy,”
J. Neuropsychiatry Clin. Neurosci., 12
(4), 465
–471
(2000). http://dx.doi.org/10.1176/appi.neuropsych.12.4.465 0895-0172 Google Scholar
P. M. ArenthJ. H. RickerM. T. Schultheis,
“Applications of functional near-infrared spectroscopy (fNIRS) to neurorehabilitation of cognitive disabilities,”
Clin. Neuropsychol., 21
(1), 38
–57
(2007). http://dx.doi.org/10.1080/13854040600878785 CLNEEC 0920-1637 Google Scholar
W. M. Kuebleret al.,
“Noninvasive measurement of regional cerebral blood flow by near-infrared spectroscopy and indocyanine green,”
J. Cereb. Blood Flow Metab., 18
(4), 445
–456
(1998). http://dx.doi.org/10.1097/00004647-199804000-00013 JCBMDN 0271-678X Google Scholar
C. Terborget al.,
“Bedside assessment of cerebral perfusion reductions in patients with acute ischemic stroke by near-infrared spectroscopy and indocyanine green,”
J. Neurol. Neurosurg. Psychiatry, 75
(1), 38
–42
(2004). JNNPAU 0022-3050 Google Scholar
A. Ebiharaet al.,
“Evaluation of cerebral ischemia using near-infrared spectroscopy with oxygen inhalation,”
J. Biomed. Opt., 17
(9), 96002
(2012). http://dx.doi.org/10.1117/1.JBO.17.9.096002 JBOPFO 1083-3668 Google Scholar
C. E. Elwellet al.,
“Oscillations in cerebral haemodynamics. Implications for functional activation studies,”
Adv. Exp. Med. Biol., 471 57
–65
(1999). http://dx.doi.org/10.1007/978-1-4615-4717-4 AEMBAP 0065-2598 Google Scholar
H. Obriget al.,
“Spontaneous low frequency oscillations of cerebral hemodynamics and metabolism in human adults,”
Neuroimage, 12
(6), 623
–639
(2000). http://dx.doi.org/10.1006/nimg.2000.0657 NEIMEF 1053-8119 Google Scholar
T. Katuraet al.,
“Quantitative evaluation of interrelations between spontaneous low-frequency oscillations in cerebral hemodynamics and systemic cardiovascular dynamics,”
Neuroimage, 31
(4), 1592
–1600
(2006). http://dx.doi.org/10.1016/j.neuroimage.2006.02.010 NEIMEF 1053-8119 Google Scholar
Y. TongB. D. Frederick,
“Time lag dependent multimodal processing of concurrent fMRI and near-infrared spectroscopy (NIRS) data suggests a global circulatory origin for low-frequency oscillation signals in human brain,”
Neuroimage, 53
(2), 553
–564
(2010). http://dx.doi.org/10.1016/j.neuroimage.2010.06.049 NEIMEF 1053-8119 Google Scholar
Y. TongK. P. LindseyB. de Frederick,
“Partitioning of physiological noise signals in the brain with concurrent near-infrared spectroscopy and fMRI,”
J. Cereb. Blood Flow Metab., 31
(12), 2352
–2362
(2011). http://dx.doi.org/10.1038/jcbfm.2011.100 JCBMDN 0271-678X Google Scholar
S. Violaet al.,
“Correlation between the arterial pulse wave of the cerebral microcirculation and CBF during breath holding and hyperventilation in human,”
Clin. Neurophysiol., 123
(10), 1931
–1936
(2012). http://dx.doi.org/10.1016/j.clinph.2012.03.017 CNEUFU 1388-2457 Google Scholar
H. C. Kwanet al.,
“Human cortical perfusion and the arterial pulse: a near-infrared spectroscopy study,”
BMC Physiol., 4
(7),
(2004). http://dx.doi.org/10.1186/1472-6793-4-7 BPMHCV 1472-6793 Google Scholar
H. Satoet al.,
“Practicality of wavelength selection to improve signal-to-noise ratio in near-infrared spectroscopy,”
Neuroimage, 21
(4), 1554
–1562
(2004). http://dx.doi.org/10.1016/j.neuroimage.2003.12.017 NEIMEF 1053-8119 Google Scholar
G. Themeliset al.,
“Near-infrared spectroscopy measurement of the pulsatile component of cerebral blood flow and volume from arterial oscillations,”
J. Biomed. Opt., 12
(1), 014033
(2007). http://dx.doi.org/10.1117/1.2710250 JBOPFO 1083-3668 Google Scholar
A. Katagiriet al.,
“Mapping of optical pathlength of human adult head at multi-wavelengths in near infrared spectroscopy,”
Adv. Exp. Med. Biol., 662 205
–212
(2010). http://dx.doi.org/10.1007/978-1-4419-1241-1 AEMBAP 0065-2598 Google Scholar
S. Muehlschlegeet al.,
“Feasibility of NIRS in the neurointensive care unit: a pilot study in stroke using physiological oscillations,”
Neurocrit. Care, 11
(2), 288
–295
(2009). http://dx.doi.org/10.1007/s12028-009-9254-4 1541-6933 Google Scholar
|
|||||||||||||||||||||||||||||||||||||||||||||||||||||||||||||||||||||||||||||||||||||||||||||||||||||||||||||||||||||||||||||||||||||||||||||||||||||||||||||||||||||||||||||||||||||||||||||||||||||||||||||||||||||


