
|
|
1.IntroductionOptical coherence tomography (OCT) is a depth-resolved, high-resolution, noninvasive imaging technique that employs low-coherence interferometry to record the intensity of light backscattered from a turbid sample. The OCT technique was originally meant for imaging human retinas,1 but its applications have since been widely expanded to encompass medical treatments and characterization of materials. In comparison with the conventional OCT, which entails merely depth-resolved structural images, the polarization-sensitive OCT (PS-OCT) can yield far more information on the phase retardation (PR) and fast-axis (FA) orientation of birefringence within the samples.2–6 Over the past two decades, several approaches have been devised to gather depth-resolved birefringence data with PS-OCT. In Ref. 7, Yamanari et al. performed various analyses of the PS-OCT techniques proposed. Most of these, whether in the time domain or the Fourier domain (FD), first utilize a bulk optics lens for the construction of the PS-OCT before catering to the fiber optics deployment by means of flexible light-circuit layout. Such conventional fiber-based PS-OCT systems typically employ either the Mueller matrix or the Stokes vector to discern the changes in polarization on the Poincaré sphere.8–12 Bulk optics-type PS-OCTs with circularly polarized incident light have also been widely reported in the literature. Such systems enable the simultaneous measurement and imaging of the backscattered intensity, PR, and FA with only a single A-scan per transverse measurement location, thereby vastly reducing the measurement time and sensitivity to sample movements. Recently, several polarization-maintaining (PM) fiber-based FD PS-OCTs have been demonstrated for birefringence measurement.13–17 In these instances, either multiple input states are again required or a single linearly polarized state will need to be used with the sample arm equipped with a quarter-wave plate (QWP) in free space to produce circularly polarized incident light. However, a bulk optics system consisting of a sample arm with free space is patently unwieldy as far as endoscopic applications are concerned. In this study, we propose a circular-state (CS) swept source (SS) PS-OCT. By means of the proposed calibration scheme, bulk optics QWPs can be replaced by fiber optics polarization controllers (PC) to, therefore, realize an all fiber optics CS SSPS-OCT, which can thereafter serve as a technology for realizing PS-OCT instruments for clinical applications. The fiber optics components we used were all sourced directly from the market of fiber optics communications, except for the laboratory-made fiber optics PC acting as QWPs. We also present a numerical dispersion compensation method, which can simultaneously compensate for the dispersion mismatch between the two arms of the interferometer. An automatic iterative optimization method for dispersion compensation in the CS SSPS-OCT images is also presented. The method can not only enhance the axial resolution but also improve the signal-to-noise ratio (SNR) of the CS SSPS-OCT. For performance verification of the proposed CS SSPS-OCT, a Berek’s polarization compensator (BPC) placed in front of a mirror was used as a standard sample. Considering the sample arm, fiber probe is in motion during acquisition of an image (i.e., for endoscopy based applications using linear and rotary scanning probe), we then investigated the influence of the measured PR and FA due to probe with a linear motion, twist angles, and bends before demonstrating in vivo images of the human fingertip and nail. 2.Method2.1.Principles and SetupThe schematic of the proposed CS SSPS-OCT is shown in Fig. 1. The light source was a 16 kHz swept laser with a center wavelength at 1325 nm, an average output of 10 mW, and 3-dB spectral bandwidth of 100 nm. A fraction of the laser power was coupled to the input ports of a Mach–Zehnder interferometer (MZI), which was used to resample the interference signals in real time for equal spacing in the frequency prior to the application of the fast Fourier transform algorithm. A fiber optics PC-1 in between a light source and a fiber optics polarizer fused with fiber pigtails was used to maximize the output power of the linearly polarized light. The extinction ratio of the PC was greater than 30 dB, more than sufficient for obtaining a purely linear state of polarization. Next to the polarizer, a PM fiber optics circulator was used to guide the light to a fiber optics Michelson interferometer to circulate the reflected light from the interferometer to a fiber optics polarization beam splitter (PBS). A PM fiber coupler with a coupling ratio of was arranged to split the light power into the two fiber arms of the interferometer, 50% for the reference arm and 50% for the sensing arm. Fig. 1Schematic layout of the circular-state (CS) swept source polarization-sensitive optical coherence tomography (SSPS-OCT) system constructed entirely from fiber optics components. MZI, Mach–Zehnder interferometer; PC, polarization controller; PM, polarization-maintaining; PBS, polarization beam splitter; BD, balanced detector; A/D converter, analog-to-digital converter.  The SS light source was polarized at the FA of the PM fiber in accordance with the laboratory coordinate vector . After propagating through the PC-1 and circulator, the linearly polarized light was split at the PM coupler and then propagated along the -axis of the PM delay fibers of both arms. In the traditional bulk optics-type CS PS-OCT,2,3,6 a QWP oriented at 45 deg to the -axis is frequently employed in the sensing arm to generate a circularly polarized incident light. In this article, our proposed scheme utilizes the PC-2 as a fiber optics QWP to generate circularly polarized lights via proper polarization control. Thus, the sensing arm of our proposed CS SSPS-OCT was constructed with a low birefringence fiber as a leading fiber to maintain the CS of the incident light, a gradient index lens, and a 45 deg prism mirror to guide and focus the light upon the samples to be measured. Two-dimensional (2-D) OCT imaging was performed by linearly scanning the sensing probe with a translational motorized stage. In the reference arm, we properly adjusted PC-3 to act as a QWP oriented at 22.5 deg to the -axis. Next to the PC-3, the fiber collimator was integrated with a fiber mirror as the end mirror of the reference arm to reflect the light back to the PC-3. The light reflected from the measured sample and the end mirror of the reference arm to the PC-2 and PC-3, respectively, would be converted into two linearly orthogonal modes, which would then propagate through the respective axes of the PM delay fiber back to the PM coupler. Thus, the linearly orthogonal modes would interfere with each corresponding mode if the respective coherent condition was fulfilled. These orthogonal interference signals were polarization-maintained all the way from the coupler to the beam splitter via the circulator due to the use of the PM fiber pigtailed devices. Herein, the reflected light propagating backward through the PM coupler and PM circulator would exhibit a phase shift of and be guided to the two PBS, which then split the interference beams onto two balanced photodetectors (BD1 and BD2). The balanced detection would double the signal and minimize the common excess noise. Finally, the fringe signals (including the horizontal and vertical polarization channels) from the OCT interferometer, and the output of the MZI were simultaneously recorded by a high speed analog-to-digital (A/D) converter operating at with the 14-bit resolution (AlazarTech, Model ATS9440). 2.2.Signal ProcessingFigure 2 shows a flow chart for the post-processing steps. First, each individual record from the sample signal was resampled to an equidistant spacing in the frequency. Subsequently, the fringe signal was obtained by subtracting the background signal from the reference arm. (The sample arm was blocked at the beginning of the OCT scan, after which this fringe was subtracted from every fringe signal captured during the imaging.) After apodization18 to calibrate the spectrum sidelobes, we applied numerical compensation for the dispersion mismatch between the two arms of the interferometer. For clarification, the A-scan signal obtained by inverse Fourier transform of the acquired fringe data can be expressed as where and denote the horizontal and the vertical polarization channels, respectively. is the sample reflectivity, while both the and terms are retardation moduli modulated by the birefringence of the measured samples. The phase difference (i.e., ) between the two fringes contains information on the FA angle (i.e., ) of the birefringence within the measured samplesDispersion arises from the frequency dependence of the propagation constant on the material in the interferometer arms. For optimal resolution in OCT imaging, the dispersion mismatch between the reference and sample arms must be compensated. If the light in the sample arm of the OCT system propagates through a length of dispersive material that is not matched by a similar material in the reference path, a frequency-dependent phase shift will result, meaning that the fringes will be multiplied by a nonlinear phase prior to Fourier transforming in both Eqs. (1) and (2) and thus result in a loss of the axial resolution. In PS-OCT with a free space bulk system, the dispersion mismatch between the sample and reference arms can be easily compensated by using identical lengths of identical optical materials. In our all fiber optics CS SSPS-OCT, we present a numerical dispersion compensation method to remove the -dependent nonlinear phase. The compensated signal is calculated from multiplying the signal by a phase correction term where is the phase correction function. The phase correction function will cancel out the group velocity dispersion, third-order dispersion, and high-order dispersions in the interference signal. Finally, the axial depth scan can be obtained by performing Fourier transformation on the compensated signal. In order to determine the optimal phase correction function, the algorithm automatically adjusted for and high-order coefficients in Eq. (5) to maximize the sharpness metric function19 encompassed in by the Nelder–Mead simplex method.20 The sharpness function measures the concentration of the signal and is given asThe integration range for the sharpness function is set to be the depth near the interface between the air and the sample at which the magnitude of the interference signal is usually the largest. Since, there exists a different propagation velocity in the two orthogonal modes of the PM fiber, the phase shifts cannot cancel out each other if there is a length difference between the PM fibers in the reference arm and the sample arm. In this case, the resulting coherence functions of the two polarization detection channels are not at the same depth position. This mismatch also destroys the image resolution. Thus, in the next step, the PM fiber length mismatch was compensated by automatically adjusting the coefficients of either the horizontal or the vertical polarization channels only. It is iteratively adapted until the integration between and reaches maxima, implying that the two coherence functions of the vertical and horizontal components are exactly depth matched. The integration function is calculated as Once the optimal phase correction function had been obtained, the correction function could be applied to each A-line scan to reconstruct a 2-D image. After compensation, the amplitude and phase of the interference signals were used to calculate the reflectivity (R), the PR (), and the FA () as prescribed for the traditional bulk optics-type CS PS-OCT.2,3,6 3.Results and Discussions3.1.System CharacterizationIn this section, we proceed to perform a number of characterization experiments by using the CS SSPS-OCT to measure a BPC placed in front of a mirror as a standard sample to verify the system performance. Before using our CS SSPS-OCT to capture the birefringence data, we proposed three calibration steps for adjusting the polarization states of the PC to mirror the same conditions in conventional bulk optics PS-OCT.
Figure 3(a) shows the coherence function in the horizontal polarization channel of the CS SSPS-OCT system at a depth of around 900 μm, which is the optical path length difference between the sample and reference arms. Although we have increased the length of the PM fiber (between the reference and sample arms) to about 2 m in order to remove the cross talk between the two polarized orthogonal modes emerging from imperfect fiber points and components, some undesirable noises larger than the depth of 2.5 mm nonetheless still exist. After the reference subtraction, these fixed noises were noticeably suppressed. One can also observe the broad sidelobes of the signals suppressed by apodization using a hamming window. Figure 3(b) shows the coherence functions of both the horizontal and vertical polarization channels after apodization processing but before the numerical compensation of the dispersion. One can see that the resolution was about 35 μm; besides, the two coherence functions appeared at different depth positions. After the compensation procedure, these two peaks appeared at exactly the same depth position as shown in Fig. 3(c). The axial resolution for our measured results at this location was 16 μm, in sound agreement with the theoretical value. This dispersion compensation procedure also resulted in a 5 dB improvement on the SNR of the CS SSPS-OCT, which can be proved by comparing Figs. 3(b) and 3(c). As for confirmation of the lateral resolution, we used a 1951 USAF resolution test chart (Edmund Optics) as the standard resolution test sample. The pattern consists of a group of three bars with dimensions ranging from large to small. As shown in Fig. 3(d), 2-D OCT imaging was performed by linearly scanning the sensing probe. The largest bar that the imager was unable to discern constituted the limitation of its resolving power, confirming that the lateral resolution of our probe was around 15.6 μm. Fig. 3Coherence functions of the CS SSPS-OCT. (a) Black trace shows the raw data in the horizontal polarization channel. The red, blue, and green traces were obtained after the reference subtraction, reference subtraction in addition to apodization, and reference subtraction in addition to apodization and dispersion compensation, respectively. (b) Coherence functions in the horizontal and vertical polarization channels of the raw data. (c) Coherence functions in the horizontal and vertical polarization channels after the reference subtraction in addition to apodization and dispersion compensation. (d) CS SSPS-OCT images of a 1951 USAF resolution test chart.  To test the system sensitivity for reflectivity measurement as a function of the ranging depth, a mirror and an attenuator (neutral density filter) were used to mimic a sample. Figure 4 shows the depth-dependent decay (logarithmic scale) for the mirror at different depths, where the measured SNR in dB was calculated to be 20 times the base 10 logarithm of the ratio of the A-scan peak height to the mean noise floor. Adding the calibrated 65-dB value for the sample arm attenuation to the system SNR, we achieved a sensitivity of for the peaks within 2.5 mm. The axial resolution measured at 2.5 mm degraded to 23 μm in air. For verification of the birefringence measurements, a BPC was set at various tilt angles for the retardation set step, increasing from 0 to 180 deg at 15-deg intervals. Measurements were repeated five times in every step of the retardation setting. The measured PR, as shown in Fig. 5(a), indicated that the good linearity was accompanied by small standard deviations in the diagram. Based on the three calibration steps, if the theoretical criteria of the PS-OCT mentioned in the last section are fulfilled by the PC, the PR measurements become irrelevant to the FA orientations. The trial measurements were performed to verify this assumption. The PR measurements were repeated for a set retardation close to 45 deg at each FA orientation step, increasing from 0 to 180 deg at 30-deg intervals. The experimental results in Fig. 5(b) indicated that the PR measurements were irrelevant to the FA orientations, thereby proving that the PC-2 and PC-3 exhibited equal effects from the bulk optics QWPs. The experimental results, as shown in Figs. 5(a) and 5(b), suggested that the measured PR and FA orientations were in agreement with the set values and exhibited a good linear response with small standard deviations. The PR measurement in this calibrated test plate indicated that the average systematic error was 1.5 deg, and that the largest deviations were 2.9 deg near and 90 deg. Based on other reports using the same test plate, Roth et al.21 extracted the birefringence properties through illumination of the sample with at least three separate polarization states during consecutive acquisitions of the same A-scan. The experiment revealed an average error of 7.5 deg in the BPCs’ PR measurements. In relation to the FA measurement, the mean absolute deviation of 3.2 deg and largest deviation of 7.6 deg obtained using our approach were smaller than the 9.4 and 15.3 deg reported in other articles.6,21 3.2.Effect of Sample Arm Fiber Probe with a Linear Motion, Twist Angles, and BendsWhile we have shown that our all fiber optics CS SSPS-OCT system works well with a stationary setup, considering that the sample arm fiber probe is in motion during acquisition of an image (i.e., for endoscopy based applications using linear and rotary scanning probe), we then investigated the influence of the measured PR and FA due to probe with a linear motion, twist angles, and bends. To investigate this effect, we performed experiments in which a BPC in front of a mirror was once again used as the test sample. First, the probe was linearly scanned from 0 to 6 mm with the translation stage at a velocity of . Second, in order to simulate a rotary scanning probe suffering from the fiber-twisting effect, we fixed a length of probe fiber to a rotation stage which then continuously rotated the fiber within 65 deg at a velocity of . Finally, we fixed a length of probe fiber to a translation stage and then bended the probe horizontally within 60 deg. Thereafter, we analyzed the changes in the PR and FA when the probe has a linear motion, twist angles, and bends, as shown in Figs. 6(a), 6(b) and 6(c), respectively. Measurements of the linear motion indicated that the largest deviation of PR and FA were 3.2 and 7.1 deg, respectively, when the linear scanning speed was and the scanning range was within 6 mm. Changes in the PR and FA due to the twist stress were smaller than 2.1 and 5.5 deg, respectively, when the fiber’s rotation range was smaller than 65 deg at a velocity of . The largest deviations of the PR due to probe bending (i.e., the bending angles smaller than 60 deg) were 3.5 deg, however, the measured FA changed by to 21 deg. 3.3.In Vivo Biological ImagingFigure 7 is an in vivo image of a human fingertip, in which the reflectivity image [Fig. 7(a)] reveals several structures, including the dermis and epidermis of this skin region. The retardation image [Fig. 7(b)] displays the PR values in color coding from 0 (blue) to 90 deg (red). If the sample was nonbirefringent, no PR was observed (0 deg, blue). A value of 90 deg (red) corresponded to a phase lag of a quarter wavelength between the two orthogonal polarization directions due to birefringence. Also, images of the FA orientation [Fig. 7(c)] were displayed as color-coded from 0 deg (blue) to 180 deg (red). The dermis layers in the human fingertip were birefringent due to the presence of collagen, whereas the sweat gland (white arrows) was not birefringent or exhibited just a slightly increasing PR [Fig. 7(b)] with the depth and a well-defined FA [Fig. 7(c)]. Finally, we demonstrate an in vivo measurement of a human nail. Figure 8 shows the R image (a), PR plot (b), and FA orientation (c). We can easily identify the birefringent effects within the dermis as well as the birefringent lower half of the nail plate (white arrows). Fig. 7In vivo CS SSPS-OCT images of a human fingertip. (a) Reflectivity image. (b) Retardation image. (c) Image of the FA orientation. White arrows denote the sweat glands.  Fig. 8In vivo CS SSPS-OCT images of a human nail fold. (a) Reflectivity image: a, epidermis; b, dermis; c, cuticle; d, nail plate; and e, nail bed. (b) Retardation image. (c) Image of the FA orientation. White arrows denote the birefringent layers. 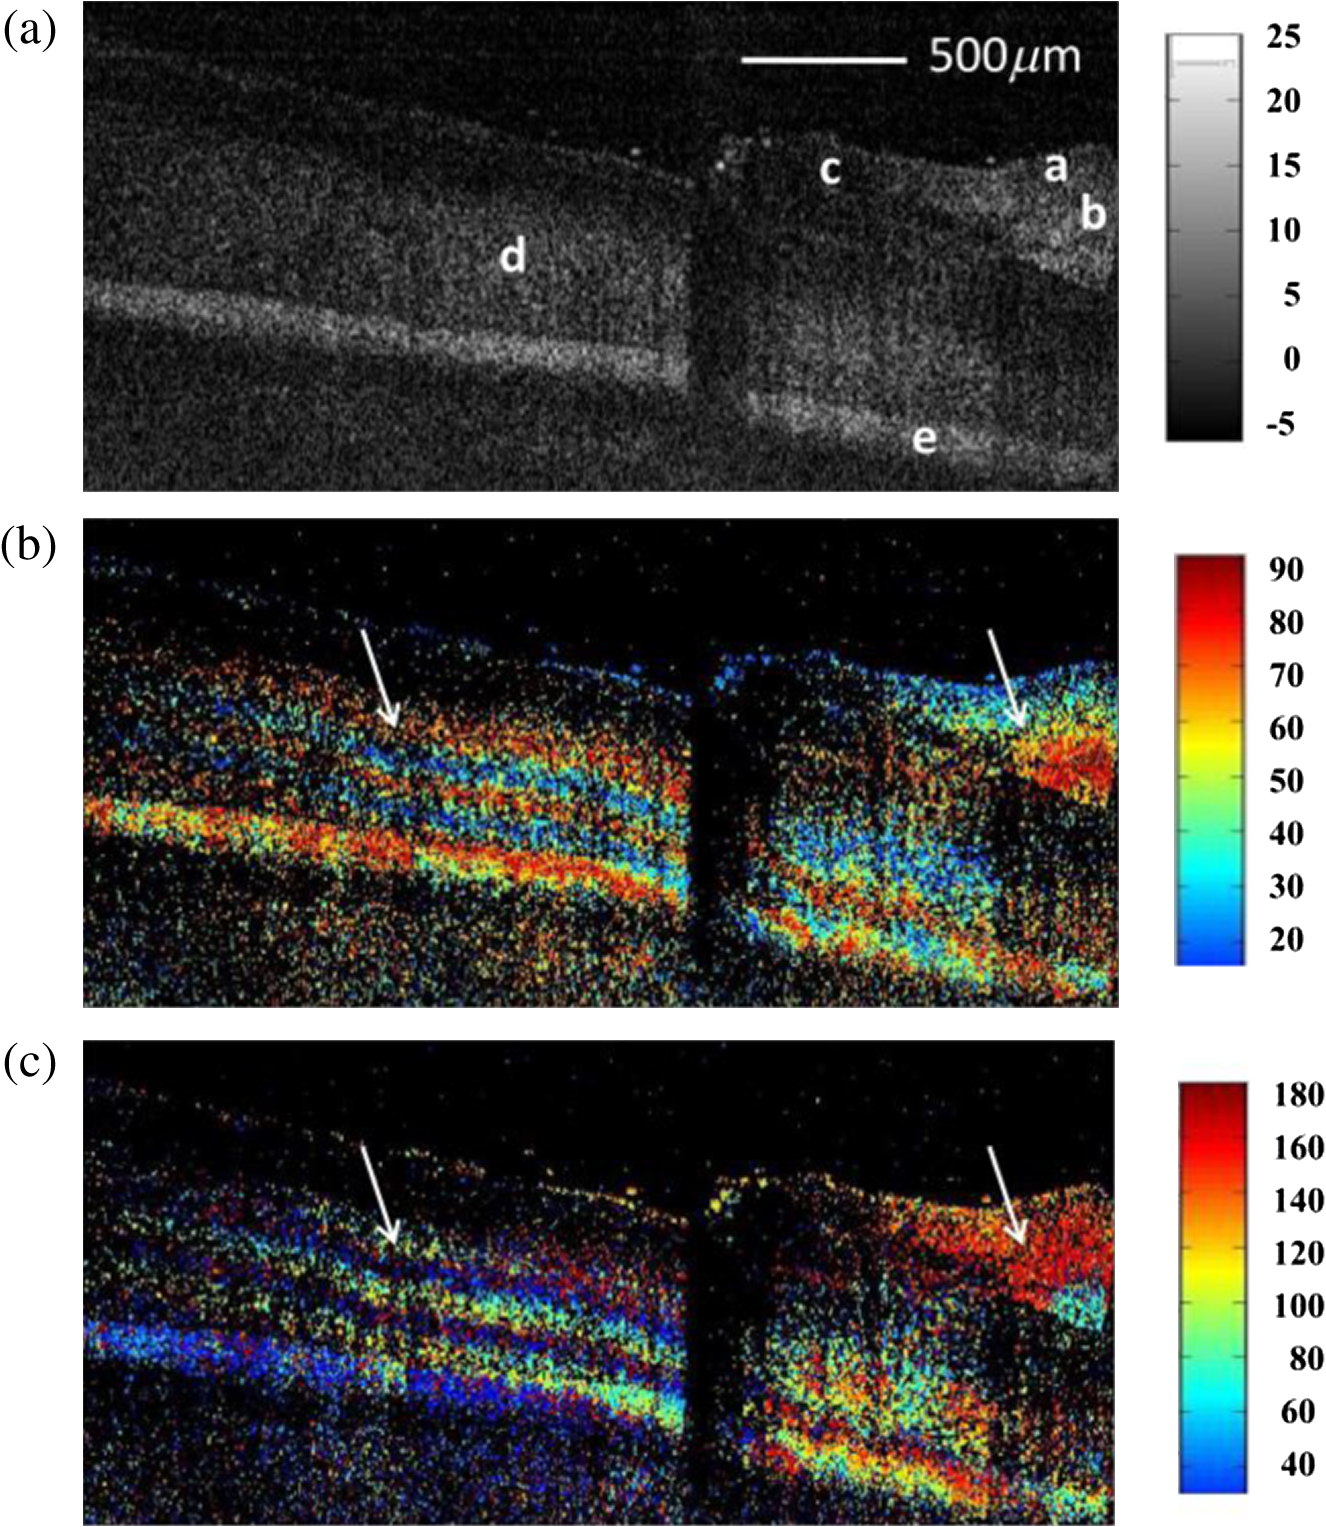 However, the interpretation of FA maps as that of Figs. 7(c) and 8(c) deserves some care. Equations. (1) to (3), which we used to derive the FA as a function of PR, are based on the assumption that the sample consists of only one birefringent layer for a constant FA. Therefore, the true-axis orientation can only be determined for the first birefringent layer in the sample. In the future, a more sophisticated method, such as modeling specimens as stacked, multiple layered retarders with an arbitrary FA for each layer, has to be used.22,23 As the result, cumulative effects of overlying layers were removed and differential FA orientation was measured.24 4.ConclusionIn summary, by means of the proposed calibration process, the all-fiber optics CS SSPS-OCT was able to characterize the R, PR, and FA of the light reflected from within the measured samples with only a single A-scan. The less stringent requirement on the lens alignment in this scheme is an additional advantage. This compact and portable system harbors tremendous promise as a technology for realizing PS-OCT instrument for clinical endoscopy applications. Some undesirable noise interferograms caused by cross talk between the two polarized orthogonal modes can be removed by increasing the length of the PM delay fibers. The dispersion mismatch between the two arms of the interferometer, and the polarization mode dispersion caused by the PM fiber length mismatch of the sample and reference arms can likewise be successfully resolved by means of the proposed dispersion compensation algorithm. One can obtain an optimal axial resolution of and improvement in the SNR, compared to the signal with no dispersion compensation. However, additional dispersion determining and compensation procedures should be included in the image processing having a weak birefringent fiber in interferometer arms; this also requires further adjustment of the polarization state of the PC. This calibration step only needs to be performed once before the actual imaging. The verification of the PR measurements indicated that the measured diagrams exhibited good linear responses accompanied by small standard deviations and good repeatability in every PR setting step. The measured FA orientations are in agreement with the set values and exhibited a good linear response with small standard deviations as well. The measurement accuracies are similar to the performances of the previous references using bulk optic structures. In a linear scanning range smaller than 6 mm, the largest deviations of the PR and FA were 3 and 7 deg, respectively. When the probe fiber had a twisting angle smaller than 65 deg, the largest deviation of PR and FA were 2.1 and 5.5 deg, respectively. Both deviations were of the same order as those in the stationary probe setup. The proposed scheme has successfully accomplished in vivo imaging of human fingertip and nail using all fiber optics-type SSPS-OCT with a linear scanning probe. However, although based on the result of the bending test shown in Fig. 6(c), the largest deviations of the PR were only 3.5 deg, and the measured FA changed by to 21 deg. This indicates that the endoscopy based applications that measure only PR should work well with our proposed scheme. Applications requiring quantitative FA measurement would need an additional modification of the calibration processing, such as prescribed methods in Refs. 15 and 25. The other drawback is that the operation bandwidths of fiber optics components restrict the effective bandwidth of the light sources in the PS-OCT and may thus limit the axial resolutions. AcknowledgmentsThis work was supported by grants from the National Science Council (Grant Nos. NSC 99-2112-M-010-002-MY3, and 102-2112-M-010-002-MY3) of Taiwan. ReferencesD. Huanget al.,
“Optical coherence tomography,”
Science, 254
(5035), 1178
–1181
(1991). http://dx.doi.org/10.1126/science.1957169 SCIEAS 0036-8075 Google Scholar
M. R. Heeet al.,
“Polarization-sensitive low coherence reflectometer for birefringence characterization and ranging,”
J. Opt. Soc. Am. B, 9
(6), 903
–908
(1992). http://dx.doi.org/10.1364/JOSAB.9.000903 JOBPDE 0740-3224 Google Scholar
K. Schoenenbergeret al.,
“Mapping of birefringence and thermal damage in tissue by use of polarization-sensitive optical coherence tomography,”
Appl. Opt., 37
(25), 6026
–6036
(1998). http://dx.doi.org/10.1364/AO.37.006026 APOPAI 0003-6935 Google Scholar
M. J. Everettet al.,
“Birefringence characterization of biological tissue by use of optical coherence tomography,”
Opt. Lett., 23
(3), 228
–230
(1998). http://dx.doi.org/10.1364/OL.23.000228 OPLEDP 0146-9592 Google Scholar
J. F. de Boeret al.,
“Two-dimensional birefringence imaging in biological tissue by polarization-sensitive optical coherence tomography,”
Opt. Lett., 22
(12), 934
–936
(1997). http://dx.doi.org/10.1364/OL.22.000934 OPLEDP 0146-9592 Google Scholar
C. K. Hitzenbergeret al.,
“Measurement and imaging of birefringence and optic axis orientation by phase resolved polarization sensitive optical coherence tomography,”
Opt. Express, 9
(13), 780
–790
(2001). http://dx.doi.org/10.1364/OE.9.000780 OPEXFF 1094-4087 Google Scholar
M. Yamanariet al.,
“Fiber-based polarization-sensitive Fourier domain optical coherence tomography using B-scan-oriented polarization modulation method,”
Opt. Express, 14
(14), 6502
–6515
(2006). http://dx.doi.org/10.1364/OE.14.006502 OPEXFF 1094-4087 Google Scholar
J. F. de BoerT. E. MilnerJ. S. Nelson,
“Determination of the depth-resolved Stokes parameters of light backscattered from turbid media by use of polarization-sensitive optical coherence tomography,”
Opt. Lett., 24
(5), 300
–302
(1999). http://dx.doi.org/10.1364/OL.24.000300 OPLEDP 0146-9592 Google Scholar
S. JiaoG. S. W. YuL. V. Wang,
“Optical-fiber-based Mueller optical coherence tomography,”
Opt. Lett., 28
(14), 1206
–1208
(2003). http://dx.doi.org/10.1364/OL.28.001206 OPLEDP 0146-9592 Google Scholar
S. JiaoL. V. Wang,
“Jones-matrix imaging of biological tissues with quadruple-channel optical coherence tomography,”
J. Biomed. Opt., 7
(3), 350
–358
(2002). http://dx.doi.org/10.1117/1.1483878 JBOPFO 1083-3668 Google Scholar
G. MoneronA. BoccaraA. Dubois,
“Polarization-sensitive full-field optical coherence tomography,”
Opt. Lett., 32
(14), 2058
–2060
(2007). http://dx.doi.org/10.1364/OL.32.002058 OPLEDP 0146-9592 Google Scholar
B. Censeet al.,
“Polarization-sensitive spectral-domain optical coherence tomography using a single line scan camera,”
Opt. Express, 15
(5), 2421
–2431
(2007). http://dx.doi.org/10.1364/OE.15.002421 OPEXFF 1094-4087 Google Scholar
D. P. DaveT. AkkinT. E. Milner,
“Polarization-maintaining fiber-based optical low-coherence reflectometer for characterization and ranging of birefringence,”
Opt. Lett., 28
(19), 1775
–1777
(2003). http://dx.doi.org/10.1364/OL.28.001775 OPLEDP 0146-9592 Google Scholar
M. K. Al-QaisiT. Akkin,
“Polarization-sensitive optical coherence tomography based on polarization-maintaining fibers and frequency multiplexing,”
Opt. Express, 16
(17), 13032
–13041
(2008). http://dx.doi.org/10.1364/OE.16.013032 OPEXFF 1094-4087 Google Scholar
E. Gotzingeret al.,
“Polarization maintaining fiber based ultra-high resolution spectral domain polarization sensitive optical coherence tomography,”
Opt. Express, 17
(25), 22704
–22717
(2009). http://dx.doi.org/10.1364/OE.17.022704 OPEXFF 1094-4087 Google Scholar
H. WangM. K. Al-QaisiT. Akkin,
“Polarization-maintaining fiber based polarization-sensitive optical coherence tomography in spectral domain,”
Opt. Lett., 35
(2), 154
–156
(2010). http://dx.doi.org/10.1364/OL.35.000154 OPLEDP 0146-9592 Google Scholar
M. K. Al-QaisiT. Akkin,
“Swept-source polarization-sensitive optical coherence tomography based on polarization-maintaining fiber,”
Opt. Express, 18
(4), 3392
–3403
(2010). http://dx.doi.org/10.1364/OE.18.003392 OPEXFF 1094-4087 Google Scholar
E. C. Leeet al.,
“In vivo optical frequency domain imaging of human retina and choroid,”
Opt. Express, 14
(10), 4403
–4411
(2006). http://dx.doi.org/10.1364/OE.14.004403 OPEXFF 1094-4087 Google Scholar
D. L. JonesT. W. Parks,
“A high resolution data-adaptive time-frequency representation,”
IEEE Trans. Acoust., Speech, Signal Process., 38
(12), 2127
–2135
(1990). http://dx.doi.org/10.1109/29.61539 0096-3518 Google Scholar
J. A. NelderR. Mead,
“A simplex method for function minimization,”
Comput. J., 7
(4), 308
–313
(1965). http://dx.doi.org/10.1093/comjnl/7.4.308 CMPJA6 0010-4620 Google Scholar
J. E. Rothet al.,
“Simplified method for polarization-sensitive optical coherence tomography,”
Opt. Lett., 26
(14), 1069
–1071
(2001). http://dx.doi.org/10.1364/OL.26.001069 OPLEDP 0146-9592 Google Scholar
M. Todorovicet al.,
“Determination of local polarization properties of biological samples in the presence of diattenuation by use of Mueller optical coherence tomography,”
Opt. Lett., 29
(20), 2402
–2404
(2004). http://dx.doi.org/10.1364/OL.29.002402 OPLEDP 0146-9592 Google Scholar
S. Guoet al.,
“Depth-resolved birefringence and differential optical axis orientation measurements with fiber-based polarization-sensitive optical coherence tomography,”
Opt. Lett., 29
(17), 2025
–2027
(2004). http://dx.doi.org/10.1364/OL.29.002025 OPLEDP 0146-9592 Google Scholar
N. J. Kempet al.,
“Depth-resolved optic axis orientation in multiple layered anisotropic tissues measured with enhanced polarization-sensitive optical coherence tomography (EPS-OCT),”
Opt. Express, 13
(12), 4507
–4517
(2005). http://dx.doi.org/10.1364/OPEX.13.004507 OPEXFF 1094-4087 Google Scholar
M. C. Pierceet al.,
“Effects of sample arm motion in endoscopic polarization-sensitive optical coherence tomography,”
Opt. Express, 13
(15), 5739
–5749
(2005). http://dx.doi.org/10.1364/OPEX.13.005739 OPEXFF 1094-4087 Google Scholar
|


