
|
|
1.IntroductionThe ability to quantify the diffusion and binding of molecules in living cells provides a deep understanding of cellular dynamics.1,2 Conventionally, such measurements have been implemented mainly via fluorescence recovery after photobleaching (FRAP), a technique that relies on selectively photobleaching the fluorophores within a region of interest by a high-intensity laser, followed by monitoring the diffusion of new fluorescent molecules into this bleached area over a period of time with a low-intensity excitation.3 By analyzing the temporal profile of the fluorescence signal recovery, the physical properties of molecules and their surrounding medium can be revealed.4 One underlying assumption of FRAP is that further photobleaching is negligible during fluorescence recovery. However, since both photobleaching rate and fluorescence emission rate are proportional to the laser fluence,5 the requirement of low-power excitation often results in noisy images, degrading the fidelity of the fluorescence recovery profile. In addition, toxic radicals, such as reactive oxygen species, are generated as side products of photobleaching, a process which may interrupt normal cellular processes and jeopardize a cell’s viability.6 To overcome these limitations, we present an alternative method, photoacoustic recovery after photothermal bleaching (PRAP), for studying the localization, mobility, and transportation of cellular components. PRAP is the counterpart of FRAP in photoacoustic microscopy (PAM), a high-resolution imaging modality that has been widely used to gain a fuller understanding of varying cellular dynamics.7–11 The contrast agents in PAM can be either exogenous, such as metal nanoparticles,12,13 or endogenous, such as hemoglobins,14 cytochromes,9 and DNA/RNA.15 Analogous to photobleaching in fluorescence microscopy, the contrast agents in PAM can also be intentionally photothermally destroyed using strong excitation light. Upon the intense excitation, the contrast agents may undergo photothermal fragmentation, resulting in a shifted absorption peak and thereby a reduction of photoacoustic (PA) signals after exposure.16 The PRAP utilizes this effect and measures the recovery of PA signals owing to the diffusion of new absorbers into the bleached region, thus enabling the quantification of particle dynamics at micron scale via PA imaging. In contrast to photobleaching in fluorescence microscopy, photothermal bleaching in PAM behaves quite differently before and after the absorbers are raised to a critical temperature by the excitation laser pulses.16 Below the pulse energy threshold corresponding to the critical temperature, the photothermal bleaching rate is small and has weak dependence on laser fluence; above it, the bleaching rate increases rapidly. This property is ideal for PRAP operation, the absorbers can be easily photothermally bleached with a relatively high-intensity laser and readily monitored with negligible bleaching at the stage of recovery using sub-threshold laser pulse energy. Additionally, since photothermal bleaching does not involve chemical destruction of a fluorophore as in FRAP,16 few reactive oxygen species are generated, which is much preferred for live cell imaging. 2.Materials and Methods2.1.Description of the PA MicroscopeThe PRAP experiments were performed on a recently developed optical resolution PAM system.7 PAM is a high-resolution imaging technique that provides unique 100% optical absorption contrast.17 In PAM, the sample is irradiated by a pulsed laser. Upon excitation, a portion of the light is absorbed by the object and partially converted to heat. Assuming thermal and stress confinements, the pressure immediately builds up within the heated region and propagates as ultrasonic waves via thermoelastic expansion.11 By detecting the PA waves outside the sample, an optical absorption map inside the sample can be recovered. The system setup is shown in Fig. 1. A pulsed laser beam (5-ns pulse duration, 1-kHz pulse repetition rate) of 532-nm wavelength is generated by an OPO laser (NT242-SH, Ekspla, Lithuania) and then spatially filtered through a pinhole of 50-μm-diameter (P50C, Thorlabs, Newton, New Jersey). A microscope objective (Phaco1, 0.32 NA, Leitz Wetzlar, Germany) focuses the laser beam at the sample to induce PA waves. The PA waves are subsequently measured by a custom-made focused transducer (40 MHz central frequency, 80% bandwidth, 0.5 NA). In order to obtain a volumetric image, the sample is raster scanned in the transverse plane. To maximize sensitivity, the optical illumination and acoustic detection remain coaxial and confocal during scanning. The acquired PA signal is digitalized at by a digital acquisition board (PCI-5152, National Instruments, Austin, Texas) and corrected for fluence fluctuation pulse by pulse. Fig. 1(a) Representation of the photoacoustic microscopy (PAM) system. (b) Representation of the setup for the phantom experiment. The sample and ultrasound transducer were immersed in water. (c) Representation of the setup for the cell experiment. The cells grew on the bottom of a petri dish and were immersed in phenol red-free culture medium.  2.2.Preparation of Cell SamplesNIH 3T3 fibroblast cells were used in this study. The cells were maintained in Dulbecco’s Modified Eagle Medium (DMEM) supplemented with 10% fetal bovine serum, 2 mM glutamine, penicillin, and streptomycin. Cells with medium were incubated at 37°C in 5% and divided every . For subculture, after being dispersed in 0.25% EDTA-trypsin, they were seeded at 2 to . Twenty-four hours after the cells were seeded to the bottom of culture dishes, 70-nm-diameter gold colloid was added to the culture medium to achieve a final colloidal particle concentration of 6 pM. The cells were incubated with the particles for another 24 h for uptake. Before imaging, the cells adhering to the bottom of culture dish were washed with fresh culture medium three times to remove residual particles. Then, to avoid the interference of phenol red in PA measurement as well as to maintain cell viability, the culture medium was switched to phenol red-free DMEM. 2.3.Viability TestCell slides were stained with LIVE/DEAD Viability kit (L-3224, Life Technologies, Carlsbad, California). The cell slides were first rinsed with phosphate-buffered saline (PBS) and then stained by 2 μM calcein AM and 4 μM ethidium homodimer for 45 min. After staining, the cell slides were washed with PBS and imaged with a fluorescence microscope. Green fluorescence images were acquired with a 450 to 490 nm excitation filter and a 500 to 550 nm emission filter. Red fluorescence images were acquired with a 530 to 585 nm excitation filter and a 575 to 630 nm emission filter. 3.Results and DiscussionWe validated PRAP first in a simple phantom study and then in a more complex diffusion rate measurement involving live cells. Gold nanoparticles (GNPs) were used as PA imaging contrast agents because they offer superior chemical stability and are used extensively in live cell imaging.18,19 We first measured the pulse energy threshold that corresponded to the onset of photothermal bleaching of 120 pM, 70-nm-diameter colloidal GNPs. The laser beam was focused into the solution held in a silicone tube, and the PA signals were monitored over time to observe the potential photothermal bleaching. The laser pulse energy was varied from 100 to 800 nJ. Little photothermal bleaching was observed until the laser pulse energy reached 550 nJ. Based on the measurement, the pulse energies chosen for photothermal bleaching and PA recovery measurement were 6000 and 200 nJ, respectively. The PRAP experiment started with a baseline, where the PA signals from GNPs were monitored over 100 s with a pulse energy of 200 nJ [Fig. 2(a)]. The measured PA signal amplitude was constant with an SNR of 35 dB. After that, the GNPs were illuminated with high-energy laser pulses for , and the subsequent PA recovery temporal profile was recorded by PAM with low-energy pulses, as shown in Fig. 2(b). Fig. 2(a) Photoacoustic (PA) measurement using low-laser energy () shows no bleaching effect. (b) PA amplitude measured during bleaching and recovery of 120 pM, 70 nm colloidal GNPs in deionized water. The PA signals acquired during photothermal bleaching are omitted in Fig. 2(b).  Under the assumptions of uniform particle concentration in the infinite surrounding medium and negligible diffusion during photothermal bleaching, the PA signal recovery is governed by where denotes the time-lapsed PA signal, represents the asymptotic value when time tends to infinity, is the instantaneous PA amplitude observed immediately after photothermal bleaching, and is the PA recovery rate. Fitting the PA recovery profile in Fig. 2(b) by Eq. (1) yielded a of .Then, we prepared GNP solutions with volume concentrations of glycerol of 0%, 10%, 20%, 30%, and 40%, respectively. These five samples had the same particle concentration, 120 pM, and were studied with PRAP sequentially. By fitting the PA recovery temporal profiles to Eq. (1), the recovery rates at different glycerol concentrations were derived [Fig. 3(b)]. In addition, the diffusion coefficient was calculated by where is the radius of the bleached area.20 The results are shown in Fig. 3(b). Here, was estimated to be 1.0 μm, half of the zero-point width of the main lobe of the optical focus. As expected, both the PA recovery rate and the medium diffusion coefficient decrease with an increase in glycerol concentration, indicating a slower particle diffusion rate in a medium of higher viscosity.Fig. 3(a) Photoacoustic recovery after photothermal bleaching (PRAP) in glycerol aqueous solutions with different concentrations. (b) Recovery rate and diffusion coefficient in each solution. Error bars show 95% confidence bounds.  To validate the results acquired by PRAP, we used the fluorescence-based approach to re-measure the particle diffusion rate in a 40% glycerol solution. The experiment was performed on a laser scanning confocal microscope (Fluoview FV1000, Olympus) equipped with a FRAP module. We added Rhodamine 6G as a fluorescent indicator to the mixed glycerol aqueous solution. An area of the same size as in PRAP was photobleached, and the subsequent fluorescent recovery profile was recorded and analyzed by the fluorescence microscope. The diffusion coefficient measured by FRAP was for the 40% glycerol aqueous solution. Based on the Stokes-Einstein model,21 the diffusion rate is inversely proportional to the particle diameter. Here, the diffusion rates measured by FRAP and PRAP varied by ( versus ) while the particle sizes in the two cases varied by ( versus ). Therefore, the PRAP measurements correlated strongly with the expected diffusion dynamics of GNPs in solution. Finally, to demonstrate PRAP in cell imaging applications, we loaded GNPs into an NIH 3T3 fibroblast cell and applied PRAP to measure the intracellular particle diffusion rate. The cell was raster scanned in the transverse plane to accomplish a C-scan. A region of interest was first chosen within a cell and photothermally bleached as shown in the top two frames of Fig. 4(a). Then, the PA signals from the bleached area were monitored over 40 min [Figs. 4(a) and (b)]. Here, the PA signals were calculated by averaging all pixels within the bleached region. Since the bleached area covered of the cell, the conservation of unbleached particles within the cell results in that the final PA signal was recovered to only of the initial value. It is worth noting that the measured particle diffusion rate was relatively slow, attributed to the relatively large size of the bleached area. Additionally, the intracellular components form a filamentous meshwork, which restricts diffusion as a cytosolic sieve.22,23 Moreover, the GNPs tend to aggregate upon cellular uptake.24 The aggregation of GNPs increases particles’ effective diameters and thereby slows down their diffusion. Depending on particle physicochemical properties (size, charge, coating, etc.),25 and cellular biochemical conditions,26 the formed cluster size varies. This variation in cluster size may impact the quantitative analysis of PRAP. To overcome this problem, the GNPs can be delivered into cells through microinjection27 instead of cellular endocytosis. Furthermore, when PRAP is performed outside of cells, such as on cell membranes, there is no aggregation, and therefore the analysis will not be affected. Fig. 4(a) PRAP in a cell over time. Dashed block shows the bleaching region. (b) PA amplitude of the bleached region measured before bleaching and during recovery. 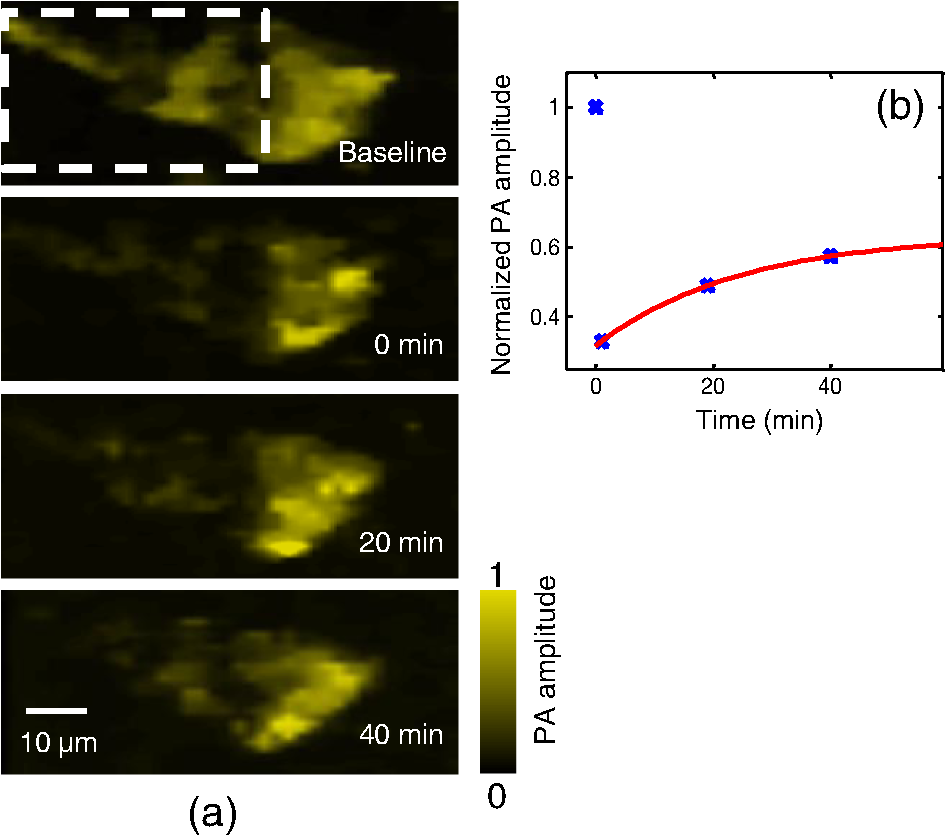 To test the cell viability, all cells in a square area were entirely bleached by the PA and fluorescence methods, respectively. In PRAP, we used the same laser pulse energy as that in other PA cell imaging experiment. For the photobleaching of fluorescence dye, a 225-μW, 488-nm laser was utilized, and the scanning duration was 180 s. For a fair comparison, the cells were illuminated by the laser until they were fully bleached as that in PRAP. The cellular viability was tested by fluorescent staining. The results show that, with our experimental setup, 51% of cells were still viable after the PRAP experiment, compared to 5% after conventional FRAP (Fig. 5). It is worth noting that the survival rate by FRAP, here, is significantly lower than that in other reported FRAP experiments because, here, the whole cell rather than a small cellular portion was photobleached. Fig. 5(a) PAM image of cells loaded with gold nanoparticles (GNPs). (b) Confocal microscopy image of cells stained with calcein AM. (c) PAM images showing the same region as (a) was photothermally bleached. (d) Confocal microscopy image showing the same region as (b) was photobleached. (e) and (f) Live/dead fluorescent staining of the cells in the bleached regions by PAM and confocal microscopy, respectively. Live cells emit green fluorescence, whereas dead cells emit red. (a), (c), and (e) have the same scale. (b), (d), and (f) have the same scale.  4.ConclusionsIn summary, we presented a new PA imaging-based method, PRAP, for measuring intracellular diffusion rate. The experimental results demonstrated that PRAP has the capability to measure the mobility of particles in a viscous medium. In contrast to the conventional fluorescence-based approach, PRAP acquires high-SNR images with negligible bleaching-induced artifacts during PA recovery. PRAP has the potential to facilitate nontoxic biological studies of diffusion at different scales. In the presented cellular experiment, GNPs were used to indicate the motion of cytoplasm. In the future, GNPs can be tagged to specific molecules or organelles via controlled labeling,28 enabling studies of their intracellular diffusion. The performance of PRAP can be further improved by utilizing optimized PA contrast agents, such as silica-coated gold nanorods,29 which exhibit smaller size, lesser disturbance to a living system, and higher PA excitation efficiency. Additionally, although not demonstrated here, PRAP can also be employed in biological tissues, allowing visualization and quantification of diffusive and kinetic processes at depths. AcknowledgmentsThis work was sponsored in part by National Institutes of Health (NIH) grants DP1 EB016986 (NIH Director’s Pioneer Award), R01 CA134539, U54 CA136398, R01 CA157277, and R01 CA159959. L.W. has a financial interest in Microphotoacoustics, Inc. and Endra, Inc., which, however, did not support this work. ReferencesE. A. ReitsJ. J. Neefjes,
“From fixed to FRAP: measuring protein mobility and activity in living cells,”
Nat. Cell Biol., 3
(6), E145
–E147
(2001). http://dx.doi.org/10.1038/35078615 NCBIFN 1465-7392 Google Scholar
J. Lippincott-SchwartzE. SnappA. Kenworthy,
“Studying protein dynamics in living cells,”
Nat. Rev. Mol. Cell Biol., 2
(6), 444
–456
(2001). http://dx.doi.org/10.1038/35073068 NRMCBP 1471-0072 Google Scholar
N. Kloniset al.,
“Fluorescence photobleaching analysis for the study of cellular dynamics,”
Euro. Biophys. J., 31
(1), 36
–51
(2002). http://dx.doi.org/10.1007/s00249-001-0202-2 EBJOE8 0175-7571 Google Scholar
D. Axelrodet al.,
“Mobility measurement by analysis of fluorescence photobleaching recovery kinetics,”
Biophys. J., 16
(9), 1055
–1069
(1976). http://dx.doi.org/10.1016/S0006-3495(76)85755-4 BIOJAU 0006-3495 Google Scholar
G. H. PattersonD. W. Piston,
“Photobleaching in two-photon excitation microscopy,”
Biophys. J., 78
(4), 2159
–2162
(2000). http://dx.doi.org/10.1016/S0006-3495(00)76762-2 BIOJAU 0006-3495 Google Scholar
R. DixitR. Cyr,
“Cell damage and reactive oxygen species production induced by fluorescence microscopy: effect on mitosis and guidelines for non-invasive fluorescence microscopy,”
Plant J., 36
(2), 280
–290
(2003). http://dx.doi.org/10.1046/j.1365-313X.2003.01868.x 0960-7412 Google Scholar
C. ZhangK. MaslovL. V. Wang,
“Subwavelength-resolution label-free photoacoustic microscopy of optical absorption in vivo,”
Opt. Lett., 35
(19), 3195
–3197
(2010). http://dx.doi.org/10.1364/OL.35.003195 OPLEDP 0146-9592 Google Scholar
C. Zhanget al.,
“Reflection-mode submicron-resolution in vivo photoacoustic microscopy,”
J. Biomed. Opt., 17
(2), 020501
(2012). http://dx.doi.org/10.1117/1.JBO.17.2.020501 JBOPFO 1083-3668 Google Scholar
C. Zhanget al.,
“Label-free photoacoustic microscopy of cytochromes,”
J. Biomed. Opt., 18
(2), 20504
(2013). http://dx.doi.org/10.1117/1.JBO.18.2.020504 JBOPFO 1083-3668 Google Scholar
Y. Zhanget al.,
“Noninvasive photoacoustic microscopy of living cells in two and three dimensions through enhancement by a metabolite dye,”
Angewandte Chemie, 123
(32), 7497
–7501
(2011). http://dx.doi.org/10.1002/ange.v123.32 ANCEAD 0044-8249 Google Scholar
L. V. WangL. Gao,
“Photoacoustic microscopy and computed tomography: from bench to bedside,”
Annu. Rev. Biomed. Eng.,
(2014). ARBEF7 1523-9829 Google Scholar
G. P. LukeD. YeagerS. Y. Emelianov,
“Biomedical applications of photoacoustic imaging with exogenous contrast agents,”
Ann. Biomed. Eng., 40
(2), 422
–437
(2012). http://dx.doi.org/10.1007/s10439-011-0449-4 ABMECF 0090-6964 Google Scholar
J. R. CookW. FreyS. Emelianov,
“Quantitative photoacoustic imaging of nanoparticles in cells and tissues,”
ACS Nano, 7
(2), 1272
–1280
(2013). http://dx.doi.org/10.1021/nn304739s 1936-0851 Google Scholar
S. HuL. V. Wang,
“Photoacoustic imaging and characterization of the microvasculature,”
J. Biomed. Opt., 15
(1), 011101
(2010). http://dx.doi.org/10.1117/1.3281673 JBOPFO 1083-3668 Google Scholar
D.-K. Yaoet al.,
“In vivo label-free photoacoustic microscopy of cell nuclei by excitation of DNA and RNA,”
Opt. Lett., 35
(24), 4139
–4141
(2010). http://dx.doi.org/10.1364/OL.35.004139 OPLEDP 0146-9592 Google Scholar
L. Gaoet al.,
“Photothermal bleaching in time-lapse photoacoustic microscopy,”
J. Biophoton., 6
(6–7), 543
–548
(2012). https://doi.org/10.1002/jbio.201200184 1864-063X Google Scholar
L. V. Wang,
“Tutorial on photoacoustic microscopy and computed tomography,”
IEEE J. Sel. Top. Quantum Electron., 14
(1), 171
–179
(2008). http://dx.doi.org/10.1109/JSTQE.2007.913398 IJSQEN 1077-260X Google Scholar
X. Yanget al.,
“Nanoparticles for photoacoustic imaging,”
Wiley Interdiscip. Rev. Nanomed. Nanobiotechnol., 1
(4), 360
–368
(2009). https://doi.org/10.1002/wnan.042 Google Scholar
K. T. Thurnet al.,
“Nanoparticles for applications in cellular imaging,”
Nanoscale Res. Lett., 2
(9), 430
–441
(2007). http://dx.doi.org/10.1007/s11671-007-9081-5 1556-276X Google Scholar
H. G. KapitzaG. McGregorK. A. Jacobson,
“Direct measurement of lateral transport in membranes by using time-resolved spatial photometry,”
Proc. Natl. Acad. Sci., 82
(12), 4122
–4126
(1985). http://dx.doi.org/10.1073/pnas.82.12.4122 PIPSBD 0370-0046 Google Scholar
A. Einstein,
“On the movement of small particles suspended in stationary liquids required by the molecular-kinetic theory of heat,”
Annalen der Physik, 17 549
–560
(1905). http://dx.doi.org/10.1002/(ISSN)1521-3889 ANPYA2 0003-3804 Google Scholar
K. Luby-PhelpsD. L. TaylorF. Lanni,
“Probing the structure of cytoplasm,”
J. Cell Biol., 102
(6), 2015
–2022
(1986). http://dx.doi.org/10.1083/jcb.102.6.2015 JCLBA3 0021-9525 Google Scholar
R. Swaminathanet al.,
“Cytoplasmic viscosity near the cell plasma membrane: translational diffusion of a small fluorescent solute measured by total internal reflection-fluorescence photobleaching recovery,”
Biophys. J., 71
(2), 1140
–1151
(1996). http://dx.doi.org/10.1016/S0006-3495(96)79316-5 BIOJAU 0006-3495 Google Scholar
S. Y. Namet al.,
“Nonlinear photoacoustic signal increase from endocytosis of gold nanoparticles,”
Opt. Lett., 37
(22), 4708
–4710
(2012). http://dx.doi.org/10.1364/OL.37.004708 OPLEDP 0146-9592 Google Scholar
H. Y. Namet al.,
“Cellular uptake mechanism and intracellular fate of hydrophobically modified glycol chitosan nanoparticles,”
J. Control. Release, 135
(3), 259
–267
(2009). http://dx.doi.org/10.1016/j.jconrel.2009.01.018 JCREEC 0168-3659 Google Scholar
H.-H. Chenet al.,
“Quantitative analysis of nanoparticle internalization in mammalian cells by high resolution X-ray microscopy,”
J. Nanobiotechnol., 9
(1), 14
(2011). http://dx.doi.org/10.1186/1477-3155-9-14 JNOAAO 1477-3155 Google Scholar
R. Lévyet al.,
“Gold nanoparticles delivery in mammalian live cells: a critical review,”
Nano Rev., 1 1
–18
(2010). http://dx.doi.org/10.3402/nano.v1i0.4889 NRAEC6 2000-5121 Google Scholar
H. Baet al.,
“Immobilization of gold nanoparticles on living cell membranes upon controlled lipid binding,”
Nano Lett., 10
(8), 3006
–3012
(2010). http://dx.doi.org/10.1021/nl101454a NALEFD 1530-6984 Google Scholar
Y.-S. Chenet al.,
“Silica-coated gold nanorods as photoacoustic signal nanoamplifiers,”
Nano Lett., 11
(2), 348
–354
(2011). http://dx.doi.org/10.1021/nl1042006 NALEFD 1530-6984 Google Scholar
|


