|
|
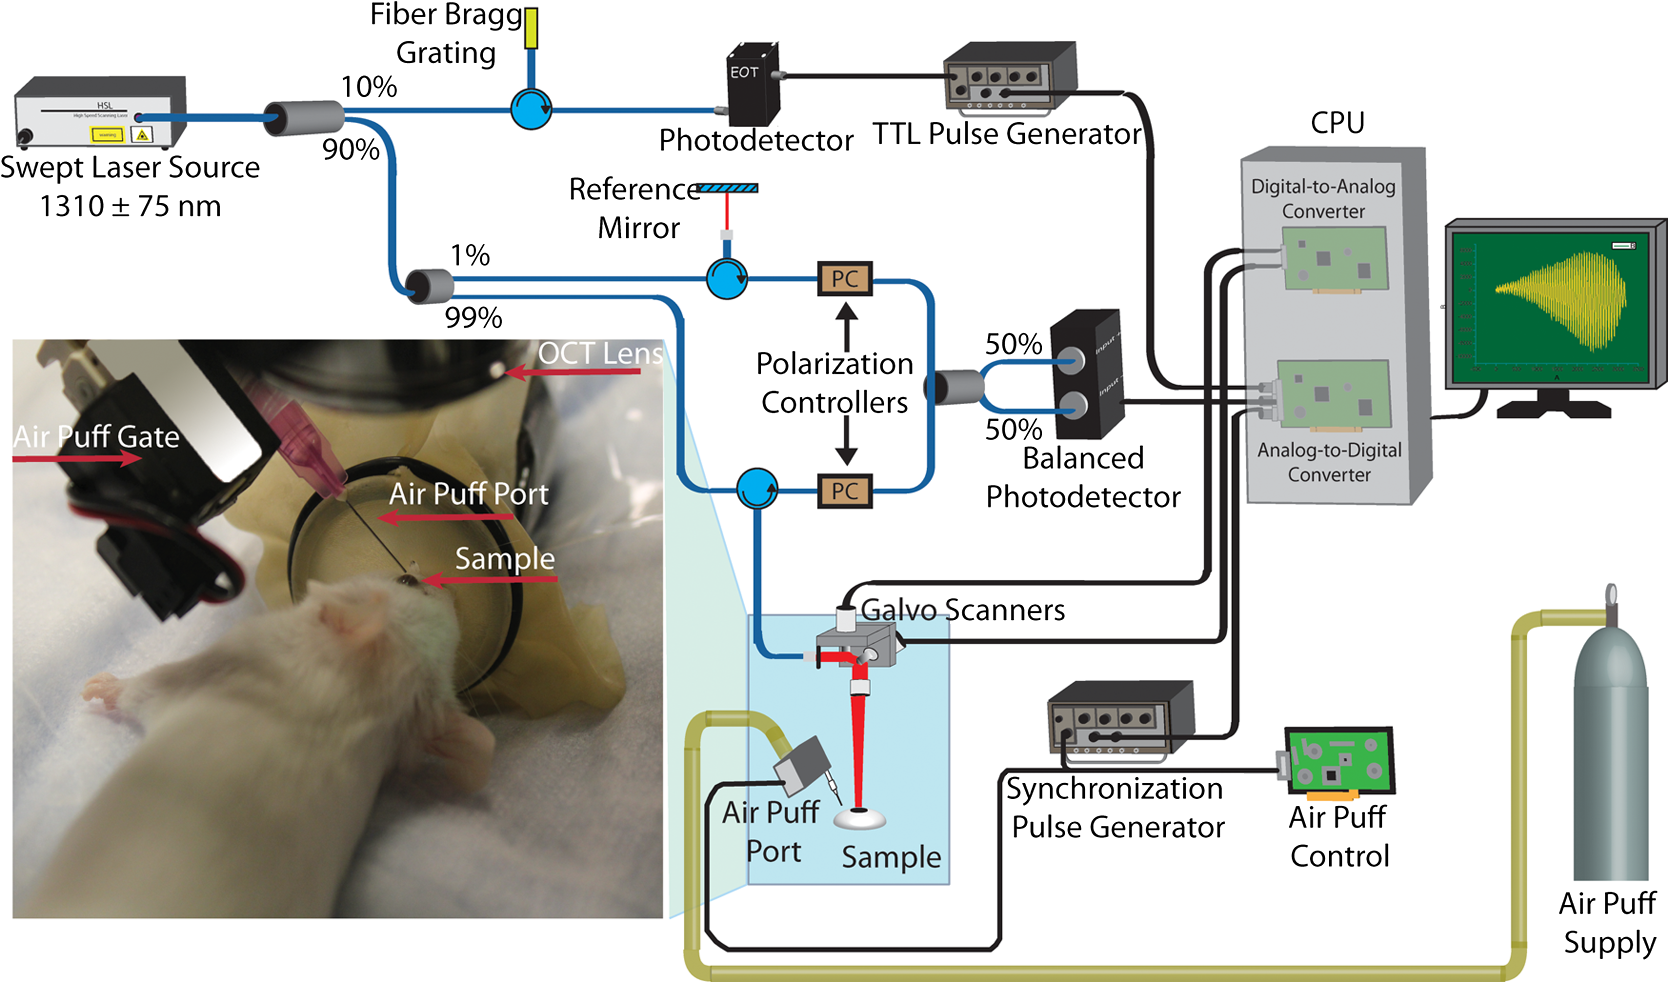
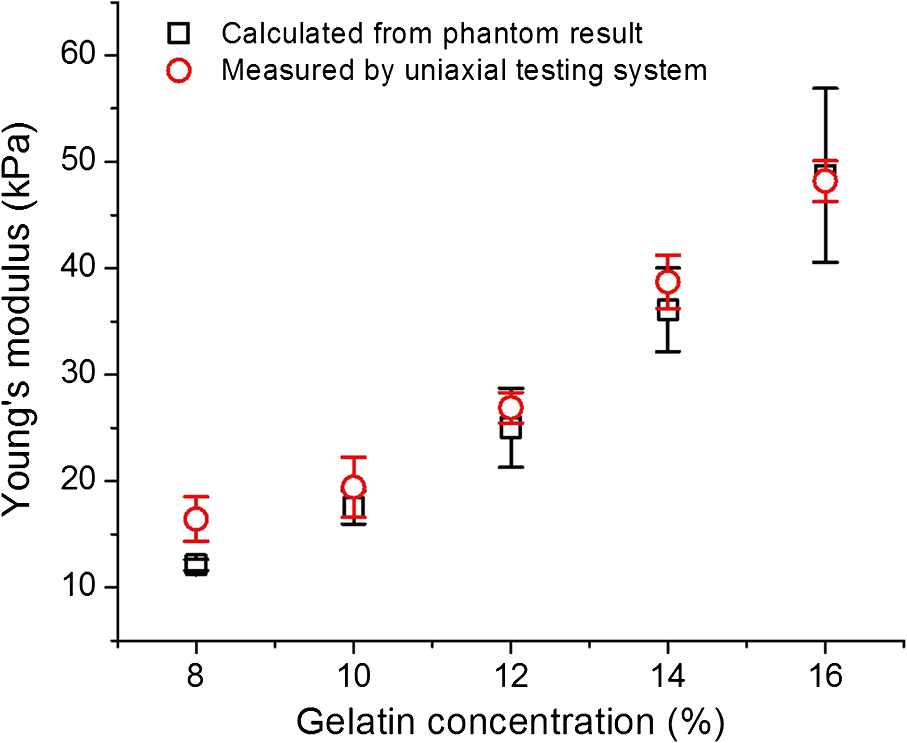
1.IntroductionThe biomechanical characteristics of ocular tissues can have a profound influence on the health, structural integrity, and normal function of the eye.1,2 As a critical component of normal vision, the cornea provides approximately two-thirds of the optical refracting power of the eye. Several diseases, such as axial elongation in myopia, pathological deformation in keratoconus, and iatrogenic keratoectasia following corneal refractive surgery can alter biomechanical properties of the cornea and lead to poor vision and even blindness.3 Thus, the study of the biomechanical properties of cornea can help to detect and diagnose the severity of certain ocular diseases and complement the structural imaging of the eye. Most of the previous attempts to measure tissue elasticity, compressibility, and shear forces have relied on inducing an excitation and measuring the tissue’s response to that excitation. The excitation can be induced in many ways, e.g., with mechanical force,4,5 acoustic radiation force,6 or by using a pulsed laser.7 Several elasticity imaging modalities, which combine different methods of excitation and measurement, have been proposed to measure soft tissue elastic properties, such as magnetic resonance elastography,5,8–10 ultrasound elastography,11,12 acoustic radiation force imaging,13,14 dynamic corneal imaging,15 and supersonic shear imaging.6,16,17 However, all of these methods require significant amplitude of tissue stimulation in order to produce a measurable signal, which may not be applicable for delicate tissues such as the eye during in vivo studies. Holographic imaging has been used to study the elasticity of soft materials and tissues successfully. However, the motion of tissue may reduce the accuracy of this method in monitoring the wave propagation. This makes it difficult to be applied to the cornea in vivo study.18 Brillouin microscopy is an another method that has been successfully used to achieve the depth-dependent biomechanical properties in the human cornea in vivo.19 It has the ability to provide three-dimensional (3-D) elasticity maps of tissue with high-spatial resolution.20 This technique relies on Brillouin scattering, which does not need excitation of tissue deformation. The interpretation of the signals produced by this method and their relation to familiar mechanical parameters, e.g., Young’s modulus is an open question. The ocular response analyzer (ORA) and the CorVis are two approaches currently available for clinical evaluation of the biomechanical properties of cornea.21–23 Both are marketed as devices for the measurement of intraocular pressure and are based on a large amplitude of air pulse that displaces large volumes of tissue. This introduces a significant nonlinear component to the measured properties. Moreover, results from recent clinical studies demonstrated the inability of ORA to identify keratoconus-suspect corneas.23 Optical coherence tomography (OCT) is an emerging technique that enables noninvasive imaging of ocular tissues with both high spatial and temporal resolutions.18,24,25 It has been demonstrated that phase-stabilized OCT is capable of resolving the tissue displacement in nanometer scale26 as well as quantifying the propagation of low amplitude mechanical waves in tissue.27–34 The surface wave method, which relates the Young’s modulus of sample to the propagation velocity of surface wave, has been widely used for the quantification of sample elasticity.16 Recently, OCT combined with an air puff system has been employed to measure the characteristics of corneal deformation in vivo.34 Here, we demonstrate the use of phase-stabilized swept source OCT (PhS-SSOCT) to assess the waves induced by a focused air-pulse system in tissue-mimicking phantoms and in corneal tissue in vivo. By using this noncontact excitation source, our results show that the PhS-SSOCT system is capable of measuring low-amplitude waves in the scale of microns. Therefore, the combination of air-pulse excitation and PhS-SSOCT measurement is potentially useful for studying the biomechanical properties of ocular tissues in vivo. To our best knowledge, this is the first study demonstrating the possibility of completely noninvasive exciting and quantifying the surface waves in vivo using optical coherence elastography. 2.Experimental Methods2.1.System SetupElastic waves are induced in the sample using a home-built air-pulse delivery system that produces a focused air stream with a duration of . The spatial-temporal profile of the air pulse is characterized as a Gaussian shape. Briefly, the system employs an air gate and a control unit to provide the short-duration air puff. An extra channel for signal output from the control unit allows proper synchronization with the PhS-SSOCT measurement system. The air source pressure can be obtained from a pressure gauge, and the output of the air-pulse system is through a cannula port with a flat edge and the diameter of . The localized air-pulse excitation can be precisely positioned through a 3-D linear micrometer stage. This excitation system can be treated as a noncontact stimulation method. A PhS-SSOCT imaging system is combined with this air-pulse system to detect elastic waves in the sample. The schematic of the experimental setup for the in vivo study of mouse cornea is shown in Fig. 1. Briefly, the PhS-SSOCT system is composed of a broadband swept laser source (HSL2000, Santec, Inc., Torrance, California) with the central wavelength of 1310 nm, the bandwidth of , the scan rate of 30 kHz, and the output power of . Interference is produced by the light coming from the sample and reference paths using a Mach–Zehnder interferometer and the fringes are detected by a balanced photodetector. A fiber Bragg grating is used for triggering the A-scan acquisition. The details of the system description can be found in our previous work.29,35,36 The axial resolution of the system is , and the phase stability of the system is experimentally measured to be (corresponding to displacement in air). The air-pulse system generates a transistor–transistor logic signal which is recorded by the analog-to-digital converter for synchronization. 2.2.Experimental MaterialsIn order to simulate soft tissue samples of controlled stiffness, gelatin phantoms of five different concentrations (8%, 10%, 12%, 14% and 16% w/w) were prepared. Gelatin powder (PB Leiner, 250 Bloom/8 Mesh) was mixed with distilled water at 60°C until all granules were dissolved. Special care was taken while stirring the mixture to avoid the formation of air bubbles. The mixture was poured into a round mold to create a disk of -thick and in diameter [Fig. 2(a)] and cooled down in a refrigerator for 30 min ().37 The solidified gel formed a solid slab that served as a tissue-mimicking sample. Fig. 2Phantom sample is shown as (a). Excitation and measurement locations on (b) gelatin phantom and (c) mouse cornea in vivo. (d) shows the port and the mouse cornea. In (c) and (d), the scale along the long-axis is 4.8 mm, and for the short-axis, the scale is 4.4 mm, and for , the scale is 2.2 mm.  The contact lens used was a commercially available lens (Bausch & Lomb, Slisoft + 12.00D, 100% Silicone) that has a convex-concave shape similar to the cornea and has homogeneous optical and mechanical properties. During the experiments, the contact lens was fixed on a flat plate, and the space between the contact lens and the plate was filled with phosphate-buffered saline simulating the aqueous humor in a second experiment. A custom-made silicone model of an eye was also used in our study. This model provides an anterior surface scaled to match the curvature and size of the human eye. However, it has homogeneous optical and mechanical properties. The eye-mimicking model’s anterior surface had a radius of curvature of 7.8 mm. In vivo studies were performed on the corneas of three mice (15 to 22 months old). The cornea was kept hydrated by the periodical application of 0.9% saline solution during experiments. All animal manipulation procedures were approved by the Animal Care and Use Committee of the University of Houston. Surface waves were excited with the air pressure set as for the gelatin phantoms and silicone eye model, for the contact lens, and for mouse cornea in vivo. During all experiments, the distances between the tip of the air-pulse system port and the sample surface were kept within 0.3 mm, and time-dependent phase response was recoded from the surface of samples. Our investigation has shown that the air pressure of the system output remains relatively stable with the distance change within 10 mm between the port tip and the sample surface.38 M-mode imaging over time at different positions (M-B scan mode) was utilized for OCT measurement. The spatial distributions of the excitation points and measurement points on the samples are shown in Fig. 2. The distance between the excitation point and the first measurement point was kept at more than 1 mm. The distance between two recording positions was 1 mm during the gelatin phantom, contact lens, and silicone eye model studies and 0.3 mm during in vivo studies. 2.3.Quantification MethodsTo calculate amplitude of the surface waves from phase measurements, the following equation was used:30 where is the central wavelength of the OCT system.The velocity of the elastic wave was calculated as where is the distance between the measurement points; is the time delay of the elastic waves at two measurement positions. The main peak (peak with the highest amplitude) of deformation was used to calculate the time delay. The time delay was defined as the difference between the time of the onset of air pulse and the time of surface wave arrival measured at the main peak. The distances between all adjacent points were 1 mm, and the calculations were based on each pair of adjacent points. Therefore, the velocity was calculated as 1 mm divided by the time delay difference between the two adjacent points.Assuming that the phantoms are isotropic homogeneous elastic materials, the Young’s modulus of the sample can be calculated based on the wave velocity as follows:39 where is the mass density and is the Poisson’s ratio of the medium. Although this equation was derived for a half-space, we used it as a first-order approximation to evaluate Young’s modulus of the gelatin phantoms based on the group velocity of the surface waves measured in the experiment.For the studies on contact lens, silicone eye model, and in vivo mouse cornea, the time delay was calculated relative to the position that is the nearest to the estimated excitation point and two-dimensional (2-D) rendered maps of time delay were generated. 3.Results and Discussion3.1.Gelatin Phantom StudiesFigure 3(a) shows typical amplitude of the surface waves propagating in the 14% gelatin phantom recorded at various measurement locations away from the excitation position. These data clearly demonstrate that the amplitude decreases and the time delay increases with the increasing distance. Although the spatial-temporal profile of the air pulse is well characterized as a Gaussian pulse, it was not delivered perfectly normal to the specimen surface (mostly due to the geometrical coupling with the OCT imaging lens). It is possible that the angular separation of the air pulse and the measurement axis ( in this experiment) may influence the shape and force of the stimulus, thereby producing additional frequencies [the small amplitude vibration before the major deformation, as seen in Fig 3(a)]. Figure 3(b) shows the velocity of the surface waves measured in gelatin phantoms of different concentrations. The data indicate that the wave velocity increases with increasing concentration of gelatin, corresponding to the increase in the sample stiffness, which is consistent with our previous study.30 The typical delay map of the 12% gelatin phantom is shown in Fig. 4, which also indicates that the time delay increased with the increasing of the distance. Fig. 3(a) Phase responses recorded at various measurement points away from the source of excitation in 14% gelatin phantom. (b) The wave velocity as a function of the concentration of gelatin (). 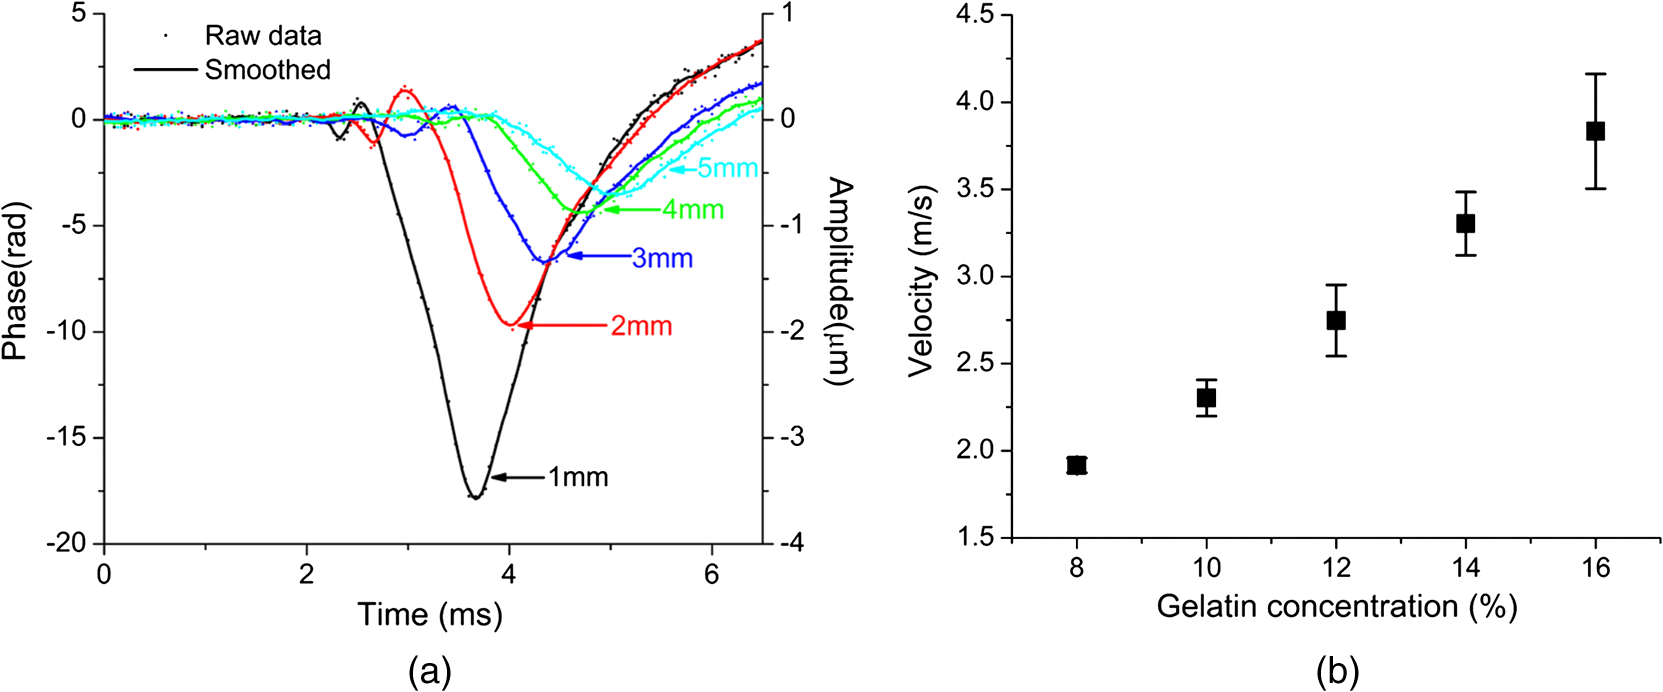 The obtained Young’s moduli of the gelatin phantoms are presented in Fig. 5. For the quantification, the density () of gelatin phantoms was assumed to be and the Poisson’s ratio () of 0.5 was used to obtain from Eq. (3).40 The calculated Young’s moduli of 8%, 10%, 12%, 14% and 16% gelatin phantoms are , , , , and , respectively. Additionally, a uniaxial testing system (In-Spec 2200, Instron, Inc., Northwood, Massachusetts) was used to measure the Young’s moduli of gelatin phantoms with the same concentrations (Fig. 5). It can be easily seen that the estimated Young’s moduli obtained from the wave velocity using OCT are reasonably close to those obtained using the uniaxial testing system. The small differences may be attributed to the fact that different samples were used in these two measurement methodologies (OCT measurements versus uniaxial testing). 3.2.Contact Lens StudyThe experiment with a contact lens was performed with 0.9% saline solution placed between the contact lens and the supporting plate. Figure 6 shows the 2-D rendered map of time delay of the elastic waves in the contact lens. The result in Fig. 6 shows that the delay increases within greater distance in the contact lens and then decreases with the further increase in the distance. Fig. 62-D rendered map showing the time delay distribution on the surface of contact lens with 0.9% saline beneath the lens.  There are several possible explanations for the observed difference in the delay distribution in phantoms and in the contact lens. One possibility is that the presence of the liquid on the lens posterior surface and the geometry of the lens produce a difference in how the energy propagates within the medium. For instance, the pressure pulse generates P-waves or compression waves that propagate much faster in the saline solution with low attenuation than the elastic waves in the cornea or lens material. As a result, these waves could produce additional sources of mechanical excitation in the lens after reflection from the hard surface. Therefore, the complex time delay distribution in the contact lens could be explained by the interaction of the different types of the waves. It is clear, however, that the presence of the liquid on the lens posterior surface complicates the wave pattern similar to what we observed in in vivo studies (see Fig. 7). 3.3.Silicone Eye Model and In Vivo Study of 18-Month-Old Mouse CorneaFigures 7(a) and 7(b) show the OCT structural images and 2-D rendered maps for the time delay of the elastic waves measured in the silicone eye model and the mouse cornea in vivo, respectively. In Fig. 7(a), the time delay of the elastic wave increases as distance increases across the thick and homogeneous silicon layer that is different from what is observed in the real mouse eye. In Fig. 7(b), similar results as in Fig. 6 can be observed: the time delay of elastic waves increases with the increasing distance before reaching the corneal apex but decreases with greater distance after crossing the apex. The distribution of time delay before the elastic waves that reach the apex can be used to quantify the wave velocity. For the 18-month-old mouse cornea, the velocity of the elastic wave is calculated as 0.92 to at different lateral positions due to heterogeneity of the tissue, which are potentially useful for the estimation of cornea elasticity. Additional work is required to develop a quantitative model to estimate corneal elasticity and to obtain corneal elastography because corneal tissue is inhomogeneous in both structure and composition. Equation 3, used here for isotropic homogenous materials, may not be proper to be used for the tissues like the cornea, which are composed of multiple layers and have curved surfaces. This method does not involve tools that disrupt tissue or physically contact the eye. The displacement caused by air-pulse excitation on the cornea in these experiments is on the order of micrometers, which is much smaller than the indentation produced by the air puff used in clinical measurement of intraocular pressure (tonometry). Therefore, this approach is less invasive than current clinical procedures and suitable for delicate tissues or other sensitive materials. The high sensitivity of the PhS-SSOCT system enables accurate detection of the displacement of the cornea. These advantages allow the dynamic assessment of elastic waves propagating in ocular tissues and make it possible to estimate their biomechanical properties in vivo. 4.ConclusionIn this article, we have demonstrated that PhS-SSOCT can be used to monitor and assess the elastic waves that are induced by a focused air-pulse stimulus in tissue-mimicking phantoms, contact lenses, a silicone eye model, and the mouse cornea in vivo. For the phantoms, Young’s modulus can be estimated based on the surface wave velocity. For the ocular models and tissue samples evaluated here, 2-D rendered maps of time delay caused by the propagation of elastic waves can be plotted. With further development, this noncontact optical method can be used to study the stiffness of delicate tissues such as the cornea and sclera of the eye. We also plan to take into account a finite thickness of the cornea and its viscous properties. The current design of the system only permits experimental studies in vivo on animal models. For clinical studies, the distance between the port and the cornea will need to be properly secured and the first prototype is currently under construction. ReferencesJ. W. RubertiR. A. SinhaC. J. Roberts,
“Corneal biomechanics and biomaterials,”
Annu. Rev. Biomed. Eng., 13
(1), 269
–295
(2011). http://dx.doi.org/10.1146/annurev-bioeng-070909-105243 ARBEF7 1523-9829 Google Scholar
M. D. Robertset al.,
“Correlation between local stress and strain and lamina cribrosa connective tissue volume fraction in normal monkey eyes,”
Invest. Ophthalmol. Visual Sci., 51
(1), 295
–307
(2010). http://dx.doi.org/10.1167/iovs.09-4016 IOVSDA 0146-0404 Google Scholar
M. C. ChiramboD. Benezra,
“Causes of blindness among students in blind school institutions in a developing country,”
Br. J. Ophthalmol., 60
(9), 665
–668
(1976). http://dx.doi.org/10.1136/bjo.60.9.665 BJOPAL 0007-1161 Google Scholar
K. W. Hollmanet al.,
“Strain imaging of corneal tissue with an ultrasound elasticity microscope,”
Cornea, 21
(1), 68
–73
(2002). http://dx.doi.org/10.1097/00003226-200201000-00015 CORNDB 0277-3740 Google Scholar
D. V. Litwilleret al.,
“MR elastography of the ex vivo bovine globe,”
J. Magn. Reson. Imaging, 32
(1), 44
–51
(2010). http://dx.doi.org/10.1002/jmri.v32:1 1053-1807 Google Scholar
M. Tanteret al.,
“High-resolution quantitative imaging of cornea elasticity using supersonic shear imaging,”
IEEE Trans. Med. Imaging, 28
(12), 1881
–1893
(2009). http://dx.doi.org/10.1109/TMI.2009.2021471 ITMID4 0278-0062 Google Scholar
C. LiZ. HuangR. K. Wang,
“Elastic properties of soft tissue-mimicking phantoms assessed by combined use of laser ultrasonics and low coherence interferometry,”
Opt. Express, 19
(11), 10153
–10163
(2011). http://dx.doi.org/10.1364/OE.19.010153 OPEXFF 1094-4087 Google Scholar
A. Manducaet al.,
“Magnetic resonance elastography: non-invasive mapping of tissue elasticity,”
Med. Image Anal., 5
(4), 237
–254
(2001). http://dx.doi.org/10.1016/S1361-8415(00)00039-6 MIAECY 1361-8415 Google Scholar
P. J. McCrackenet al.,
“Mechanical transient-based magnetic resonance elastography,”
Magn. Reson. Med., 53
(3), 628
–639
(2005). http://dx.doi.org/10.1002/(ISSN)1522-2594 MRMEEN 0740-3194 Google Scholar
R. Muthupillaiet al.,
“Magnetic resonance elastography by direct visualization of propagating acoustic strain waves,”
Science, 269
(5232), 1854
–1857
(1995). http://dx.doi.org/10.1126/science.7569924 SCIEAS 0036-8075 Google Scholar
J. Ophiret al.,
“Elastography: ultrasonic estimation and imaging of the elastic properties of tissues,”
Proc. Inst. Mech. Eng. H, 213
(3), 203
–233
(1999). http://dx.doi.org/10.1243/0954411991534933 PIHMEQ 0954-4119 Google Scholar
K. J. ParkerR. M. Lerner,
“Sonoelasticity of organs: shear waves ring a bell,”
J. Ultrasound Med., 11
(8), 387
–392
(1992). JUMEDA 0278-4297 Google Scholar
M. D’OnofrioA. GallottiR. P. Mucelli,
“Tissue quantification with acoustic radiation force impulse imaging: measurement repeatability and normal values in the healthy liver,”
Am. J. Roentgenol., 195
(1), 132
–136
(2010). http://dx.doi.org/10.2214/AJR.09.3923 AJROAM 0092-5381 Google Scholar
K. Nightingale,
“Acoustic radiation force impulse (ARFI) imaging: a review,”
Curr. Med. Imaging Rev., 7
(4), 328
–339
(2011). http://dx.doi.org/10.2174/157340511798038657 CMIRCV 1573-4056 Google Scholar
G. Grabneret al.,
“Dynamic corneal imaging,”
J. Cataract Refractive Surg., 31
(1), 163
–174
(2005). http://dx.doi.org/10.1016/j.jcrs.2004.09.042 JCSUEV 0886-3350 Google Scholar
X. ZhangJ. F. Greenleaf,
“Estimation of tissue’s elasticity with surface wave speed,”
J. Acoust. Soc. Am., 122
(5), 2522
–2525
(2007). http://dx.doi.org/10.1121/1.2785045 JASMAN 0001-4966 Google Scholar
M. Tanteret al.,
“Quantitative assessment of breast lesion viscoelasticity: initial clinical results using supersonic shear imaging,”
Ultrasound Med. Biol., 34
(9), 1373
–1386
(2008). http://dx.doi.org/10.1016/j.ultrasmedbio.2008.02.002 USMBA3 0301-5629 Google Scholar
K. D. MohanA. L. Oldenburg,
“Elastography of soft materials and tissues by holographic imaging of surface acoustic waves,”
Opt. Express, 20
(17), 18887
–18897
(2012). http://dx.doi.org/10.1364/OE.20.018887 OPEXFF 1094-4087 Google Scholar
G. ScarcelliS. H. Yun,
“In vivo Brillouin optical microscopy of the human eye,”
Opt. Express, 20
(8), 9197
–9202
(2012). http://dx.doi.org/10.1364/OE.20.009197 OPEXFF 1094-4087 Google Scholar
G. ScarcelliP. KimS. H. Yun,
“In vivo measurement of age-related stiffening in the crystalline lens by Brillouin optical microscopy,”
Biophys. J., 101
(6), 1539
–1545
(2011). http://dx.doi.org/10.1016/j.bpj.2011.08.008 BIOJAU 0006-3495 Google Scholar
A. Kotecha,
“What biomechanical properties of the cornea are relevant for the clinician?,”
Surv. Ophthalmol., 52
(6), S109
–S114
(2007). http://dx.doi.org/10.1016/j.survophthal.2007.08.004 SUOPAD 0039-6257 Google Scholar
G. J. OrssengoD. C. Pye,
“Determination of the true intraocular pressure and modulus of elasticity of the human cornea in vivo,”
Bull. Math. Biol., 61
(3), 551
–572
(1999). http://dx.doi.org/10.1006/bulm.1999.0102 BMTBAP 0092-8240 Google Scholar
A. Saadet al.,
“Biomechanical properties of keratoconus suspect eyes,”
Invest. Ophthalmol. Visual Sci., 51
(6), 2912
–2916
(2010). http://dx.doi.org/10.1167/iovs.09-4304 IOVSDA 0146-0404 Google Scholar
C. SunB. StandishV. X. Yang,
“Optical coherence elastography: current status and future applications,”
J. Biomed. Opt., 16
(4), 043001
(2011). http://dx.doi.org/10.1117/1.3560294 JBOPFO 1083-3668 Google Scholar
X. LiangV. CreceaS. A. Boppart,
“Dynamic optical coherence elastography: a review,”
J. Innov. Opt. Health Sci., 3
(4), 221
–233
(2010). http://dx.doi.org/10.1142/S1793545810001180 1793-5458 Google Scholar
M. H. De la Torre-IbarraP. D. RuizJ. M. Huntley,
“Double-shot depth-resolved displacement field measurement using phase-contrast spectral optical coherence tomography,”
Opt. Express, 14
(21), 9643
–9656
(2006). http://dx.doi.org/10.1364/OE.14.009643 OPEXFF 1094-4087 Google Scholar
S. Wanget al.,
“Noncontact measurement of elasticity for the detection of soft tissue tumors using phase-sensitive optical coherence tomography combined with a focused air puff system,”
Opt. Lett., 37
(24), 5184
–5186
(2012). http://dx.doi.org/10.1364/OL.37.005184 OPLEDP 0146-9592 Google Scholar
C. Liet al.,
“Quantitative elastography provided by surface acoustic waves measured by phase-sensitive optical coherence tomography,”
Opt. Lett., 37
(4), 722
–724
(2012). http://dx.doi.org/10.1364/OL.37.000722 OPLEDP 0146-9592 Google Scholar
R. K. Manapuramet al.,
“In vivo estimation of shear wave parameters using phase stabilized swept source optical coherence elastography,”
J. Biomed. Opt., 17
(10), 100501
(2012). http://dx.doi.org/10.1117/1.JBO.17.10.100501 JBOPFO 1083-3668 Google Scholar
R. K. Manapuramet al.,
“Estimation of shear wave velocity in gelatin phantoms utilizing PhS-SSOCT,”
Laser Phys., 22
(9), 1439
–1444
(2012). http://dx.doi.org/10.1134/S1054660X12090101 LAPHEJ 1054-660X Google Scholar
R. K. Manapuramet al.,
“Estimation of surface wave propagation in mouse cornea,”
Proc. SPIE, 8209 82090S
(2012). http://dx.doi.org/10.1117/12.909229 PSISDG 0277-786X Google Scholar
R. K. Manapuramet al.,
“3D assessment of mechanical wave propagation in the crystalline eye lens using PhS-SSOCT,”
Proc. SPIE, 7885 78851V
(2012). http://dx.doi.org/10.1117/12.875064 PSISDG 0277-786X Google Scholar
X. Lianget al.,
“Acoustomotive optical coherence elastography for measuring material mechanical properties,”
Opt. Lett., 34
(19), 2894
–2896
(2009). http://dx.doi.org/10.1364/OL.34.002894 OPLEDP 0146-9592 Google Scholar
M. Razaniet al.,
“Feasibility of optical coherence elastography measurements of shear wave propagation in homogeneous tissue equivalent phantoms,”
Biomed. Opt. Express, 3
(5), 972
–980
(2012). http://dx.doi.org/10.1364/BOE.3.000972 BOEICL 2156-7085 Google Scholar
R. K. ManapuramV. G. R. ManneK. V. Larin,
“Phase-sensitive swept source optical coherence tomography for imaging and quantifying of microbubbles in clear and scattering media,”
J. Appl. Phys., 105
(10), 102040
–102049
(2009). http://dx.doi.org/10.1063/1.3116614 JAPIAU 0021-8979 Google Scholar
R. K. ManapuramV. G. R. ManneK. V. Larin,
“Development of phase-stabilized swept-source OCT for ultra-sensitive quantification of microbubbles,”
Laser Phys., 18
(9), 1080
–1086
(2008). http://dx.doi.org/10.1134/S1054660X08090144 LAPHEJ 1054-660X Google Scholar
T. J. Hallet al.,
“Phantom materials for elastography,”
IEEE Trans. Ultrasonics Ferroelectrics Freq. Control, 44
(6), 1355
–1365
(1997). http://dx.doi.org/10.1109/58.656639 0885-3010 Google Scholar
S. Wanget al.,
“A focused air-pulse system for optical coherence tomography-based measurements of tissue elasticity,”
Laser Phys. Lett., 10
(7), 075605
(2013). http://dx.doi.org/10.1088/1612-2011/10/7/075605 1612-2011 Google Scholar
J. F. Doyle, Wave Propagation in Structures: Spectral Analysis Using Fast Discrete Fourier Transform, Springer-Verlag, New York
(1997). Google Scholar
X. ZhangB. QiangJ. Greenleaf,
“Comparison of the surface wave method and the indentation method for measuring the elasticity of gelatin phantoms of different concentrations,”
Ultrasonics, 51
(2), 157
–164
(2011). http://dx.doi.org/10.1016/j.ultras.2010.07.005 ULTRA3 0041-624X Google Scholar
|