|
|
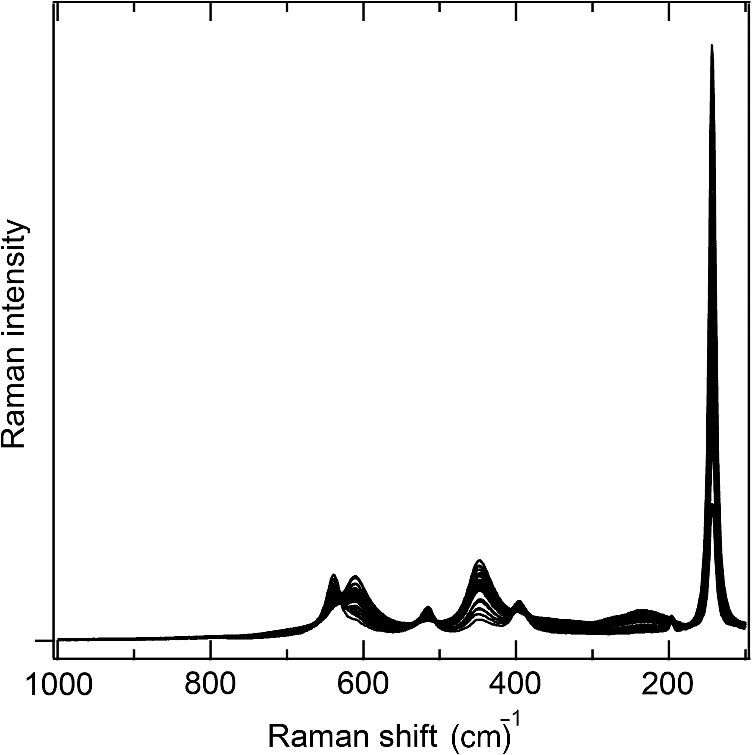
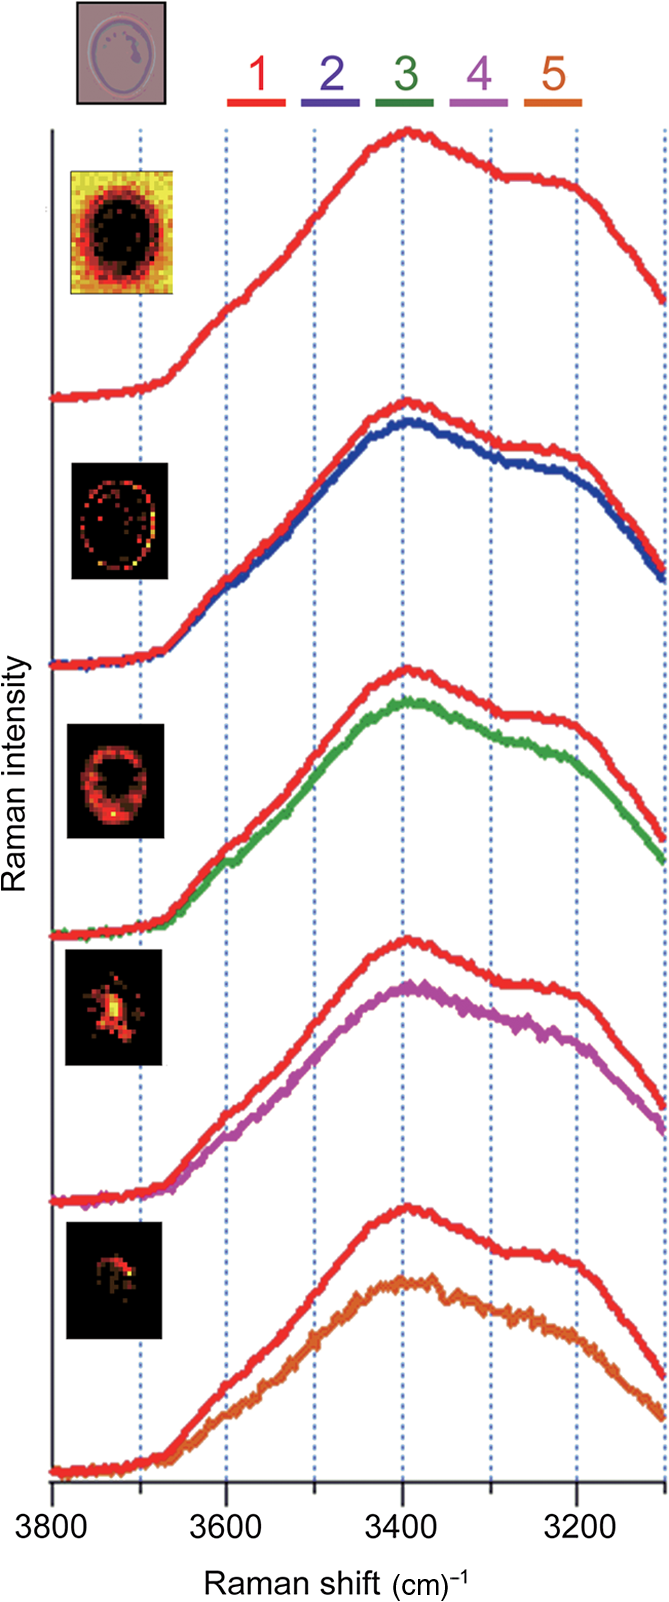
1.IntroductionRaman microspectroscopy, Raman spectroscopy under a microscope, is now widely used in molecular-level investigations in various fields of bioscience and biotechnology.1–5 It is now well established as a strategic analytical tool in these fields. From its nature, Raman spectroscopy does not require any sample pretreatment such as dye labeling or genetic manipulation and is low invasive. It is therefore highly suitable for in vivo analysis of living cells. For example, it possesses a high potential in low-invasive screening of living cells in regenerative medicine, where the safety in the re-use of screened cells is the most crucial issue. With sub-μm spatial resolution, Raman microspectroscopy provides space-resolved information on a molecular structure and their distribution inside the cell. In the past two decades, a number of publications have shown the successful application of Raman microspectroscopy to label-free molecular-level analysis of living cells and to discrimination of cell types.6–23 Although Raman spectra contain rich information on molecular structure, detailed interpretation of measured spectra is often difficult because of their complexity. Each Raman spectrum obtained from space-resolved mapping measurements is usually interpreted as a superposition of several spectral components of biomolecules, as well as a background and fluorescence. In order to decompose the complicated spectra into tractable component spectra, a number of chemometric methods have been developed and applied to the analysis of Raman spectra and images. Cluster analysis (CA) is one of the widely used decomposition methods.9,24–28 With the CA method, by statistically analyzing the spectral variations, distinct subsets of similar spectra are obtainable. It has been applied to diagnostic tissue discrimination24 and subcellular structure imaging.9 In the CA method, the number of clusters is important.27,28 A small cluster number may result in false allocation of some raw spectra. A large number of clusters are often needed to achieve a relevant segmentation, which complicates the interpretation. Principal component analysis (PCA) is also widely used.25,27–31 This method gives an orthogonal set of dominant spectral components, called principal components (PCs), as a result of matrix factorization. Each spectrum of original data can be expressed as a linear combination of PCs. PCA method has also been proved useful for the construction of molecular images from decomposed spectral component1,31,32 as well as for the discrimination of tissue or cell types.2,13,33,34 However, physical bases of this method are rather obscure; the PCs exhibit positive and negative values, thus the physical meanings of decomposed spectral components are not clear just as they are. Recently, the multivariate curve resolution-alternating least squares (MCR-ALS) method, also known as self-modeling curve resolution or non-negative matrix factorization,35 has been developed and applied to the spectral decomposition of Raman spectra.25,29,31,36–41 It has also been exploited in many kinds of spectroscopy, high performance liquid chromatography,42,43 gas chromatograph/mass spectrometry,44 UV-VIS,45 near-infrared,46,47 FT-IR,48,49 fluorescence imaging,50 etc. In the MCR method, the experimental data is approximated by a linear combination of several spectral components.51,52 The decomposition of superposed spectral data sets is done with ALS calculation, under appropriate model constraints, such as non-negativity of spectral profiles and their concentrations. Due to these constraints, this method easily provides physically interpretable spectral components, without any a priori information on chemical components in the sample specimen such as a living cell. Using this advantage, we have successfully applied the MCR-ALS method to the analysis of molecular component distribution imaging (MCDI) in living cells, whose raw spectra contain a number of unknown spectral components and are hard to interpret without a priori information. We have developed an in-house software for the MCR-ALS of numerous Raman spectral data. In the following, we first show the capability of the MCR-ALS method by using a model system consisting of two different types of crystal polymorphs of titanium oxide (), anatase and rutile. MCDI of polymorphs is successfully obtained. Then, we show the MCR-ALS analysis of the time- and space-resolved Raman spectra of a dividing fission yeast cell. Unexpected dynamic changes of major cellular molecular components (lipids, proteins, and polysaccharides) during the cell cycle have been elucidated. Finally, we show the results of the study of intracellular water in a living budding yeast cell. We have successfully resolved so far unknown organelle-specific water structures by the MCR-ALS method. Highly important and otherwise unobtainable MCDI information has thus been obtained for the two living cell systems in vivo. 2.MethodIn the MCR, the experimental data is approximated by a linear combination of several spectral components. In the matrix form, this approximation can be written as where is an experimental data matrix of spectra acquired at different measuring points, written as where is the number of data points per spectrum along with the wavenumber axis and is the number of spectra in the whole data set. is decomposed to matrix , whose columns represent pure component spectra, and matrix , whose rows represent the intensity profiles of individual corresponding spectral components. is the number of underlying constituents, which should be set a priori by the user or estimated by singular value decomposition (SVD) or PCA. In an MCR analysis, and are usually obtained by iterative refinement with MCR-ALS so that the Frobenius norm is minimized, under the non-negativity constraints and . These constraints come from the fact that, in physical terms, Raman spectra and their concentration profiles must be non-negative. Unlike other factorization methods such as SVD and PCA, the MCR-ALS does not require the orthogonality of each component but only requires their non-negativity. This results in the advantage of MCR-ALS providing solutions that are more straightforward to interpret.In practice, the initialization method and the additional constraints should be determined in advance. Several initialization methods are proposed.25,53–57 For example, the initial guess of the matrix or can be determined by random non-negative values, by an SVD-based manner, or SIMPLISMA. The number of components, value, is determined by a priori information of the sample species or is estimated by the number of dominant singular values from an SVD analysis. The initialization method should be appropriately chosen by the variance of spectral data set and/or signal-to-noise ratio. In order to attain sufficient decomposition ability, in addition to non-negativity constraints, further constraints for ALS optimization can be helpful.58,59 When ill-conditioned or singular are given, where contains similar spectral components, then can be easily affected by the noise of raw data , even though the optimization of Eq. (1) is achieved. Additional constraint terms can be applied to the ALS optimization; () is minimized instead of . In practice, L2-norm (ridge regression) and/or L1-norm (lasso regression) penalty term can be used for this purpose. With L2-norm penalty term , the following equations are solved: where is a identity matrix. L1-norm penalty term can be applied as follows: where is a matrix all of whose elements are unity. These equations are iteratively solved to obtain the optimized matrices and , respectively. The L2-norm regularization can provide preferable solutions even though the or matrix is singular, whereas the L1-norm regularization can provide sparser solutions. These L2- and L1-norm regularizations are efficacious in obtaining pure spectral decomposition and sparse MCDI, especially from complex sample species and low signal-to-noise ratio Raman spectral data sets.2.1.Example of Crystal Polymorphs DiscriminationHere, as a model system, type discrimination of crystal polymorphs, anatase and rutile, is performed using the MCR-ALS method. Anatase and rutile powder were mixed and placed on quartz cover slips. Space-resolved Raman spectra were obtained by using a 785-nm excitation Raman microspectroscopic system. Raman spectra of the powder mixture were collected over a region with a 0.25-μm scanning interval, hence, 6400 spectra were obtained. Each Raman spectrum consisted of 1340 wavenumber points corresponding to the 1340 elements of a charge-coupled device detector. Figure 1 shows the representative Raman spectra. These spectra have a number of overlapped Raman bands, interpreted as the superposition of the two intrinsic Raman spectra of anatase and rutile shown in Fig. 2. In the present MCR-ALS analysis, the Raman spectra sets were combined to make a matrix. The number of pure spectral components was set to , and the initial guess of matrix was set by random numbers. In the ALS optimization, the constraints were set as follows: (1) and , (2) L2-norm penalty term in Eq. (2) was set to be , (3) L1-norm penalty term in Eq. (6) was set to be . These equations were iteratively solved with non-negative matrix factorization algorithm, and in every iteration step, column vectors of the matrix were all normalized.60 After the 500 iteration cycle, ensuring that converged to a sufficiently small value constant value, the pure spectral components were obtained as shown in Fig. 3. Fig. 3(a) Multivariate curve resolution-alternating least squares (MCR-ALS) retrieved Raman spectra, (b) optical microscope image of powder, and (c) pseudocolor distribution images of components 1 (red) and 2 (green). 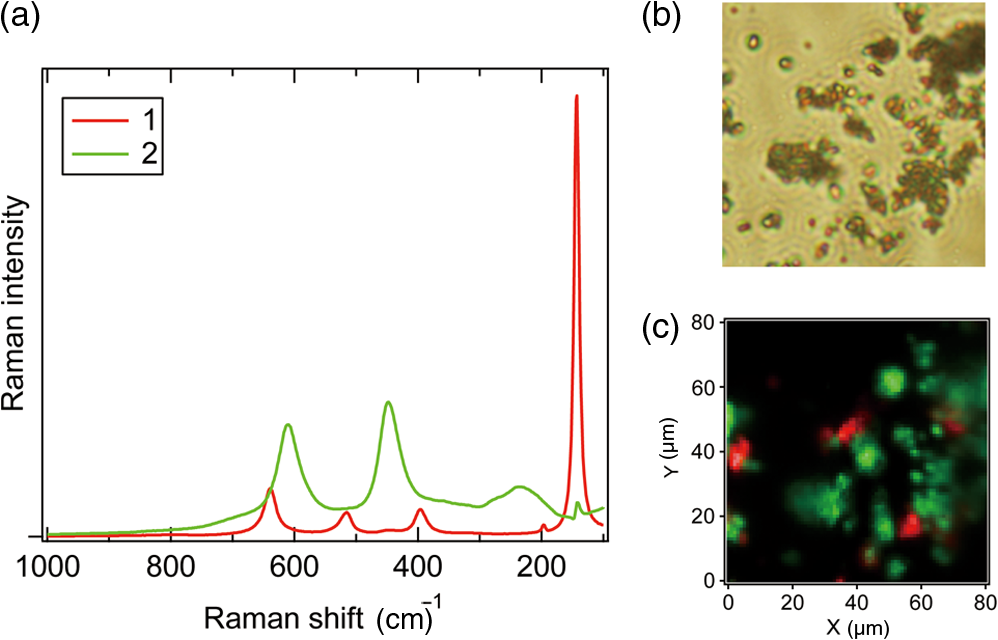 The MCR-ALS based factorization successfully decomposes the raw spectral data sets into two pure component spectra, i.e., the components 1 and 2 spectra are identical to the Raman spectra of anatase and rutile, respectively [Figs. 2 and 3(a)]. Based on this discrimination, each MCDI is constructed by rearranging the row vectors of . As shown in Fig. 3(c), a clear distribution image has been obtained, providing the qualitative and quantitative information about the mixture sample. As shown here, the MCR-ALS technique automatically resolves, without a priori spectral information, the observed set of space-resolved Raman spectra into physically interpretable spectra of the two polymorphs. 2.2.Analysis of Living CellsTaking advantage of the physically interpretable factorization, the MCR-ALS technique can be effectively applied to molecular-level analysis of living cells. Living cells are highly complicated molecular systems and contain a large number of spectral components with no a priori information. This is particularly the case with in vivo analysis. Furthermore, they contain many compounds that have similar molecular structures. Consequently, Raman spectra tend to show many overlapped bands. This situation makes it difficult to analyze living cell Raman spectra at a detailed molecular level. The MCR-ALS analysis has great advantages to overcome these difficulties: (1) It does not need a priori information on the spectral and concentration profiles. (2) Decomposed spectra are ready for physical and/or chemical interpretation. (3) Sparseness constraints can be effectively used to achieve high contrast MCDI. The MCR-ALS analysis is capable of extracting dynamic information from living cells. Figure 4 shows the time-lapse MCDI of a single dividing Schizosaccharomyces pombe, fission yeast cell.61 Raman mapping measurements were performed at 600 to 800 points (depending on the image size) at an interval of 0.5 μm and at nine different times (1, 2, 4, 6, 6.5, 10, 14, 18, and 22 h after inoculation of yeast cells into medium) in the cell cycle. The resultant 6885 Raman spectra were assembled to construct one matrix; two spatial and one temporal dimensions were combined to a single dimension. The ALS optimization was conducted with an SVD-based initialization (six SVD spectral components were used as the initial guess of matrix) and L1-norm regularization, yielding sparse solutions. The resulting six components are denoted 1 to 6 as given in Figs. 4(a) and 4(b). It should be noted that the MCR-ALS optimization started with random initialization was in vain for decomposition in this complicated cell system. In order to avoid falling into a false local minimum rather than the global minimum, the initialization of or was a key step. Fig. 4Time-lapse Raman imaging of single dividing fission yeast cell. (a) Six spectral components (1 to 6) derived from MCR-ALS and (b) distribution images of components 1 to 6 together with the optical microscope images. .  By the MCR-ALS method, the separation of background signals is easily carried out; the component 1 is interpreted as due to the background because it shows a featureless spectral profile [Fig. 4(a) 1] and high intensity distribution patterns outside the cells [Fig. 4(b) 1]. The distributions of polysaccharides are clearly observed from the component 2, whose spectrum [Fig. 4(a) 2] very much resembles the spectra of glucan and mannan.7 It localizes at the cell wall and septum at all measurement times [Fig. 4(b) 2]. The component 3 [Fig. 4(a) 3] shows typical lipid spectrum with unsaturated lipids7 and ergosterol.20 From the time dependent changes of the corresponding spatial distribution [Fig. 4(a) 3], we know that the concentration of lipids shows a drastic decrease just after the cell division and gradually comes back as time goes on. The spectral components 4 and 5 [Fig. 4(a) 4 and 5] contain well-known protein bands. The concentrations and distributions of proteins [Fig. 4(b) 4 and 5] show time dependence that is totally different from that of lipids. The fact that we have two spectral components for proteins means that we have two groups of protein molecules with different structures (and hence different spectra) that show distinct time- and space-dependence during the cell cycle. We need additional information on those protein groupings in order to resolve this set of Raman spectra into more physically meaningful protein spectra. The origin of the component 6 is still unclear, although the MCR-ALS analysis ends up with much less clear results without this component. In this way, the intrinsic spectra and MCDI obtained from MCR-ALS has elucidated unknown and unexpected molecular-level dynamics taking place during the process of cell division. Another study with the MCR-ALS shows the existence of organelle-specific water structures in a living budding yeast cell.62 Water molecules inside a cell are believed to play critical roles in physiological processes, creating distinct structural and chemical properties as compared to bulk water.63 A detailed intracellular water structural information in living yeast cells (diploid Saccharomyces cerevisiae) has been obtained using Raman microspectroscopy, in which the OH stretch Raman band of water is sensitive to the changes in the hydrogen-bonding networks. In the following MCR-ALS analysis, 247 mapping measured Raman spectra ranging from 3100 to (572 wavenumber points) were used as an input. From an SVD analysis, the number of components was determined to be five. For the initial guess of , the bulk water spectrum was used as the only “fixed” component and the other spectral profiles were randomly set. The ALS iteration was performed with L2-norm regularization, which is known to be effective for MCR-ALS analysis of data sets including like component spectra. The resultant five components are shown in Fig. 5. The five pseudocolor MCDIs are almost mutually exclusive and the five spectral components show varying relative intensities of the OH stretch bands. The component 1 corresponds to bulk water whose spectrum is fixed. Its spatial distribution shows high value outside the cell. The component 5 has a significantly lower intensity in the OH stretch region as compared to the intensity in the region, indicating a lower proportion of stable hydrogen-bonding network in component 5 than in bulk water. From the analysis of the average spectra in the fingerprint region (data not shown here), the components 2 to 5 have been indicated to originate from the cell wall, cytoplasm, nuclear, and lipid bodies, respectively. Thus, organelle-specific water structures in living yeast cells are successfully retrieved and elucidated by using the MCR-ALS method. It is well recognized that water is the most difficult molecule to study in living cells. Only the combination of Raman microspectroscopy and MCR-ALS can provide this unique information of organelle-specific water structures in a cell in vivo. 3.ConclusionAs Raman microspectroscopy has been exploited in biomedical analysis, thorough interpretations of complicated spectra have often been beset with difficulties. Even a single cell has complicated subcellular structure containing a large number of components. Various multivariate methods like CA and PCA have thus been attempted to resolve the observed spectra into a pure spectral component, but with only limited success. Due to appropriate constraints, non-negativity and L1-norm regularization for fission yeast and non-negativity and L2-norm regularization for water, the MCR-ALS method can provide physically sound spectra and high-contrast MCDI of living cells as has been shown by the two examples described here. AcknowledgmentsThe authors acknowledge the work of Mr. Hirokazu Minami who developed the basis software for the MCR-ALS analysis described in the present article. They also thank the coauthors of the two original papers discussed here, Dr. C.-K. Huang, professor S. Shigeto, and Dr. S. Tiwari. ReferencesC. GendrinY. RoggoC. Collet,
“Pharmaceutical applications of vibrational chemical imaging and chemometrics: a review,”
J. Pharm. Biomed. Anal., 48
(3), 533
–553
(2008). http://dx.doi.org/10.1016/j.jpba.2008.08.014 JPBADA 0731-7085 Google Scholar
C. Kendallet al.,
“Vibrational spectroscopy: a clinical tool for cancer diagnostics,”
Analyst, 134
(6), 1029
–1045
(2009). http://dx.doi.org/10.1039/b822130h ANLYAG 0365-4885 Google Scholar
H. W. Wuet al.,
“In vivo lipidomics using single-cell Raman spectroscopy,”
Proc. Natl. Acad. Sci. U. S. A., 108
(9), 3809
–3814
(2011). http://dx.doi.org/10.1073/pnas.1009043108 PNASA6 0027-8424 Google Scholar
P. C. Lopeset al.,
“Discriminating adenocarcinoma from normal colonic mucosa through deconvolution of Raman spectra,”
J. Biomed. Opt., 16
(12), 127001
(2011). http://dx.doi.org/10.1117/1.3658756 JBOPFO 1083-3668 Google Scholar
C. Krafftet al.,
“Raman and coherent anti-Stokes Raman scattering microspectroscopy for biomedical applications,”
J. Biomed. Opt., 17
(4), 040801
(2012). http://dx.doi.org/10.1117/1.JBO.17.4.040801 JBOPFO 1083-3668 Google Scholar
Y. S. Huanget al.,
“Raman spectroscopic signature of life in a living yeast cell,”
J. Raman Spectrosc., 35
(7), 525
–526
(2004). http://dx.doi.org/10.1002/(ISSN)1097-4555 JRSPAF 0377-0486 Google Scholar
Y. S. Huanget al.,
“Molecular-level investigation of the structure, transformation, and bioactivity of single living fission yeast cells by time- and space-resolved Raman spectroscopy,”
Biochemistry, 44
(30), 10009
–10019
(2005). http://dx.doi.org/10.1021/bi050179w MIRBD9 0144-0578 Google Scholar
Y. NaitoA. Toh-eH. Hamaguchi,
“In vivo time-resolved Raman imaging of a spontaneous death process of a single budding yeast cell,”
J. Raman Spectrosc., 36
(9), 837
–839
(2005). http://dx.doi.org/10.1002/(ISSN)1097-4555 JRSPAF 0377-0486 Google Scholar
H. J. van Manenet al.,
“Single-cell Raman and fluorescence microscopy reveal the association of lipid bodies with phagosomes in leukocytes,”
Proc. Natl. Acad. Sci. U. S. A., 102
(29), 10159
–10164
(2005). http://dx.doi.org/10.1073/pnas.0502746102 PNASA6 0027-8424 Google Scholar
I. NotingherL. L. Hench,
“Raman microspectroscopy: a noninvasive tool for studies of individual living cells in vitro,”
Expert Rev. Med. Devices, 3
(2), 215
–234
(2006). http://dx.doi.org/10.1586/17434440.3.2.215 1743-4440 Google Scholar
C. OnogiH. Hamaguchi,
“Photobleaching of the “Raman spectroscopic signature of life” and mitochondrial activity in Rho(−) budding yeast cells,”
J. Phys. Chem. B, 113
(31), 10942
–10945
(2009). http://dx.doi.org/10.1021/jp903478r JPCBFK 1520-6106 Google Scholar
C. OnogiH. ToriiH. Hamaguchi,
“Raman spectra of isotope-substituted mitochondria of living budding yeast cells: possible origin of the “Raman spectroscopic signature of life,”
Chem. Lett., 38
(9), 898
–899
(2009). http://dx.doi.org/10.1246/cl.2009.898 CMLTAG 0366-7022 Google Scholar
U. Neugebaueret al.,
“Identification and differentiation of single cells from peripheral blood by Raman spectroscopic imaging,”
J. Biophotonics, 3
(8–9), 579
–587
(2010). http://dx.doi.org/10.1002/jbio.201000020 JBOIBX 1864-063X Google Scholar
M. OkunoH. Hamaguchi,
“Multifocus confocal Raman microspectroscopy for fast multimode vibrational imaging of living cells,”
Opt. Lett., 35
(24), 4096
–4098
(2010). http://dx.doi.org/10.1364/OL.35.004096 OPLEDP 0146-9592 Google Scholar
M. Okunoet al.,
“Quantitative CARS molecular fingerprinting of single living cells with the use of the maximum entropy method,”
Angew. Chem. Int. Ed., 49
(38), 6773
–6777
(2010). http://dx.doi.org/10.1002/anie.201001560 ACIEF5 1433-7851 Google Scholar
C. OnogiH. Hamaguchi,
“In vivo resonance Raman detection of ferrous cytochrome c from mitochondria of single living yeast cells,”
Chem. Lett., 39
(3), 270
–271
(2010). http://dx.doi.org/10.1246/cl.2010.270 CMLTAG 0366-7022 Google Scholar
M. Andoet al.,
“1064 nm deep near-infrared (NIR) excited Raman microspectroscopy for studying photolabile organisms,”
Appl. Spectrosc., 65
(5), 488
–492
(2011). http://dx.doi.org/10.1366/10-06196 APSPA4 0003-7028 Google Scholar
C.-K. HuangH. HamaguchiS. Shigeto,
“In vivo multimode Raman imaging reveals concerted molecular composition and distribution changes during yeast cell cycle,”
Chem. Commun., 47
(33), 9423
–9425
(2011). http://dx.doi.org/10.1039/c1cc12350e CHCOFS 1364-548X Google Scholar
H. N. Noothalapati VenkataN. NomuraS. Shigeto,
“Leucine pools in Escherichia coli biofilm discovered by Raman imaging,”
J. Raman Spectrosc., 42
(11), 1913
–1915
(2011). http://dx.doi.org/10.1002/jrs.v42.11 JRSPAF 0377-0486 Google Scholar
L. Chiuet al.,
“On the origin of the Raman band of yeasts; contribution of ergosterol,”
J. Biophotonics, 5
(10), 724
–728
(2012). http://dx.doi.org/10.1002/jbio.201200020 JBOIBX 1864-063X Google Scholar
M. KakitaV. KaliaperumalH. Hamaguchi,
“Resonance Raman quantification of the redox state of cytochromes b and c in-vivo and in-vitro,”
J. Biophotonics, 5
(1), 20
–24
(2012). http://dx.doi.org/10.1002/jbio.v5.1 JBOIBX 1864-063X Google Scholar
V. KaliaperumalH. Hamaguchi,
“Casting new physicochemical light on the fundamental biological processes in single living cells by using Raman microspectroscopy,”
Chem. Rec., 12
(6), 567
–580
(2012). http://dx.doi.org/10.1002/tcr.201200008 CRHEAK 1527-8999 Google Scholar
M. KakitaM. OkunoH. Hamaguchi,
“Quantitative analysis of the redox states of cytochromes in a living L929 (NCTC) cell by resonance Raman microspectroscopy,”
J. Biophotonics, 6
(3), 256
–259
(2013). http://dx.doi.org/10.1002/jbio.v6.3 JBOIBX 1864-063X Google Scholar
A. Nijssenet al.,
“Discriminating basal cell carcinoma from its surrounding tissue by Raman spectroscopy,”
J. Invest. Dermatol., 119
(1), 64
–69
(2002). http://dx.doi.org/10.1046/j.1523-1747.2002.01807.x JIDEAE 0022-202X Google Scholar
L. ZhangM. J. HensonS. S. Sekulic,
“Multivariate data analysis for Raman imaging of a model pharmaceutical tablet,”
Anal. Chim. Acta, 545
(2), 262
–278
(2005). http://dx.doi.org/10.1016/j.aca.2005.04.080 ACACAM 0003-2670 Google Scholar
H.-J. van ManenA. LenferinkC. Otto,
“Noninvasive imaging of protein metabolic labeling in single human cells using stable isotopes and Raman microscopy,”
Anal. Chem., 80
(24), 9576
–9582
(2008). http://dx.doi.org/10.1021/ac801841y ANCHAM 0003-2700 Google Scholar
M. Miljkovićet al.,
“Label-free imaging of human cells: algorithms for image reconstruction of Raman hyperspectral datasets,”
Analyst, 135
(8), 2002
–2013
(2010). http://dx.doi.org/10.1039/c0an00042f ANLYAG 0365-4885 Google Scholar
M. Hedegaardet al.,
“Spectral unmixing and clustering algorithms for assessment of single cells by Raman microscopic imaging,”
Theor. Chem. Acc., 130
(4–6), 1249
–1260
(2011). http://dx.doi.org/10.1007/s00214-011-0957-1 TCACFW 1432-881X Google Scholar
K. E. Shafer-Peltieret al.,
“Model-based biological Raman spectral imaging,”
J. Cell. Biochem., 87
(S39), 125
–137
(2002). http://dx.doi.org/10.1002/(ISSN)1097-4644 JCEBD5 0730-2312 Google Scholar
W. E. Huanget al.,
“Raman microscopic analysis of single microbial cells,”
Anal. Chem., 76
(15), 4452
–4458
(2004). http://dx.doi.org/10.1021/ac049753k ANCHAM 0003-2700 Google Scholar
H. Shinzawaet al.,
“Multivariate data analysis for Raman spectroscopic imaging,”
J. Raman Spectrosc., 40
(12), 1720
–1725
(2009). http://dx.doi.org/10.1002/jrs.v40:12 JRSPAF 0377-0486 Google Scholar
C. A. DrummM. D. Morris,
“Microscopic Raman line-imaging with principal component analysis,”
Appl. Spectrosc., 49
(9), 1331
–1337
(1995). http://dx.doi.org/10.1366/0003702953965326 APSPA4 0003-7028 Google Scholar
J. W. Chanet al.,
“Micro-Raman spectroscopy detects individual neoplastic and normal hematopoietic cells,”
Biophys. J., 90
(2), 648
–656
(2006). http://dx.doi.org/10.1529/biophysj.105.066761 BIOJAU 0006-3495 Google Scholar
Y. Zhouet al.,
“Human brain cancer studied by resonance Raman spectroscopy,”
J. Biomed. Opt., 17
(11), 116021
(2012). http://dx.doi.org/10.1117/1.JBO.17.11.116021 JBOPFO 1083-3668 Google Scholar
D. D. LeeH. S. Seung,
“Learning the parts of objects by non-negative matrix factorization,”
Nature, 401
(6755), 788
–791
(1999). http://dx.doi.org/10.1038/44565 NATUAS 0028-0836 Google Scholar
J. J. AndrewT. M. Hancewicz,
“Rapid analysis of Raman image data using two-way multivariate curve resolution,”
Appl. Spectrosc., 52
(6), 797
–807
(1998). http://dx.doi.org/10.1366/0003702981944526 APSPA4 0003-7028 Google Scholar
A. de JuanR. Tauler,
“Chemometrics applied to unravel multicomponent processes and mixtures—revisiting latest trends in multivariate resolution,”
Anal. Chim. Acta, 500
(1–2), 195
–210
(2003). http://dx.doi.org/10.1016/S0003-2670(03)00724-4 ACACAM 0003-2670 Google Scholar
P. Pereraet al.,
“Solute-induced perturbations of solvent-shell molecules observed using multivariate Raman curve resolution,”
J. Am. Chem. Soc., 130
(14), 45764577
(2008). http://dx.doi.org/10.1021/ja077333h JACSAT 0002-7863 Google Scholar
J. V. SimpsonG. BalakrishnanR. D. Jiji,
“MCR-ALS analysis of two-way UV resonance Raman spectra to resolve discrete protein secondary structural motifs,”
Analyst, 134
(1), 138
–147
(2009). http://dx.doi.org/10.1039/b814392g ANLYAG 0365-4885 Google Scholar
I. I. Patelet al.,
“High contrast images of uterine tissue derived using Raman microspectroscopy with the empty modelling approach of multivariate curve resolution-alternating least squares,”
Analyst, 136
(23), 4950495
–9
(2011). http://dx.doi.org/10.1039/c1an15717e ANLYAG 0365-4885 Google Scholar
K. KwokL. S. Taylor,
“Analysis of counterfeit Cialis tablets using Raman microscopy and multivariate curve resolution,”
J. Pharm. Biomed. Anal., 66 126
–135
(2012). http://dx.doi.org/10.1016/j.jpba.2012.03.026 JPBADA 0731-7085 Google Scholar
R. Tauler,
“Multivariate curve resolution applied to second order data,”
Chemom. Intell. Lab. Syst., 30
(1), 133
–146
(1995). http://dx.doi.org/10.1016/0169-7439(95)00047-X CILSEN 0169-7439 Google Scholar
R. TaulerA. SmildeB. Kowalski,
“Selectivity, local rank, three-way data analysis and ambiguity in multivariate curve resolution,”
J. Chemom., 9
(1), 31
–58
(1995). http://dx.doi.org/10.1002/(ISSN)1099-128X JOCHEU 0886-9383 Google Scholar
M. Jalali-HeraviH. Parastar,
“Recent trends in application of multivariate curve resolution approaches for improving gas chromatography-mass spectrometry analysis of essential oils,”
Talanta, 85
(2), 835
–849
(2011). http://dx.doi.org/10.1016/j.talanta.2011.05.045 TLNTA2 0039-9140 Google Scholar
S. BijlsmaA. K. Smilde,
“Application of curve resolution based methods to kinetic data,”
Anal. Chim. Acta, 396
(2–3), 231
–240
(1999). http://dx.doi.org/10.1016/S0003-2670(99)00442-0 ACACAM 0003-2670 Google Scholar
K. Awaet al.,
“Self-modeling curve resolution (SMCR) analysis of near-infrared (NIR) imaging data of pharmaceutical tablets,”
Anal. Chim. Acta, 619
(1), 81
–86
(2008). http://dx.doi.org/10.1016/j.aca.2008.02.033 ACACAM 0003-2670 Google Scholar
J. M. AmigoC. Ravn,
“Direct quantification and distribution assessment of major and minor components in pharmaceutical tablets by NIR-chemical imaging,”
Eur. J. Pharm. Sci., 37
(2), 76
–82
(2009). http://dx.doi.org/10.1016/j.ejps.2009.01.001 EPSCED 0928-0987 Google Scholar
B. O. BudevskaS. T. SumT. J. Jones,
“Application of multivariate curve resolution for analysis of FT-IR microspectroscopic images of in situ plant tissue,”
Appl. Spectrosc., 57
(2), 124
–131
(2003). http://dx.doi.org/10.1366/000370203321535015 APSPA4 0003-7028 Google Scholar
M. GarridoF. X. RiusM. S. Larrechi,
“Multivariate curve resolution-alternating least squares (MCR-ALS) applied to spectroscopic data from monitoring chemical reactions processes,”
Anal. Bioanal. Chem., 390
(8), 2059
–2066
(2008). http://dx.doi.org/10.1007/s00216-008-1955-6 ABCNBP 1618-2642 Google Scholar
W. F. J. Vermaaset al.,
“In vivo hyperspectral confocal fluorescence imaging to determine pigment localization and distribution in cyanobacterial cells,”
Proc. Natl. Acad. Sci. U. S. A., 105
(10), 4050
–4055
(2008). http://dx.doi.org/10.1073/pnas.0708090105 PNASA6 0027-8424 Google Scholar
W. Windig,
“Self-modeling mixture analysis of spectral data with continuous concentration profiles,”
Chemom. Intell. Lab. Syst., 16
(1), 1
–16
(1992). http://dx.doi.org/10.1016/0169-7439(92)80073-D CILSEN 0169-7439 Google Scholar
J.-H. JiangY. Ozaki,
“Self-modeling curve resolution (SMCR): principles, techniques, and applications,”
Appl. Spectrosc. Rev., 37
(3), 321
–345
(2002). http://dx.doi.org/10.1081/ASR-120014359 APSRBB 0570-4928 Google Scholar
H. Gamppet al.,
“Calculation of equilibrium constants from multiwavelength spectroscopic data—III: model-free analysis of spectrophotometric and ESR titrations,”
Talanta, 32
(12), 1133
–1139
(1985). http://dx.doi.org/10.1016/0039-9140(85)80238-1 TLNTA2 0039-9140 Google Scholar
W. WindigJ. Guilment,
“Interactive self-modeling mixture analysis,”
Anal. Chem., 63
(14), 1425
–1432
(1991). http://dx.doi.org/10.1021/ac00014a016 ANCHAM 0003-2700 Google Scholar
S. WildJ. CurryA. Dougherty,
“Improving non-negative matrix factorizations through structured initialization,”
Pattern Recognit., 37
(11), 2217
–2232
(2004). http://dx.doi.org/10.1016/j.patcog.2004.02.013 PTNRA8 0031-3203 Google Scholar
M. W. Berryet al.,
“Algorithms and applications for approximate nonnegative matrix factorization,”
Comput. Stat. Data Anal., 52
(1), 155
–173
(2007). http://dx.doi.org/10.1016/j.csda.2006.11.006 CSDADW 0167-9473 Google Scholar
C. BoutsidisE. Gallopoulos,
“SVD based initialization: a head start for nonnegative matrix factorization,”
Pattern Recognit., 41
(4), 1350
–1362
(2008). http://dx.doi.org/10.1016/j.patcog.2007.09.010 PTNRA8 0031-3203 Google Scholar
P. PaateroU. Tapper,
“Positive matrix factorization: a non-negative factor model with optimal utilization of error estimates of data values,”
Environmetrics, 5
(2), 111
–126
(1994). http://dx.doi.org/10.1002/(ISSN)1099-095X 1180-4009 Google Scholar
P. O. Hoyer,
“Non-negative matrix factorization with sparseness constraints,”
J. Mach. Learn. Res., 5 1457
–1469
(2004). 1532-4435 Google Scholar
P. PaateroU. Tapper,
“Positive matrix factorization—a nonnegative factor model with optimal utilization of error estimates of data values,”
Environmetrics, 5
(2), 111
–126
(1994). http://dx.doi.org/10.1002/(ISSN)1099-095X 1180-4009 Google Scholar
C.-K. Huanget al.,
“Disentangling dynamic changes of multiple cellular components during the yeast cell cycle by in vivo multivariate Raman imaging,”
Anal. Chem., 84
(13), 5661
–5668
(2012). http://dx.doi.org/10.1021/ac300834f ANCHAM 0003-2700 Google Scholar
S. TiwariM. AndoH. Hamaguchi,
“Investigation of organelle-specific intracellular water structures with Raman microspectroscopy,”
J. Raman Spectrosc., 44
(2), 167
–169
(2013). http://dx.doi.org/10.1002/jrs.v44.2 JRSPAF 0377-0486 Google Scholar
P. Ball,
“Water as an active constituent in cell biology,”
Chem. Rev., 108
(1), 74
–108
(2008). http://dx.doi.org/10.1021/cr068037a CHREAY 0009-2665 Google Scholar
|