
|
|
1.IntroductionArticular cartilage (AC) covers the bony end of synovial joints to provide a sliding surface with extremely low friction and attenuate the high pressure from body locomotion. AC is structurally organized into four visible zones from the surface to subchondral bone: superficial, middle, deep and calcified zones, in terms of the concentration of proteoglycans (PGs), the orientations of collagen fibrils and the morphology of chondrocytes.1 The zonal structure is fundamental for maintaining the normal physiological functions of AC.2 Therefore, the depth-dependent properties of AC were systematically studied to investigate the degeneration mechanism and the repair approaches. Various physical parameters were involved in the studies of the depth-dependent properties of AC including compression,3,4 tensile strength,5 shear behavior,6 osmotic swelling,7 ultrasound,8,9 and X-ray scattering.10 The mechanical parameters were mainly used to assess the mechanical performance of AC under different loading circumstances. Those nonmechanical parameters were treated as indicators to indirectly quantify the zonal reactions of AC tissue to the harsh loading spectrum in synovial joints. As one of the key optical properties, the refractive index (RI) of AC and its depth-dependent property were rarely reported. The RI characterizes the manner that light interacts with the materials along the propagating path.11 Therefore, the RI of AC is intimately associated with the microstructure and constitutions of the extracellular matrix. The scattering and anisotropic natures of AC determine the uneven distribution of RI.12,13 Both the biochemical and morphological variances induced by AC degeneration could alter the RI gradient from the articular surface to the deep zone. The depth distribution of RI could potentially be used to monitor the pathological progress of AC. In particular, the RI distribution of AC could help to clinically diagnose osteoarthritis (OA) in early stage when the visual assessment using arthroscopy hardly works. Confocal microscopy was utilized in some studies to measure the tiny deformations of the AC samples applied with various mechanical and biochemical conditions.6,14,15 However, the RI mismatch between the AC specimen and the confocal system can deform the images along the optical axis.16 The RI distribution of AC should be considered in such studies to minimize the errors induced by the mismatched RI. There have been some specialized techniques proposed for determining the RI of various mammalian tissues.17–21 However, these methods have their limitations to be applied to the RI distribution of AC, such as the large amount of sample consumption or the difficulty to determine the RI within a small spot. The only previous work about the depth-dependent RI distribution of AC was based on an optical coherent tomography (OCT).22 The RI was measured in three different depths of the AC plug with an interval of 0.5 mm. Since the general thickness of health AC is about 1.0 to 2.5 mm depending on the positions and species,23 0.5-mm-thick AC layer is not sufficiently thin to characterize the exact RI distribution with depth. Furthermore, the progress of calcification makes the total thickness of the uncalcified cartilage even thinner, which requires the RI to be measured more intensively from articular surface. Our previous study proposed a reliable and accurate technique to measure the RI of AC within thin layers,24 which was adopted in the present study to thoroughly investigate the depth-dependent property of RI for the AC collected from femoral condyles of adult sheep. The RI was measured from the articular surface to the deep zone in an interval of about 50 μm. The calcified zone was not included because this zone barely transmits visible light. The corresponding histological images were assessed to explore the association with the RI distributions. 2.Materials and Methods2.1.Specimen PreparationWithin 2 h of slaughter, six femoral condyles were harvested from female sheep of 5 years old. Prior to AC collection, the articular surface of each femoral condyle was visually inspected to ensure the absence of OA.25 Four cylindrical AC plugs attached with subchondral bones () were punched from the load bearing region of each femoral condyle. Despite only six joints being used, a total of 24 AC plugs were collected for the experiment. All AC plugs were then manually cut into two halves along the cylinder axis. One half of the AC plug would be used for RI measurement. The other half for histological section was fixed in 10% neutral buffered formalin solution for 24 h. Once the fixation was completed, the AC samples were immersed in phosphate-buffered saline solution (pH 7.4) to prevent PGs diffusion into fixative.26 The semicylindrical AC plug used for RI measurement was first embedded in O.C.T. (Tissue-Tek O.C.T. Compound, Sakura Finetek USA, Inc., Torrance, CA) and then fast frozen with liquid nitrogen. With a cryomicrotome (Leica cryostat CM3050S, Leica Microsystems, Wetzlar, Germany) maintaining at , the frozen AC plug was transversely sectioned into semicircular discs of 50-μm thick. A series of AC discs, which covered the depth from the articular surface to the end of uncalcified region, were indexed to record the exact depths. 2.2.Confocal Scan and RI CalculationThe sectioned AC disc was stained with Rhodamine B for 1 min and carefully spread on an electrostatically adhesive slide (Superfrost Plus, Lomb Scientific Ltd., Taren Point, Australia). The deeper side of the AC disc was against the slide to ensure the consistence of light propagation in all confocal scans. A drop of immersion oil (Type F, , Leica Microsystems, Wetzlar, Germany) slightly stained with Rhodamine B was placed next to the AC disc. A coverslip was carefully covered on the two specimens so that they could have the same thickness (Fig. 1). Once the redundant immersion oil was squeezed out, the coverslip was sealed for confocal scan. Fig. 1Schematic diagram of sample arrangement. The shapes of the AC disc and the immersion oil were simplified as rectangles. The three scanning spots were noted in the top view diagram.  A standard confocal microscope (Leica TCS SP2 AOBS, Leica Microsystems, Wetzlar, Germany) equipped with an oil immersion objective (Plan Apochromate, and ) was used for image collection. The sample was excited with a 561-nm diode-pumped solid-state laser and the emission fluoresce was recorded through a 550 to 595 nm bandpass filter. Three spots on the intersection region of the AC disc and immersion oil were scanned (Fig. 1). The scanning spot was corresponding to an image of . The scanning plane was shifted along the optical axis of the objective with a step size of 0.47 μm. The image process and RI calculation were completely identical to our previous work.24 The average RI of the three scanning spots was used as the RI of that AC disc, which further corresponded to the RI of a specific depth in the AC plug. By repeating the same procedure on all AC discs sectioned from the AC plug, a series of RI data coupled with the depth data were acquired. 2.3.Quantification of RI FluctuationThe discrete RI data and the corresponding depths were approximated to a smooth RI-depth curve. Two different aspects of the RI–depth curve were characterized to quantify the RI fluctuation with depth. One parameter was the amplitude of RI fluctuation () which was featured as the extent between the global maximum and minimum of the RI–depth curve. The other parameter was the total number of local maxima and minima that appeared in the RI–depth curve () which indicted how frequently the RI fluctuated. However, the number of local extrema is not directly comparable between AC plugs because the AC plugs had different thicknesses. Considering the AC thickness, the frequency of RI fluctuation could be quantified as the average width of the subinterval () divided by the local extrema of the RI–depth curve Here, is the thickness of an AC plug. The denominator of Eq. (1) is the number of subintervals in the RI–depth curve divided by the local extrema. If a RI–depth curve is thinner or has more local extrema, the corresponding will be lower, which means the local extrema are more densely exhibited in the RI–depth curve. The coefficient of RI fluctuation () was proposed to comprehensively quantify the amplitude and frequency of RI fluctuation as is a balanced coefficient that estimates the RI fluctuation with combined effects of frequency and amplitude. A high indicates the RI intensively fluctuated in a wide extent. 2.4.Histology AssessmentThe semicylindrical AC plugs retained for histology were decalcified in rapid decalcifier (RDO Rapid Decalcifier, Apex Engineering Products, Aurora, IL) for 5 h and automatically dehydrated in a tissue processor (Leica ASP 200, Leica Microsystems, Wetzlar, Germany). Thereafter, the half AC plugs were embedded in paraffin blocks and sectioned perpendicular to the cartilage surface with a thickness of 5 μm (Leica RM2255 rotary microtome, Leica Microsystems, Wetzlar, Germany). To determine the pathological progress in the AC tissue used for RI measurement, only the AC slices next to the confocal scanning spots were selected to stain with 0.1% Safranin O and 0.02% Fast Green.27 Safranin O is a cationic dye which can bind to glycosaminoglycans (the side chains of PG macromolecules) in the extracellular ground substance of AC. Thus, the Safranin O—Fast Green staining protocol has been widely used as a marker for PG loss.28 After staining, the AC slices were rinsed in 95% ethanol and mounted in slides. All histological sections were automatically imaged by a bright-field digital slide scanner with a dry objective (ScanScope AT, Aperio, Vista, CA). The histopathology of the AC plugs was subjectively assessed with Osteoarthritis Research Society International (OARSI) system,26 primarily focusing on matrix organization, chondrocytes, and PG degradation. The PG contents were also quantified by calculating the intensity of red color in the histological images which was reported proportional to the wet weight fraction of PGs determined in a biochemical way.29,30 An examining region in the histology image was manually selected between the AC surface and the tide mark. For each pixel located in the examining region, the perception of red component () was determined with Eq. (3) based on the RGB color model Here , , and represented the intensity of red, green, and blue of the pixel, respectively. If , the red component of this pixel was treated with no Safranin O stain and the corresponding was set to 0. The average intensity of the red color () was calculated for all pixels locating in the examining region. The coefficient of PG loss () was determined by If , the PG contents in the corresponding AC slice were severely depleted so that no PG macromolecules could be stained by Safranin O. A very low indicated that little PG loss could be examined in the AC slice. However, was just linearly correlated to the wet weight fraction of PGs rather than the exact percentage of the PG contents lost from the AC matrix. The average was calculated from a series of histological images to reliably estimate the PG loss of an AC plug. 2.5.Statistical ProcessThe average RI of each AC plug and the corresponding standard deviation were calculated to assess the RI diversity among samples. The AC plugs were categorized based on the features of RI distributions. The average RI, coefficient of RI fluctuation, and coefficient of PG loss were compared among different types of RI distribution. Single-factor analysis of variance (ANOVA) (OriginPro 8 SR4, OriginLab, Orthampton, MA) was applied to each AC plug to test whether the RI data measured from different depths were significantly different (significant level ). The average RI of AC plug was estimated with single-factor ANOVA () to examine whether the RI was significantly different among the AC plugs. Fisher’s least significant difference (LSD) method was used for the multiple comparisons of the average RI between any two AC plugs. 3.Results3.1.Overall RI and Statistical ResultsThe average RI of each AC plug and the corresponding standard deviation were shown in the bar chart (Fig. 2). The AC plugs were sorted by the thickness which was exhibited as the black dot embedded in each bar. A total of 23 AC plugs were successfully measured in the current study. Most of the AC plugs (from plugs 3 to 18) had thicknesses within the range of 350 to 500 μm. Two AC plugs were thinner than 250 μm and five AC plugs were thicker than 550 μm. Fig. 2Average RI and uncalcified thickness of AC plug. Each vertical bar represents the average RI of one AC plug and the error bar indicates the corresponding standard deviation. The AC plugs were sorted by the uncalcified thickness which was shown as the black dot.  The overall RI of all AC plugs is . The thickest AC plug has the lowest average RI (, plug 23), whereas the AC plug with the highest average RI (, plug 6) was in the range of medium thickness (379.75 μm). The single-factor ANOVA test showed that the average RI of the AC plug was significantly different (). However, the multiple comparisons of the 23 AC plugs revealed that the RI difference was not necessarily significant between any two of these AC plugs. 3.2.Types of RI Distribution and Histological AssessmentFor each AC plug, the RI was significantly different with depth (). All of the 23 RI–depth curves showed visible fluctuations despite that the fluctuating features were different. Nine RI–depth curves distributed as gentle ramps extending from the articular surface to deep zone. Among these nine samples, six curves were upward and the other three curves had downward tendencies. Four RI–depth curves revealed obvious arch shapes. The RI of arch type distribution gradually increased from the surface, peaked in the middle depth, and decreased thereafter. In addition to these 13 RI–depth curves with regular distributions, the other 10 curves fluctuated as irregular waveforms. This type of RI distribution had two or more local extrema and distinctive fluctuating features. The typical examples of RI distribution and the corresponding histological images were shown in Fig. 3. Fig. 3Examples of RI–depth curves and the corresponding histological images. The solid dots are the original RI data of different depths and the error bars indicate the corresponding standard deviation. The left side of the histological image is the articular surface. The five examples represent the typical RI distributions of upward ramp (a), downward ramp (b), arch (c) and waveform (d and e). The PG contents were normal in the first three examples (a, b and c) but lost as early OA in the other two examples (d and e).26  In the two examples of ramp type RI–depth curve [Figs. 3(a) and 3(b)], the RI persistently decreased (1.4466 to 1.4159) and increased (1.4232 to 1.5003) with depth, respectively. Despite that the RI locally fluctuated in these two examples, the main trends were still monotonic ramps. The corresponding histological images indicated that the PG contents were retained in high concentrations. There were no visible chondron distortions or surface abrasion. However, the absence of chondrocyte nuclei was occasionally observed in the latter example [Fig. 3(b)]. In the example of arch RI distribution [Fig. 3(c)], the RI on the articular surface was 1.4689 and the maximum RI of 1.4740 appeared in the depth of 134.41 μm which accounted for 32.2% of the entire uncalcified thickness. The RI thereafter decreased to 1.4430 in the deepest region. The histological image of this example showed no noticeable damage on the surface and the tidemark was clear without overlaps. The PG contents in all zones were in normal levels. The two curves shown in Figs. 3(d) and 3(e) were typical waveform RI distributions. In Fig. 3(d), the RI waved as a cosine-like function. The minimum RI (1.4280) was in the depth of 135.69 μm and the peak RI (1.5085) appeared in the depth of 333.69 μm. The other waveform example [Fig. 3(e)] had completely different features. The RI gradually rose from 1.3952 to the maximum of 1.4764 in middle depth (269.50 μm) and fluctuated locally but decreased to 1.4007 at the deep end. Typical features of early OA (Ref. 26) presented in the histological images of these two waveform examples. There were some tiny matrix defects parallel to the AC surface. Distorted chondrocytes appeared in both middle and deep zones. The sporadic absence of nuclei in the deep zone implied the partial apoptosis of chondrocytes. The tidemarks were obscure, discontinuous, and overlapped because of the expanded calcified zones. The PG loss was presented in all zones, particularly the upper middle zone. The microscopic inspection of histology showed that all of the 13 AC plugs with regular RI distribution had distinct zonal arrangement and appropriately organized chondrocytes. Surface abrasion, superficial fibrillation, or proliferative changes of chondrocytes were barely observed. The PG content was well stained by Safranin O indicating little PG degradation. For the other 10 AC plugs measured with waveform RI distributions, however, early pathological development was assessed although mechanical lesions were seldom detected. Visible focal rarefaction and condensation of collagen fibrils existed in the superficial zone or upper middle zone, suggesting cartilage edema and PG loss. According to the OARSI histopathology assessment system,26 the 23 AC plugs used in this study provided sufficient examples covering both physiologically health (Grade 0) and early OA statuses (Grades 1 to 2). 3.3.Quantified RI Fluctuation and PG LossThe coefficients of RI fluctuation and the coefficients of PG loss were plotted together in Fig. 4 and were linearly regressed with 95% confidence bounds. The square of correlation coefficient () was only 0.65 and the -test showed that there was no significant linear correlation between the PG loss and the RI fluctuation. The two dashed lines in Fig. 4 divided the data into two main clusters. The 10 solid dots located in the upper right region represented the 10 AC plugs classified as waveform type of RI distribution. The coefficients of RI fluctuation and the corresponding coefficients of PG loss of these 10 dots were higher than 0.48 and 0.60, respectively. The 12 data points located in the lower left corner of Fig. 4 were detected with regular RI distributions (upward ramp, downward ramp, and arch). The coefficients of RI fluctuation and the coefficients of PG loss of these 12 samples were lower than 0.35 and 0.50, respectively. Only one sample (plug 4, upward ramp type) was found with observable PG loss (0.62) but low RI fluctuation (0.12). Fig. 4Coefficient of RI fluctuation respecting to coefficient of PG loss. The hollow circles, hollow squares, solid triangles, and solid dots represent the AC plugs classified as the RI distributing types of arch, upward ramp, downward ramp, and waveform, respectively. The solid line is the result of linear regression (, ). 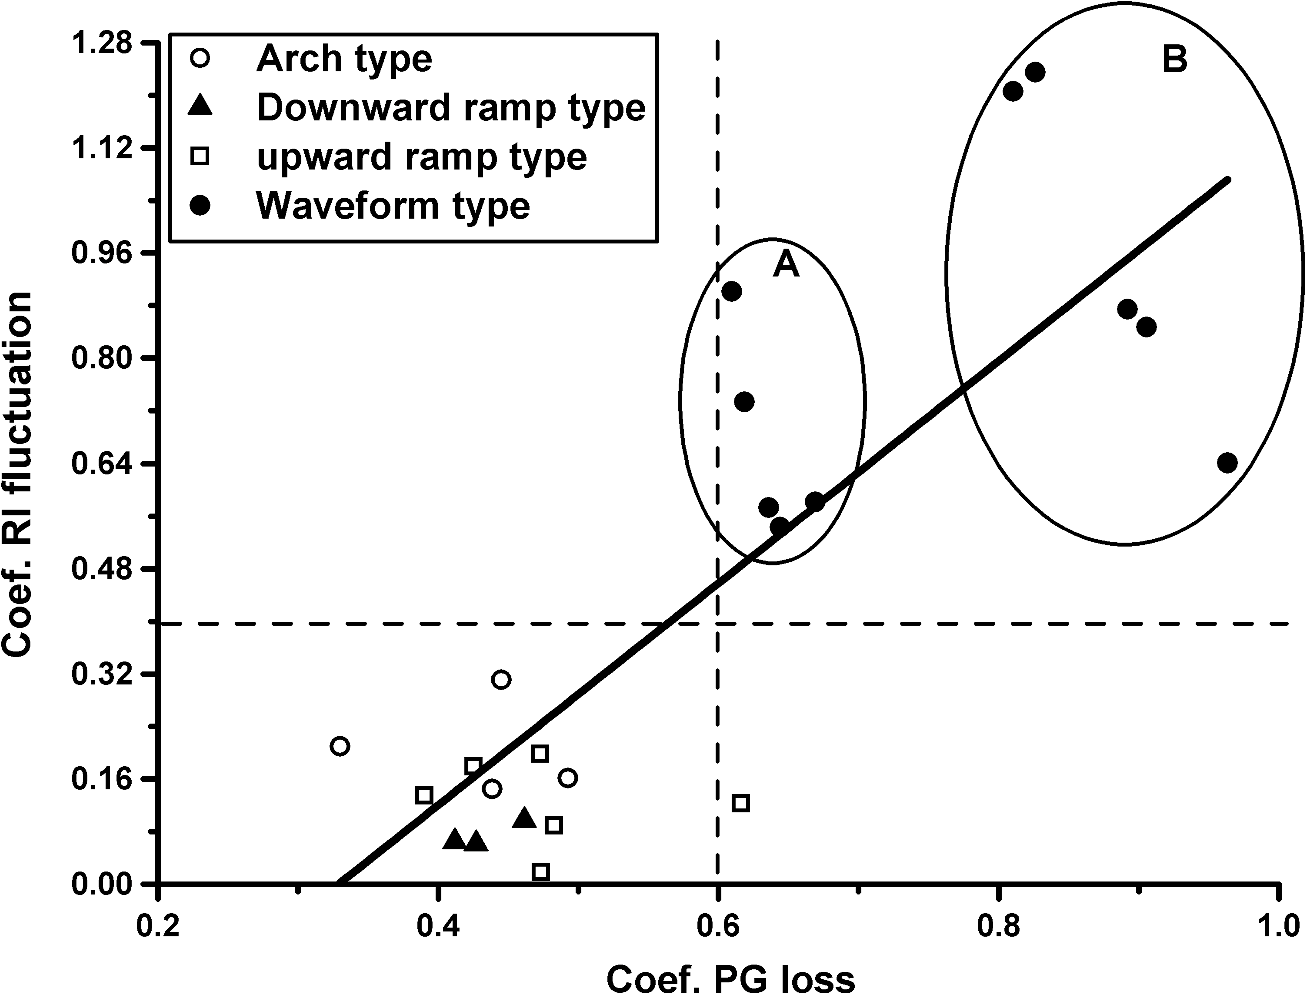 A statistical comparison based on the types of RI distribution was summarized in Table 1. The four types of RI distribution had close average RI, whereas the average RI of arch type was slightly higher. The AC plugs of downward ramp type had a relatively thin thickness and narrow amplitude of RI fluctuation. Its coefficient of RI fluctuation was also the lowest compared with the other three types of RI distribution. The average thicknesses of AC plugs classified as upwards, arch, and waveform were similar to each other. The AC plugs of waveform type had the highest PG loss and the severest RI fluctuation. Table 1Characteristics of the AC plugs grouped by the types of refractive index (RI) distribution.
Note: The AC plugs were grouped by the types of RI distribution. The number of AC plugs belonging to each type was listed. The characteristics of the AC plugs were calculated based on an average view of each type of RI distribution. 4.Discussion4.1.Inconsistent Overall RIAs one of the fundamental optical parameters, RI is intimately related to the composition and microstructure of AC.31 Since the proportions of different compositions in AC vary from individual to individual,32 the RI data acquired from different sample resources are different, which is demonstrated by the inconsistent results previously reported in the limited number of studies. The overall RI measured from the current study is , whereas the other study using bovine patellae AC acquired an average RI of .22 The gap between these two studies may be attributed to the different species and measuring techniques. Even for the same species and technique, the inconsistency of RI still exists. Our previous work reported that the overall RI of the AC collected from the femoral condyles of newborn lambs was .24 Compared with the current study, the RI of femoral AC has a growth of 3.36% from the newborn to mature stages. The possible reason is the high proportion of water contents and little development of calcification in the newborn AC,33 which enables better optical transparency. Our previous study demonstrated that the average RI measured from the AC plug of newborn lamb was similar between the samples.24 It may be because the diversities of structure and composition rarely occurred on this initial stage of tissue differentiation. However, the present study revealed significant difference among the average RI of adult AC, indicating the increased diversity of physiological status in mature AC. The LSD multiple comparisons revealed that even for the AC plugs collected from the same condyle, the significant different RI could still exist. The AC plugs with thinner uncalcified thicknesses were generally accompanied with higher average RI (Fig. 2, AC plugs 1 to 6), whereas those thicker AC plugs could have either high or low RI (plugs 7 to 23). Since the AC samples were harvested from the same positions on the femoral condyles and the sheep were fed under identical conditions, the diverse cartilage thicknesses due to collecting positions23 had been minimized. Considering the anisotropic property of AC,34,35 all confocal scans were implemented with the same light propagating orientation to maximally eliminate the artifacts of the measured RI. Therefore, the inconsistent calcification of AC should be considered as a factor leading to RI inconsistency. The calcifying progress generally leads to the tissue fibrillation and loss of water contents, which could alter the light propagation. 4.2.RI Distribution with DepthThe current study classified the RI distributions into four categories according to the shapes of the RI–depth curves. The first three types of the RI distribution are regular and contain less local fluctuations. The upward ramp type and the arch type actually are similar RI distributions. The amplitudes of RI fluctuation are close for these two types (Table 1) and the difference is only the exact depths of the maximum RI. The RI data of downward ramp type vibrated in narrow extents and could be approximated as constant distributions. The histological images of the first three types of RI distribution rarely exhibited visible pathological degeneration [Figs. 3(a)–3(c)]. Therefore, the RI of normal adult AC should distribute as a regular ramp or arch with depth and the highest RI appears in the middle–deep region. The RI distributing features of normal AC could be interpreted with the unique zonal structure and composition of cartilage matrix. The density of hydrated AC was determined as an increasing function with depth.7,9 In particular, the water content of normal adult AC decreases from superficial zone to deep zone.36 The RI of water content is close to 1.33, whereas the dry collagen fibrils have a higher RI of 1.53.37 This special biochemical constitution of normal AC enables the increasing trend of RI along depth direction. The orientation of collagen contents has strong influence to the light propagation.38 The oblique and irregular organization of collagens in the middle zone of AC (the middle 40 to 60% depth) could impede the original propagating path of light, which possibly makes the RI peak in the middle–deep region. The waveform type of RI distribution is characterized as strong irregular RI fluctuation which cannot be universally expressed with simple mathematical functions because the specific RI fluctuations vary from sample to sample. Even for the AC plugs with similar histological statuses, the RI still fluctuated in its unique way [Figs. 3(d) and 3(e)]. The corresponding histological images of the 10 AC plugs with waveform RI distribution showed visible features of early OA, such as PG loss, chondrocytes distortion, and tiny mechanical abrasion. This subjective inspection in the basis of AC histology initially demonstrated that the RI distribution with depth could be altered by the pathological progress in cartilage matrix. The RI measuring technique adopted in this study was already demonstrated with sufficient high accuracy.24 But unexpected artifacts still may be induced in the measured RI distribution. Since the RI of AC was measured within a thin tissue layer with finite thickness, it actually represented the average RI within this AC layer. The exact RI distribution with depth is hard to acquire, but it can be well approximated by using a small step size of measurement. In this study, the RI specifying to a depth actually represents the average RI within a cuboid tissue about . Besides, the cryomicrotomy process may trim the most superficial layer off so that the RI–depth curve actually starts from a depth slightly deeper than the articular surface (). The other potential error is that the tissue used for histology cannot ideally be the original tissue with RI measured. To best match the histology assessment with the RI distribution, the AC tissue next to the scanning spot was collected for histological slices. Since the AC slice for histology is only 5 μm, the pathological diversity between the tissues used for RI measurement and histology has been minimized. Up to our knowledge, optical parameters were rarely involved in the studies of the depth-dependent properties of AC. In the OCT-based study, the highest RI of normal AC was detected in the deep layer, which actually referred to the average RI within the deepest one-third thickness of the AC sample.22 Our study had the consistent result that the RI of normal AC peaked in the middle–deep region. The depth distribution of birefringence was also studied with polarized microscopy because it is closely related to the density and orientation of collagen fibrils.38–41 The birefringence of normal AC decreased from the articular surface but increased throughout the deep zone until it peaked in the tidemark.42 However, for the AC samples collected from dogs with running training, the birefringence in both superficial and deep zones decreased almost a quarter compared with the controls.39 These previous studies suggested that the birefringence of AC could be changed once the organization of the collagen meshwork was altered by external loads. Accordingly, the RI distribution should also react to the zonal orientation and disorganization of collagen fibrils. The depth-dependent mechanical properties of AC were already comprehensively investigated. It is well known that the tensile and shear properties of AC are mainly determined by the collagen meshwork and the compressive stiffness is predominantly related to PGs.42,43 The PG content of normal AC increases with depth,36,44 which enables the depth increase of compressive modulus.3,44,45 It implies the potential connection between the RI and the mechanical properties of AC. All of these depth-dependent properties of AC demonstrate that the zonal structure has fundamental influence to the performance of AC and also provides the key basis for detecting AC degeneration. 4.3.RI Fluctuation and Pathological ProgressTo determine the potential correlation between RI distribution and OA progress, a quantitative technique was adopted in the estimation of PG loss. For normal AC (lower left corner of Fig. 4), the coefficient of RI fluctuation was low and insensitive to the PG concentration. This is because the PG loss in normal AC is maintained in similar levels and hence, the RI fluctuations measured from these samples are similar. However, other factors, such as the development of calcification and the proportions of different matrix compositions, could induce slight diversity in RI fluctuations. In the upper right region of Fig. 4, the 10 AC plugs were detected with waveform of RI distribution and distributed as two separated groups (circled as Group A and Group B). Despite the similar average RI of these two groups, the average PG loss of Group B is 37.50% higher than Group A, but the coefficient of RI fluctuation measured from Group B is averagely 43.28% higher than Group A (Table 2). Comparing the PG loss and RI fluctuation in normal AC, Group A and Group B, it is reasonable to conclude that the severity of RI fluctuation increases with the proportion of PG loss. However, the coefficient of RI fluctuation may still have difficulty in distinguishing the pathological progress of two AC samples in which the PG loss does not sufficiently differ. There is only one AC plug which has very low RI fluctuation as well as a relative high level of PG loss (Fig. 4), but the single exception is insufficient to deny the correlation between RI fluctuation and PG loss. Table 2Comparison of the normal and degenerated articular cartilage (AC).
Note: Two separated groups of AC plugs classified as waveform type of RI distribution and the 10 normal AC plugs were compared (as marked in Fig. 4). The average RI, PG loss (CPG), and RI fluctuation (CRI) were summarized, respectively. The correlation of PG loss and RI fluctuation outlined above is based on an average view. For individual AC sample, PG loss is not the only factor that influences the RI fluctuation of AC. Other factors, such as AC thickness and collagen origination, could also alter the RI distribution with depth. Therefore, AC plugs with higher PG loss could even have lower RI fluctuations than those AC plugs with less PG loss (Fig. 4). Despite the difficulty to isolate the exact impact of a single factor to RI fluctuation of AC, the coefficient of RI fluctuation proposed in this study can correctly distinguish the AC samples with initial pathological degenerations from the normal cartilages, which suggests the potential to detect OA in early stage. PG concentration has been treated as a standard indicator to grade the development of OA.25,26,46 Since the coefficient of RI fluctuation demonstrated the capability to detect the PG loss of AC, it could be potentially incorporated into preclinical applications. In particular, the histological assessment shows that the AC samples are either healthy or merely degenerated in early stage, which suggests the potential of RI fluctuation for the diagnose of early OA. The RI measuring technique utilized in this study is possible to be developed into an in vivo method by accurately manipulating the lens motion of a confocal arthroscopy. In this way, the RI distribution can be acquired with minimum injury to cartilage. Further work is to establish the thorough correlation between the depth distribution of the RI and the AC samples histologically assessed with various grades of OA. 5.ConclusionsThe present study investigated the influence of pathological progress, especially PG loss, to the RI distribution of AC. The tissue differentiation from newborn stage to adult period can increase the overall RI of AC. For mature AC, both the overall RI and the RI distribution vary with samples. The RI of normal AC distributes as a regular ramp or arch and peaks in the middle–deep region. The early degenerated AC samples have remarkable and various RI fluctuations. The progress of PG loss can aggravate the RI fluctuation. Therefore, the quantitative RI fluctuation potentially provides a new approach to detect the pathologically degeneration in AC, especially for early OA. Further work is required to clarify the exact interacting mechanism between the biochemical alterations and the RI distribution of AC. AcknowledgmentsThe authors acknowledge the facilities, scientific and technical assistance of the Australian Microscopy & Microanalysis Research Facility at the Centre for Microscopy, Characterization & Analysis, the University of Western Australia, a facility funded by the University, State and Commonwealth Governments. The authors would like to thank the assistance of CELLCentral of the University of Western Australia for the sample preparation and histology. ReferencesB. WeightmanG. E. Kenpson,
“Load carriage,”
Adult Articular Cartilage, 291
–331 Pitman Medical, London
(1979). Google Scholar
E. B. HunzikerT. M. QuinnH. J. Häuselmann,
“Quantitative structural organization of normal adult human articular cartilage,”
Osteoarthritis and Cartilage, 10
(7), 564
–572
(2002). http://dx.doi.org/10.1053/joca.2002.0814 OSCAEO 1063-4584 Google Scholar
R. M. Schinaglet al.,
“Depth-dependent confined compression modulus of full-thickness bovine articular cartilage,”
J. Orthop. Res., 15
(4), 499
–506
(1997). http://dx.doi.org/10.1002/(ISSN)1554-527X JOREDR 0736-0266 Google Scholar
T. J. Kleinet al.,
“Depth-dependent biomechanical and biochemical properties of fetal, newborn, and tissue-engineered articular cartilage,”
J. Biomech., 40
(1), 182
–190
(2007). http://dx.doi.org/10.1016/j.jbiomech.2005.11.002 JBMCB5 0021-9290 Google Scholar
M. CharleboisM. D. McKeeM. D. Buschmann,
“Nonlinear tensile properties of bovine articular cartilage and their variation with age and depth,”
J. Biomech. Eng., 126
(2), 129
–137
(2004). http://dx.doi.org/10.1115/1.1688771 JBENDY 0148-0731 Google Scholar
M. R. Buckleyet al.,
“Mapping the depth dependence of shear properties in articular cartilage,”
J. Biomech., 41
(11), 2430
–2437
(2008). http://dx.doi.org/10.1016/j.jbiomech.2008.05.021 JBMCB5 0021-9290 Google Scholar
H. LipshitzR. EtheredgeM. J. Glimcher,
“Changes in the hexosamine content and swelling ratio of articular cartilage as functions of depth from the surface,”
J. Bone Joint Surg. Am., 58
(8), 1149
–1153
(1976). Google Scholar
Y. P. Zhenget al.,
“An ultrasonic measurement for in vitro depth-dependent equilibrium strains of articular cartilage in compression,”
Phys. Med. Biol., 47
(17), 3165
(2002). http://dx.doi.org/10.1088/0031-9155/47/17/308 PHMBA7 0031-9155 Google Scholar
S. G. Patilet al.,
“Measurement of depth-dependence and anisotropy of ultrasound speed of bovine articular cartilage in vitro,”
Ultrasound Med. Biol., 30
(7), 953
–963
(2004). http://dx.doi.org/10.1016/j.ultrasmedbio.2004.04.009 USMBA3 0301-5629 Google Scholar
C. J. Mogeret al.,
“Regional variations of collagen orientation in normal and diseased articular cartilage and subchondral bone determined using small angle X-ray scattering (SAXS),”
Osteoarthritis Cartilage, 15
(6), 682
–687
(2007). http://dx.doi.org/10.1016/j.joca.2006.12.006 1063-4584 Google Scholar
M. BornE. Wolf, Principles of Optics: Electromagnetic Theory of Propagation, Interference and Diffraction of Light, Cambridge University Press, Cambridge, UK
(1999). Google Scholar
D. W. Ebertet al.,
“Articular cartilage optical properties in the spectral range 300–850 nm,”
J. Biomed. Opt., 3
(3), 326
–333
(1998). http://dx.doi.org/10.1117/1.429893 JBOPFO 1083-3668 Google Scholar
V. V. Tuchin, Optical Clearing of Tissues, and Blood, SPIE PressBellingham, WA,2005). Google Scholar
J. B. Choiet al.,
“Zonal changes in the three-dimensional morphology of the chondron under compression: The relationship among cellular, pericellular, and extracellular deformation in articular cartilage,”
J. Biomech., 40
(12), 2596
–2603
(2007). http://dx.doi.org/10.1016/j.jbiomech.2007.01.009 JBMCB5 0021-9290 Google Scholar
A. O. Brightmanet al.,
“Time-lapse confocal reflection microscopy of collagen fibrillogenesis and extracellular matrix assembly in vitro,”
Biopolymers, 54
(3), 222
–234
(2000). http://dx.doi.org/10.1002/(ISSN)1097-0282 BIPMAA 0006-3525 Google Scholar
S. Hellet al.,
“Aberrations in confocal fluorescence microscopy induced by mismatches in refractive index,”
J. Microsc., 169
(3), 391
–405
(1993). http://dx.doi.org/10.1111/jmi.1993.169.issue-3 JMICAR 0022-2720 Google Scholar
F. P. Bolinet al.,
“Refractive index of some mammalian tissues using a fiber optic cladding method,”
Appl. Opt., 28
(12), 2297
–2303
(1989). http://dx.doi.org/10.1364/AO.28.002297 APOPAI 0003-6935 Google Scholar
G. J. Tearneyet al.,
“Determination of the refractive index of highly scattering human tissue by optical coherence tomography,”
Opt. Lett., 20
(21), 2258
–2260
(1995). http://dx.doi.org/10.1364/OL.20.002258 OPLEDP 0146-9592 Google Scholar
H. LiS. Xie,
“Measurement method of the refractive index of biotissue by total internal reflection,”
Appl. Opt., 35
(10), 1793
–1795
(1996). http://dx.doi.org/10.1364/AO.35.001793 APOPAI 0003-6935 Google Scholar
C. L. Curlet al.,
“Refractive index measurement in viable cells using quantitative phase-amplitude microscopy and confocal microscopy,”
Cytometry Part A, 65A
(1), 88
–92
(2005). http://dx.doi.org/10.1002/(ISSN)1552-4930 1552-4922 Google Scholar
J. Bindinget al.,
“Brain refractive index measured in vivo with high-NA defocus-corrected full-field OCT and consequences for two-photon microscopy,”
Opt. Express, 19
(6), 4833
–4847
(2011). http://dx.doi.org/10.1364/OE.19.004833 OPEXFF 1094-4087 Google Scholar
S. Z. Wanget al.,
“Assessment of depth and degeneration dependences of articular cartilage refractive index using optical coherence tomography in vitro,”
Connect. Tissue Res., 51
(1), 36
–47
(2010). http://dx.doi.org/10.3109/03008200902890161 CVTRBC 0300-8207 Google Scholar
D. E. T. ShepherdB. B. Seedhom,
“Thickness of human articular cartilage in joints of the lower limb,”
Ann. Rheum. Dis., 58
(1), 27
–34
(1999). http://dx.doi.org/10.1136/ard.58.1.27 ARDIAO 0003-4967 Google Scholar
K. Wanget al.,
“Utilizing confocal microscopy to measure refractive index of articular cartilage,”
J. Microsc., 248
(3), 281
–291
(2012). http://dx.doi.org/10.1111/jmi.2012.248.issue-3 JMICAR 0022-2720 Google Scholar
J. L. Cooket al.,
“The OARSI histopathology initiative—recommendations for histological assessments of osteoarthritis in the dog,”
Osteoarthritis Cartilage, 18
(Suppl 3(0)), S66
–S79
(2010). http://dx.doi.org/10.1016/j.joca.2010.04.017 1063-4584 Google Scholar
K. P. H. Pritzkeret al.,
“Osteoarthritis cartilage histopathology: grading and staging,”
Osteoarthritis Cartilage, 14
(1), 13
–29
(2006). http://dx.doi.org/10.1016/j.joca.2005.07.014 1063-4584 Google Scholar
A. G. Nerlich,
“Histochemical and immunohistochemical staining of cartilage sections,”
Handbook of Histology Methods for Bone and Cartilage, 295
–314 Humana Press, Totowa, NJ
(2003). Google Scholar
J. L. HyllestedK. VejeK. Ostergaard,
“Histochemical studies of the extracellular matrix of human articular cartilage—a review,”
Osteoarthritis Cartilage, 10
(5), 333
–343
(2002). http://dx.doi.org/10.1053/joca.2002.0519 1063-4584 Google Scholar
I. Martinet al.,
“Method for quantitative analysis of glycosaminoglycan distribution in cultured natural and engineered cartilage,”
Ann. Biomed. Eng., 27
(5), 656
–662
(1999). http://dx.doi.org/10.1114/1.205 ABMECF 0090-6964 Google Scholar
I. Kivirantaet al.,
“Microspectrophotometric quantitation of glycosaminoglycans in articular cartilage sections stained with Safranin O,”
Histochem. Cell Biol., 82
(3), 249
–255
(1985). http://dx.doi.org/10.1007/BF00501401 HCBIFP 0948-6143 Google Scholar
V. Tuchin, Tissue Optics—Light Scattering Methods and Instruments for Medical Diagnosis, 2nd ed.SPIE, Bellingham, WA
(2007). Google Scholar
I. H. M. Muir,
“Biochemistry,”
Adult Articular Cartilage, 145
–214 Pitman Medical, London
(1979). Google Scholar
A. K. Williamsonet al.,
“Tensile mechanical properties of bovine articular cartilage: variations with growth and relationships to collagen network components,”
J. Orthop. Res., 21
(5), 872
–880
(2003). http://dx.doi.org/10.1016/S0736-0266(03)00030-5 JOREDR 0736-0266 Google Scholar
J. S. JurvelinM. D. BuschmannE. B. Hunziker,
“Mechanical anisotropy of the human knee articular cartilage in compression,”
Proc. Inst. Mech. Eng. Part H J. Eng. Med., 217
(3), 215
–219
(2003). http://dx.doi.org/10.1243/095441103765212712 PIHMEQ 0954-4119 Google Scholar
S. Patilet al.,
“Measurement of depth-dependence and anisotropy of ultrasound speed of bovine articular cartilage in vitro,”
Ultrasound Med. Biol., 30
(7), 953
–963
(2004). http://dx.doi.org/10.1016/j.ultrasmedbio.2004.04.009 USMBA3 0301-5629 Google Scholar
H. MuirP. BulloughA. Maroudas,
“The distribution of collagen in human articular cartilage with some of its physiological implications,”
J. Bone Joint Surg., 52-B
(3), 554
–563
(1970). Google Scholar
X.-j. Wanget al.,
“Group refractive index measurement of dry and hydrated type I collagen films using optical low-coherence reflectometry,”
J. Biomed. Opt., 1
(2), 212
–216
(1996). http://dx.doi.org/10.1117/12.227699 JBOPFO 1083-3668 Google Scholar
W. Drexleret al.,
“Correlation of collagen organization with polarization sensitive imaging of in vitro cartilage: implications for osteoarthritis,”
J. Rheumatol., 28
(6), 1311
–1318
(2001). JORHE3 0951-9580 Google Scholar
J. P. Arokoskiet al.,
“Decreased birefringence of the superficial zone collagen network in the canine knee (stifle) articular cartilage after long distance running training, detected by quantitative polarised light microscopy,”
Ann. Rheum. Dis., 55
(4), 253
–264
(1996). http://dx.doi.org/10.1136/ard.55.4.253 ARDIAO 0003-4967 Google Scholar
M. T. Nieminenet al.,
“T2 relaxation reveals spatial collagen architecture in articular cartilage: a comparative quantitative MRI and polarized light microscopic study,”
Magn. Reson. Med., 46
(3), 487
–493
(2001). http://dx.doi.org/10.1002/(ISSN)1522-2594 MRMEEN 0740-3194 Google Scholar
L. C. HughesC. W. ArcherI. ap Gwynn,
“The ultrastructure of mouse articular cartilage: collagen orientation and implications for tissue functionality. A polarised light and scanning electron microscope study and review,”
Eur. Cells Mater., 9 68
–84
(2005). Google Scholar
M. S. Laasanenet al.,
“Biomechanical properties of knee articular cartilage,”
Biorheology, 40
(1), 133
–140
(2003). BRHLAU 0006-355X Google Scholar
G. E. KempsonM. A. R. FreemanS. A. V. Swanson,
“Tensile properties of articular cartilage,”
Nature, 220
(5172), 1127
–1128
(1968). http://dx.doi.org/10.1038/2201127b0 NATUAS 0028-0836 Google Scholar
S. S. Chenet al.,
“Depth-dependent compressive properties of normal aged human femoral head articular cartilage: relationship to fixed charge density,”
Osteoarthritis Cartilage, 9
(6), 561
–569
(2001). http://dx.doi.org/10.1053/joca.2001.0424 1063-4584 Google Scholar
A. C. Chenet al.,
“Depth- and strain-dependent mechanical and electromechanical properties of full-thickness bovine articular cartilage in confined compression,”
J. Biomech., 34
(1), 1
–12
(2001). http://dx.doi.org/10.1016/S0021-9290(00)00170-6 JBMCB5 0021-9290 Google Scholar
H. J. Mankinet al.,
“Biochemical and metabolic abnormalities in articular cartilage from osteo-arthritic human hips. II. Correlation of morphology with biochemical and metabolic data,”
J. Bone Joint Surg., 53
(3), 523
–537
(1971). Google Scholar
|


