
|
|
1.IntroductionThe aging population, in particular, is becoming educated about the potential benefits of those dietary components that are associated with a reduced risk for advanced age-related macular degeneration (AMD)1,2 and cataracts.3,4 Among the dietary components are the carotenoids lutein and zeaxanthin and the less common meso-zeaxanthin. These carotenoids together form the macular pigment,5 or yellow spot, in the center of the human retina. They are also found in the lens and other eye tissues6 where their antioxidant activity may be important in providing tissue protection. Concern about the two common age-related eye diseases, AMD and cataracts, will increasingly prompt individuals to assess their risk and modify their diet, if necessary, to increase their intake of carotenoid-rich foods or supplements. While several methods for noninvasively measuring macular pigment optical density (MPOD) exist, no such methods, including what we describe here, are currently available for assessing carotenoid content in the lens. However, one might argue that MPOD is probably a surrogate measure of carotenoid content in the lens since both will be dependent on carotenoid concentrations in the blood serum. Thus, a person with a high MPOD might have a lower risk of both AMD and cataracts. Psychophysical and physical methods are used to measure MPOD, and proponents of the latter argue that they do not incur a reliance on subject skill, other than perhaps steady fixation, that psychophysical methods require. This is not to say that physical methods are without their own characteristic problems. Raman spectrometry has been criticized based upon a concern that MPOD measurements (actually Raman counts) will be affected by lens absorption and intraocular light scatter.7 The lens may also be responsible for significant differences in MPOD before and after cataract surgery when this is measured by autofluorescence spectrometry,8 raising concerns about the validity of this technique. Fundus reflectometry either requires complex modeling of the optical properties of the eye resulting in many adjustable parameters,9,10 or it is based on such rudimentary modeling that the MPOD thus obtained is probably only an estimate.11,12 Among the few psychophysical techniques, heterochromatic flicker photometry (HFP) is by far the most widely used. (For a thorough review of both physical and psychophysical methods, see Howells et al.13) In a typical HFP device, a circular stimulus of around 1- to 2-deg diameter alternates between two wavelengths, one of which is strongly absorbed by the macular pigment (blue) and another which is minimally absorbed (green). While directly viewing the resulting flickering turquoise stimulus, the subject adjusts the relative intensity of the blue and green components in order to achieve equiluminance between them as evidenced by minimization, or elimination, of flicker. The procedure is repeated while imaging the stimulus in the parafoveal or perifoveal retina by having the subject fixate on an eccentric reference mark. Herein lie the major difficulties experienced by many subjects. While performing this part of the procedure, subjects will often admit to the difficulty of restraining themselves from surreptitiously glancing back at the stimulus “to see if it’s still flickering.” Of course, if they do so, they are merely repeating the first part of the test and the resulting MPOD, obtained from the log ratio of intensity settings, will be zero. Adding to the difficulty is the phenomenon of Troxler fading of peripheral stimuli which can mimic the flicker null even if this has not been achieved. The reason for the two-part test is to eliminate the contribution of lens yellowing. The blue intensity required for the null point in the central test will depend on absorption by both the macular pigment and lens, whereas for the perifoveal test, only the lens will be the significant absorber. By a subtraction process, the lens can be eliminated leaving only the contribution by the macular pigment. However, this is correct only for monochromatic lights. Nowadays many instruments are employing broad-band light emitting diodes (LEDs) and failing to make the necessary corrections.14,15 In this article, we will describe a novel, LED-based HFP (mapcat SF™) that removes the difficulties associated with the perifoveal part of the test. In addition, the perifoveal test provides a means of calculating lens optical density (LOD) and this is used to automatically correct the measured MPOD for the effects of the broad-band LEDs. 1.1.Instrument DesignThe starting point for the design was inspired in Fig. 3(5.7.2) in the book, Color Science.16 This graph, reproduced in Fig. 1, shows the luminous efficiency functions for 2- and 10-deg fields, and clearly shows the influence of macular pigment on the 2 deg function. We therefore designed a HFP that would provide centrally fixated small (1.5 deg) and large (15 deg) stimuli, the latter to replace the small stimulus that is viewed parafoveally/perifoveally in traditional HFP. Fig. 1Luminous efficiency functions for 10 deg (solid line) and 2 deg (dashed line) centrally viewed fields.  The instrument prototype is shown in Fig. 2 and the optical component layout is shown schematically in Fig. 3. The stimuli are generated by a 3 W blue LED (peak 455 nm, half-width 20 nm) and a 1 W green LED (peak 515 nm, half-width 33 nm) mounted with their active elements on the inner surface of the 4 in. integrating sphere, . The intensities of the LED outputs are controlled by frequency modulation in the kilohertz range of fixed amplitude pulses supplied to the LEDs. This system of control was found to produce no change in the relative energy spectrum of the LED as the intensity was adjusted. This was also the case with pulse width modulation; however, we could not achieve the necessary range of blue LED intensities with this method. A third alternative, adjusting the direct current to an LED, was found to produce unacceptable changes in peak wavelength of the order of 10 nm as the LED was adjusted from full intensity to of full intensity. (This is the system of LED intensity control in the “Maculometer.”14) Electronic gating is used to switch the blue and green LEDs on and off to produce alternating square wave outputs in antiphase with each other. The frequency of alternation (“flicker frequency”) is adjustable in the range 10 to 40 Hz. A photodiode detector, PD, is mounted just above the aperture in sphere and samples the light scattered from the rear surface opposite the aperture, i.e., the same light that is viewed by the subject. A sample-and-hold procedure is used to take multiple samples of the intensities of both the blue and green lights. The averaged results are represented by the symbols that first appear in Eqs. (1)–(3) below. Fig. 3Optical component layout. Blue and green LEDs illuminate the interior of integrating sphere . Intensities are measured by photodiode, PD. The aperture disk, , provides 1.5 and 15 deg stimuli when viewed through the telescope which comprises lenses (objective) and (eyepiece), field stop , and viewing aperture . Green LEDs in sphere provide uniform illumination of the front surface of .  Light from the LEDs, rendered spatially uniform by , emerges through an aperture in the front of the sphere. The stimuli diameters, 1.5 and 15 deg, are defined by additional apertures in a thin opaque disk, , that can be turned by a rotary solenoid to bring either aperture into position. Each aperture can be viewed through a low-powered telescope consisting of an objective lens and an eyepiece lens . The apertures contain cross-hair reticles to aid with central fixation. A field stop, , located at the position of the real image of the aperture formed by , limits the overall field size to 24 deg. Disk is located just in front of an aperture in a second sphere, , and has the same matte white finish as the interior of the left hemispherical half of . Two 1 W green LEDs mounted in , having the same peak wavelength and half-width as the green LED in , provide uniform illumination of the front surface of . The right half of is coated on its interior with a matte black finish to prevent light generated in either sphere from reaching the white scattering surface inside the other sphere. The output of the green LEDs in is adjusted until there is a luminance match between the green component of the stimulus and the green-illuminated front surface of . Thus, when a subject achieves a flicker null, i.e., equiluminance of the blue and green components of the stimulus, the entire field—stimulus and surround—will be of uniform luminance, approximately . All of the components shown in Fig. 3, except the eyepiece lens, , and viewing aperture, , are mounted on a translation slide driven by a stepper motor. A focusing control allows the subject to move the slide back and forth in order to bring the apertures and cross-hairs in disk into sharp focus. An important feature of this instrument is maintenance of the angular size of the stimulus on the retina regardless of the individual focusing necessary to produce a sharply defined image on the retina. This is achieved by ensuring, through the position of the viewing aperture, , that the object nodal point of the eye is located at a distance from the eyepiece lens, , equal to its focal length. (In practice, without precise eye positioning, this distance will, of course, involve some variability.) 1.2.Subject TestingThe subject is seated in front of the instrument with the nontest eye occluded with an eye patch. An adjustable chin rest helps to immobilize the subject’s head. At the start of the test, and to facilitate focusing, both the blue LED and flicker are turned off, providing a steady green stimulus in a green background. Turning an optical encoder knob on a hand-held control allows the subject to bring the 1.5 deg stimulus and cross-hairs into sharp focus. The blue LED and flicker are turned on with the latter set to a default frequency of 24 Hz. The knob on the hand-held control now controls the intensity of the blue LED. The subject is instructed to turn the knob fully clockwise, then fully counter-clockwise, and note that the stimulus appearance changes from one of bright flicker (relative to the green background) to dark flicker. The subject then adjusts the intensity to produce a minimization or elimination of flicker having been advised that this will occur when the stimulus appears neither brighter nor darker than the background. After recording the intensity, the microprocessor introduces a small offset prior to the subject making a second null setting. The procedure can be repeated up to 10 times, but is usually limited to five or less. If the subject is uncomfortable with the frequency, it can be adjusted at any point during the test. If the subject perceives a wide range of no-flicker, the frequency is lowered; if he or she cannot eliminate flicker, the frequency is raised. [This procedure has been termed “customized HFP” (cHFP) by Stringham et al.17] Upon completion of this foveal test, the 1.5 deg stimulus is replaced by the 15 deg stimulus and the flicker frequency is set to a default of 31 Hz. While maintaining central fixation, the subject adjusts the blue LED intensity to the point where the peripheral region appears steady but flicker persists in the center. The subject is instructed to continue making adjustments until the area of central flicker is as small as possible, and this is typically to 8 deg in diameter. A very small offset in either direction results in the entire stimulus flickering, i.e., the flicker null point is very sharply defined. As with the foveal test, up to 10 repeat measurements can be made as well as frequency adjustments if necessary. Accurate fixation is not important because the small area of flicker is always centered at the fixation point, and Troxler fading is totally absent (see Sec. 4). By comparison, accurate central fixation would be important for the annular, parafoveal stimulus in the “Maculometer.”14 In addition, subjects using this instrument might be tempted to glance toward a point on an annular stimulus just as they might inadvertently glance at a small stimulus that is supposed to remain in their peripheral vision. At the conclusion of the test, a tablet display shows the subject’s MPOD (), LOD at 425 nm (), lens equivalent age [LEA ()], and the average percentage of blue-light blocking by the macular pigment. These results can be transferred via a USB port to a printer. 2.TheoryThe instrument’s photodetector measures the blue intensities at the null point for the foveal and perifoveal parts of the test and also the fixed green intensity. The photodetector outputs are, respectively Here, and are the blue and green LED intensity spectra, respectively, the former normalized. and represent the adjustment factors for the blue intensity when the subject performs the foveal and perifoveal parts of the test, respectively. is the spectral response of the photodetector. From Eqs. (1) and (2)For the foveal test, equiluminance of the blue and green lights can be expressed by and for the perifoveal test where is the eye’s luminous efficiency function adjusted for lens yellowing, which is dependent on age, , but excluding macular pigment absorption. is the MPOD spectrum, normalized to unity at its peak and is the peak MPOD. Note that for the foveal test [Eq. (5)], the green (as well as the blue) luminance is affected by the macular pigment due to the overlap between the emission spectrum of the green LED and the absorption spectrum of the macular pigment. For the perifoveal test [Eq. (6)], we are assuming that the MPOD has a negligible effect on the luminance in the peripheral part of the 15 deg stimulus.18 Also any change in the eye’s pupil diameter would have an equal effect on the retinal illuminances produced by the blue and green lights, i.e., each side of Eqs. (5) and (6) would be equally affected.Dividing Eq. (5) by Eq. (6), and incorporating Eq. (4) Note that for monochromatic blue and green lights, this equation reduces to provided the wavelengths are those for which is maximum (blue) and zero (green).To obtain from Eq. (7), the only unknown is , a function that should include the effects of lens yellowing but not macular pigment. We therefore adopted the 10 deg photopic luminosity function, ,16 which was obtained from measurements on 26 observers of average age 32.19 We assumed that this function could be used to represent our function for a subject with age , i.e., we assumed that there would be negligible differences between and a corresponding 15 deg luminosity function for someone of the same age. To obtain at any age, we used a model by Sagawa and Takahashi.20 The model, based on flicker measurements of luminous efficiency, provides the change per year of age in log luminous efficiency as a function, , of wavelength. Thus, We incorporated Eq. (9) in Eq. (10), and solved it numerically to produce a graph of age, , as function of the ratio of photodetector outputs, see Fig. 4. Sagawa and Takahashi attribute mainly to the age-related change in lens absorption, at least for the shorter wavelengths relevant to this study; thus, we will refer to as the “lens equivalent age (LEA).” The instrument’s microprocessor essentially uses the graph in Fig. 4 to generate the subject’s LEA from the photodetector outputs, and , obtained in the perifoveal part of the test. In addition, it generates the LOD at 425 nm, a wavelength chosen somewhat arbitrarily. To do so, we used the model of van de Kraats and van Norren21 to generate the LOD spectrum for a 32-year old, and then modified it using to obtain the LOD spectrum for any age. Fig. 4Lens equivalent age (LEA) as a function of the blue/green intensity ratio, , at the perifoveal flicker null point.  Finally, solutions to Eq. (7) were obtained numerically and are shown in Fig. 5. Here, the peak MPOD, , is plotted as a function of , one curve for each value of between 20 and 90 years. The instrument’s microprocessor, having already determined for a subject, is able to generate the corresponding curve and use this to calculate from the subject’s photodetector outputs, and . Fig. 5Peak MPOD as a function of the log ratio of blue LED intensity settings, , at the foveal and perifoveal flicker null points. Curves are shown for different LEAs between 20 and 90 years (5-year intervals).  To provide the subjects with a more meaningful measure of the effectiveness of their macular pigment, the microprocessor calculates the average percentage of blue-light blocking (400 to 500 nm) by the macular pigment. This is given by the average value of in that wavelength range. 2.1.Test–RetestFifty-two naïve subjects ranging in age from 19 to 79 years () participated in a study to assess the repeatability of the instrument. Four subjects had previously undergone cataract surgery and, of these, one was diagnosed with dry AMD in the test eye but retained visual acuity. None of the other subjects reported any ocular disorder. The study conformed to the requirements of the Institutional Review Board and to the tenets of the Declaration of Helsinki. Each subject received instructions, described earlier, on how to perform the test and then proceeded to make five settings with the 1.5 deg stimulus followed by five settings with the 15 deg stimulus. Only the right eye was selected for testing purposes. Subjects were asked how easy they found the test generally, and which part of the test, “small circle” or “large circle,” they found easier. Retesting of the subject was conducted usually on the same day under identical conditions. 2.2.Simulation of Age Effect on MPODAs far as we are aware, the mapcat SF™ is the first LED-based HFP that performs an automatic correction to the subject’s MPOD measurement based upon the equivalent age of the subject’s lens. Such a correction only becomes significant for instruments employing nonmonochromatic light sources such as LEDs. We wished to determine the effect of failing to include this correction on the MPOD of a group of subjects. We used a pseudorandom number generator to simulate a group of 200 subjects reasonably uniformly distributed in both LEA, (20 to 90 years) and true MPOD, (0 to 1.0). Consequently, for this group of hypothetical subjects, there was no dependence of MPOD on age. For each value of , we determined the appropriate luminous efficiency function, , and then used this together with the corresponding value of in Eq. (7) to calculate the ratio of blue intensity settings, , that this “subject” would ideally provide when using the mapcat SF™. [The log of this ratio is often reported as a measure of the MPOD. See Eq. (8).] For this calculation, we used the spectral characteristics of the blue and green LEDs employed in the instrument. As a final step, we substituted the ratio back into Eq. (7) and solved for , but this time using the standard 10 deg luminous efficiency function, ,16 for all subjects. This would represent a partial correction for the finite bandwidth of the light sources, but would not include the influence of the aging lens. 3.ResultsSubjects responded to questioning that, generally, the test was easy, that there was no perception of Troxler fading, and, overwhelmingly, that using the “large circle” (15 deg stimulus) was the easier part of the test. The standard deviations of the five blue LED intensity settings for both the foveal and perifoveal parts of the test were obtained for each subject. For all subjects, the average standard deviations for the foveal and perifoveal measurements were 0.0282 and 0.0121 (arb. intensity units), respectively. The results of test–retest measurements of MPOD are shown as a Bland–Altman plot in Fig. 6. The mean difference between the test and retest values was and the limits of agreement () were . Regression analysis indicated that the test and retest measurements were highly correlated, with , , see Fig. 7. The difference between the test and retest values for the subject with dry AMD was 0.037, i.e., well within the limits of agreement. This subject reported no difficulty in performing the test. Fig. 6Bland Altman graph for 52 subjects showing the difference between test and retest measurements of MPOD versus the average of the two measurements. The mean difference and the limits of agreement (95% confidence intervals) are indicated by the horizontal lines.  Figure 8 is a graph of the subjects’ LEA (average of test and retest) versus their biological age. Data points lying above the line of unit slope represent subjects whose LEA exceeded their biological age whereas the converse is true for subjects whose data points lie below the line. Fig. 8LEA as a function of biological age for 52 subjects. Data points above and below the line of unit slope indicate subjects whose lenses are older and younger, respectively, than their biological age. 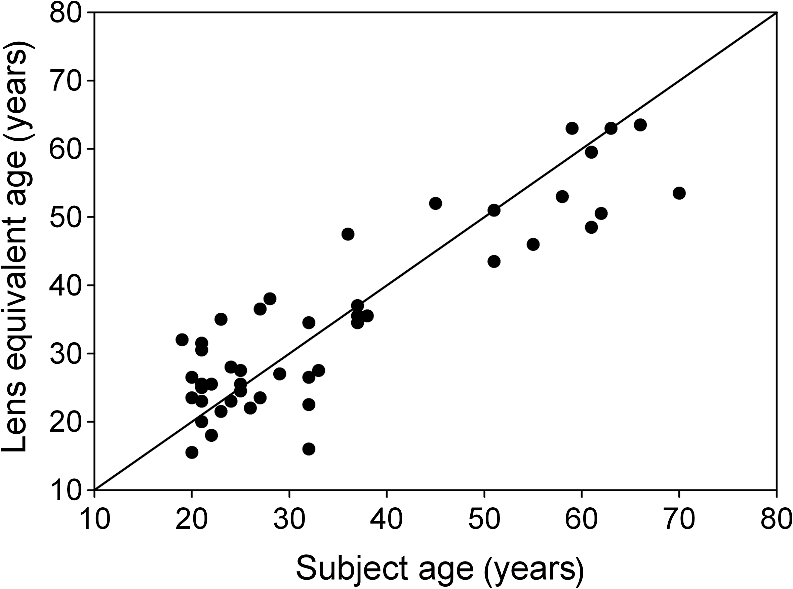 In Fig. 9, we present the results of the simulation study. The open circles were generated using Microsoft Excel’s pseudorandom number generator and represent a uniform distribution of LEAs as well as MPODs [ in Eq. (7)]. This uniformity was reflected in the equation of the linear regression line, , and the value of of . The corresponding values of that these “subjects” would provide if tested using the mapcat SF™ are shown in Fig. 10. The regression line indicates an average decline in this quantity with LEA of . Conversion of back to , but this time using the standard 10 deg luminous efficiency function, , in Eq. (7), yielded the filled circles in Fig. 9. These only partially corrected values also declined with LEA at a rate of . The average () rate of decline, based on six separate simulations, was . Fig. 9The open circles and associated solid regression line simulate a group of 200 subjects for whom there is no dependence of MPOD on age. If tested on the mapcat SF™ and the instrument’s microprocessor did not apply a correction based on the subjects’ LEA, it would generate the data indicated by the filled circles and dashed regression line, i.e., there would be an apparent age-related decline in MPOD. 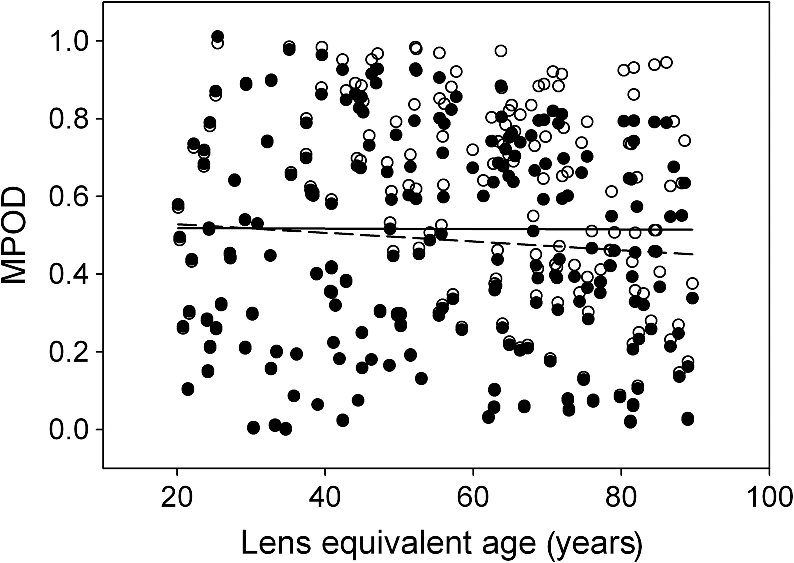 4.DiscussionWe have succeeded in our objective of designing an instrument which removes the difficulties that many subjects experience when using traditional HFP for MPOD measurements. These difficulties are associated with the use of a small, eccentrically viewed stimulus for the perifoveal part of the test, prone as it is to Troxler fading, and the problem many subjects have in maintaining fixation away from the stimulus. The latter difficulty was noted by Gallaher et al. in a test–retest study using a commercially available HFP instrument (Macular Metrics Corp., Rehoboth, Massachusetts) with older subjects.22 With the mapcat SF™, the small, eccentrically viewed stimulus is replaced with a large 15 deg stimulus with the subject task being that of eliminating the flicker in the periphery. Qualitatively, subjects reported the use of the 15 deg stimulus to be easier than using the 1.5 deg stimulus and, quantitatively, the average standard deviation obtained from sets of five repeat measurements with the larger stimulus was less than half that obtained with the smaller stimulus. This situation is similar to that reported by Mellerio et al. who used an annular parafoveal target with central fixation that subjects found easier than the foveal test target.14 The test–retest results indicate a high level of repeatability of MPOD measurements. This is crucial, particularly for monitoring sometimes small increases in MPOD resulting from supplementation with any of the macular carotenoids. The mean difference between test and retest, , indicates that there was no bias toward the retest measurement being consistently either higher or lower than the test measurement. The limits of agreement obtained with the instrument compare favorably with those reported for other techniques for measuring MPOD, including both psychophysical and physical ones.22–26 However, quantitative comparisons should be treated with caution if, as in the present case, different groups of subjects are tested on the instruments that are being compared. For the reference (green) source, we chose an LED with a peak wavelength of 515 nm. The advantage of this choice is a smaller chromatic difference between the reference source and the test source (blue LED) than, say, in other LED-based instruments.15 An often overlooked temporal problem in HFP is that different wavelengths presented to the eye require different times to reach their maximum luminance. These times exceed the typical presentation time ( at a flicker frequency of 24 Hz). However, the effect is reduced if the color difference between the test and reference sources can be minimized.27 An additional advantage of small color differences in flicker photometry is that precision of luminance matching is enhanced.28 Due to the relatively broad bandwidth of LEDs, the energy spectrum of the green LED overlapped significantly with the MPOD spectrum. While this would present a problem in the use of Eq. (8), which assumes no overlap, it is fully accounted for in Eq. (7) which is programmed into the instrument’s microprocessor to calculate the peak MPOD. The importance of Eq. (7), with its age-dependent luminous efficiency function, , is emphasized by the results of the simulation study. Here, it was found that a sample of “subjects” for whom, on average, there was no dependence of MPOD, , on lens age, nevertheless exhibited a declining with age. Furthermore, if was recalculated from these values by means of Eq. (7), but with replaced with the 10 deg luminous efficiency function, , then also declined with age. While the rate of decline will be dependent on the energy spectra of the specific blue and green LEDs that are used, caution may be warranted in studies of the age dependence of MPOD when this quantity has been measured by LED-based HFP.29–31 For example, an age-related decline in MPOD of has been reported, virtually identical to the apparent decline that we found in the simulation study.29 In three other HFP instruments, a single correction factor has been applied to in order to obtain the peak MPOD.14,26,32 Figure 11 emphasizes the fact that this method may not be adequate. This three-dimensional plot shows the age-dependent correction (calculated for the actual LEDs used in the mapcat SF™) that must be added to in order to obtain the peak MPOD, . The curved surface was generated from the data used in the simulation study, and the filled circles represent the data (average of test and retest) obtained from the 52 subjects in the test–retest study. The correction can be seen to be particularly large for older subjects with high MPOD. The single correction factor that was used in other instruments14,26,32 would result in a plane surface sloping up to the left, i.e., not a function of age. Fig. 11The correction that must be added to in order to obtain the peak MPOD, . The surface connects the data points in the simulation study; the filled circles are for the 52 subjects in the test–retest study.  In conclusion, we have produced a compact, user-friendly, HFP with a number of novel features. Not only does it provide a measurement of MPOD but also LOD. Since optical density is not a familiar term to many subjects or patients, the instrument generates the related and more comprehensible quantities, percentage of blue light blocking by the macular pigment and LEA, respectively. It also incorporates a correction to the MPOD measurement based upon the subject’s LOD. Failure to incorporate this correction in LED-based instruments can lead to erroneous results, particularly for older subjects with high MPOD. While the instrument test posed no difficulty for the one subject with dry AMD, an additional study would be needed to determine its value in testing subjects with different stages of AMD. ReferencesJ. SanGiovanniet al.,
“The relationship of dietary carotenoids and vitamin A, E, and C intake with age-related macular degeneration in a case-control study, AREDS Report No. 22,”
Arch. Ophthalmol., 125
(9), 1225
–1232
(2007). http://dx.doi.org/10.1001/archopht.125.9.1225 AROPAW 0003-9950 Google Scholar
“Lutein and zeaxanthin and omega-3 fatty acids in age-related macular degeneration,”
J. Am. Med. Assoc., 309
(19), 2005
–2015
(2013). http://dx.doi.org/10.1001/jama.2013.4997 JAMAAP 0098-7484 Google Scholar
L. Brownet al.,
“A prospective study of carotenoids intake and risk of cataract extraction in US men,”
Am. J. Clin. Nutr., 70
(4), 517
–524
(1999). AJCNAC 0002-9165 Google Scholar
L. Chasan-Taberet al.,
“A prospective study of carotenoid and vitamin A intakes and risk of cataract extraction in US women,”
Am. J. Clin. Nutr., 70
(4), 509
–516
(1999). AJCNAC 0002-9165 Google Scholar
R. A. Boneet al.,
“Distribution of lutein and zeaxanthin stereoisomers in the human retina,”
Exp. Eye Res., 64
(2), 211
–218
(1997). http://dx.doi.org/10.1006/exer.1996.0210 EXERA6 0014-4835 Google Scholar
P. Bernsteinet al.,
“Identification and quantitation of carotenoids and their metabolites in the tissues of the human eye,”
Exp. Eye Res., 72
(3), 215
–223
(2001). http://dx.doi.org/10.1006/exer.2000.0954 EXERA6 0014-4835 Google Scholar
B. R. Hammond Jr.B. R. WootenB. Smollon,
“Assessment of the validity of in vivo methods of measuring human macular pigment optical density,”
Opt. Vis. Sci., 82
(5), 387
–404
(2005). http://dx.doi.org/10.1097/01.OPX.0000162652.85875.D2 OVSCET 1040-5488 Google Scholar
Y. Sasamotoet al.,
“Effect of cataract in evaluation of macular pigment optical density by autofluorescence spectrometry,”
Invest. Ophthalmol. Vis. Sci., 52
(2), 927
–932
(2011). http://dx.doi.org/10.1167/iovs.10-5664 IOVSDA 0146-0404 Google Scholar
J. Van de KraatsT. T. J. M. BerendschotS. Valen,
“Fast assessment of the central macular pigment density with natural pupil using the macular pigment reflectometer,”
J. Biomed. Opt., 11
(6), 064031
(2006). http://dx.doi.org/10.1117/1.2398925 JBOPFO 1083-3668 Google Scholar
J. Van de KraatsT. T. J. M. BerendschotD. Van Norren,
“The pathways of light measured in fundus reflectometry,”
Vision Res., 36
(15), 2229
–2247
(1996). http://dx.doi.org/10.1016/0042-6989(96)00001-6 VISRAM 0042-6989 Google Scholar
S.-J. ChenY. C. ChangJ. C. Wu,
“The spatial distribution of macular pigment in humans,”
Curr. Eye Res., 23
(6), 422
–434
(2001). http://dx.doi.org/10.1076/ceyr.23.6.422.6963 CEYRDM 0271-3683 Google Scholar
H. Wüstemeyeret al.,
“A new instrument for the quantification of macular pigment density: first results in patients with AMD and healthy subjects,”
Graefe’s Arch. Clin. Exp. Ophthalmol., 240
(8), 666
–671
(2002). http://dx.doi.org/10.1007/s00417-002-0515-6 GACODL 0721-832X Google Scholar
O. HowellsF. EperjesiH. Bartlett,
“Measuring macular pigment optical density in vivo: a review of techniques,”
Graefe’s Arch. Clin. Exp. Ophthalmol., 249
(3), 315
–347
(2011). http://dx.doi.org/10.1007/s00417-010-1577-5 GACODL 0721-832X Google Scholar
J. Mellerioet al.,
“A portable instrument for measuring macular pigment with central fixation,”
Curr. Eye Res., 25
(1), 37
–47
(2002). http://dx.doi.org/10.1076/ceyr.25.1.37.9961 CEYRDM 0271-3683 Google Scholar
B. R. Wootenet al.,
“A practical method for measuring macular pigment optical density,”
Invest. Ophthalmol. Vis. Sci., 40
(11), 2481
–2489
(1999). IOVSDA 0146-0404 Google Scholar
G. WyseckiW. S. Stiles, Color Science: Concept and Methods, Quantitative Data and Formulae, Wiley, New York
(1982). Google Scholar
J. Stringhamet al.,
“The utility of using customized heterochromatic flicker photometry (cHFP) to measure macular pigment in patients with age-related macular degeneration,”
Exp. Eye Res., 87
(5), 445
–453
(2008). http://dx.doi.org/10.1016/j.exer.2008.08.005 EXERA6 0014-4835 Google Scholar
R. A. Boneet al.,
“Analysis of the macular pigment by HPLC: retinal distribution and age study,”
Invest. Ophthalmol. Vis. Sci., 29
(6), 843
–849
(1988). IOVSDA 0146-0404 Google Scholar
W. StilesJ. Burch,
“NPL colour-matching investigation: final report,”
Opt. Acta, 6
(1), 1
–26
(1959). http://dx.doi.org/10.1080/713826267 OPACAT 0030-3909 Google Scholar
K. SagawaY. Takahashi,
“Spectral luminous efficiency as a function of age,”
J. Opt. Soc. Am. A, 18
(11), 2659
–2667
(2001). http://dx.doi.org/10.1364/JOSAA.18.002659 JOAOD6 0740-3232 Google Scholar
J. van de KraatsD. van Norren,
“Optical density of the aging human ocular media in the visible and UV,”
J. Opt. Soc. Am. A, 24
(7), 1842
–1857
(2007). http://dx.doi.org/10.1364/JOSAA.24.001842 JOAOD6 0740-3232 Google Scholar
K. Gallaheret al.,
“Estimation of macular pigment optical density in the elderly: test–retest variability and effect of optical blur in pseudophakic subjects,”
Vision Res., 47
(9), 1253
–1259
(2007). http://dx.doi.org/10.1016/j.visres.2007.01.013 VISRAM 0042-6989 Google Scholar
H. BartlettJ. ActonF. Eperjesi,
“Clinical evaluation of the MacuScope macular pigment densitometer,”
Br. J. Ophthalmol., 94
(3), 328
–331
(2010). http://dx.doi.org/10.1136/bjo.2009.167213 BJOPAL 0007-1161 Google Scholar
T. T. J. M. Berendschotet al.,
“Influence of lutein supplementation on macular pigment, assessed with two objective techniques,”
Invest. Ophthalmol. Vis. Sci., 41
(11), 3322
–3326
(2000). IOVSDA 0146-0404 Google Scholar
R. de Kinkelderet al.,
“Macular pigment optical density measurements: evaluation of a device using heterochromatic flicker photometry,”
Eye, 25
(1), 105
–112
(2011). http://dx.doi.org/10.1038/eye.2010.164 12ZYAS 0950-222X Google Scholar
D. M. Snodderlyet al.,
“Macular pigment measurements by heterochromatic flicker photometry in older subjects: the carotenoids and age-related eye disease study,”
Invest. Ophthalmol. Vis. Sci., 45
(2), 531
–538
(2004). http://dx.doi.org/10.1167/iovs.03-0762 IOVSDA 0146-0404 Google Scholar
H. de Lange Dzn,
“Research into the dynamic nature of the human fovea–cortex systems with intermittent and modulated light. II. Phase shift in brightness and delay in color perception,”
J. Opt. Soc. Am., 48
(11), 784
–789
(1958). http://dx.doi.org/10.1364/JOSA.48.000784 JOSAAH 0030-3941 Google Scholar
A. W. Shirley,
“Some uses of flicker photometry,”
J. Colour Group,
(8), 78
–80
(1966). Google Scholar
B. R. HammondM. Caruso-Avery,
“Macular pigment optical density in a Southwestern sample,”
Invest. Ophthalmol. Vis. Sci., 41
(6), 1492
–1497
(2000). IOVSDA 0146-0404 Google Scholar
J. Nolanet al.,
“Macular pigment and percentage of body fat,”
Invest. Ophthalmol. Vis. Sci., 45
(11), 3940
–3950
(2004). http://dx.doi.org/10.1167/iovs.04-0273 IOVSDA 0146-0404 Google Scholar
J. M. Nolanet al.,
“Risk factors for age-related maculopathy are associated with a relative lack of macular pigment,”
Exp. Eye Res., 84
(1), 61
–74
(2007). http://dx.doi.org/10.1016/j.exer.2006.08.016 EXERA6 0014-4835 Google Scholar
R. van der Veenet al.,
“A new desktop instrument for measuring macular pigment optical density based on a novel technique for setting flicker thresholds,”
Ophthal. Physiol. Opt., 29
(2), 127
–137
(2009). http://dx.doi.org/10.1111/opo.2009.29.issue-2 OPOPD5 0275-5408 Google Scholar
|


