
|
|
1.IntroductionIntraoperative guidance of tumor resection surgery is an emerging technology that is being adopted in many different forms in operating rooms around the world.1–3 This has widespread applications, but can be especially important during the resection of glioblastomas: grade IV brain tumors with a poor prognosis. These infiltrating glial tumors originate from normal brain cells and have an appearance that is similar to the surrounding tissue,4 especially in the margins, meaning that optimal resection is difficult to achieve. Studies have indicated that complete resection is beneficial to patients presenting with both low- and high-grade gliomas.5,6 Optical spectroscopy is a promising technique that has been investigated for intraoperative use. It allows rapid, minimally invasive analysis of the composition of tissue—a process commonly referred to as optical biopsy. Various optical biopsy modalities have been developed and investigated in different diseases, including cancers of the breast,7,8 oral mucosa,9,10 and brain.11 Fiber-optic probes are typically used to both deliver light to the target tissue and collect the resulting optical signal for analysis. These spectroscopy devices offer a low-cost alternative to more expensive imaging techniques such as intraoperative magnetic resonance imaging3,4 and can be designed so that they do not require the injection of exogenous fluorophores as is often the case in intraoperative fluorescence imaging.12,13 Because the area of tissue investigated by these devices is limited, they are not suited for wide-field applications but are ideal for localized investigations within small, well-defined areas such as surgical cavities. Diffuse reflectance spectroscopy (DRS) is a technique that is often used during optical biopsy.14–16 The reflectance spectra obtained with this modality can be used to extract quantitative information on the scattering and absorption of light in tissue—a process known as optical property recovery. The optical properties recovered by this process are the absorption coefficient and reduced scattering coefficient , where is the scattering coefficient and is the anisotropy coefficient of the tissue. Many different methods have been developed for the determination of tissue optical properties. Some rely on time-resolved (time or frequency domain) measurements, while others are based on steady-state measurement of DRS signals. Time-resolved techniques use time-dependent diffusion theory or Monte Carlo modeling to predict the time of flight of photons, and fit these data to experimental results. Time-domain methods use a very short (picosecond) light pulse and measure how long it takes photons to reach the detector, while frequency-domain methods use a modulated light source and match the measured phase shift, amplitude modulation, and/or steady-state intensity of the reflectance with those predicted by the Fourier transform of the time-domain diffusion theory formula. An example of a time-domain system for optical property recovery in human tissue is described by Svensson et al.,17 while examples of frequency-domain systems are given by Fishkin et al.18 and Gurfinkel et al.19 Some of the methods used to measure steady-state tissue reflectance include total reflectance measurements with integration spheres, spectrally constrained diffuse reflectance measurements, and spatially resolved diffuse reflectance measurements. When performing spectrally constrained diffuse reflectance measurement, the reflectance spectrum is measured using a single detector fiber located some distance from a source (illumination) fiber. A diffusion theory model of the reflectance calculated using a priori knowledge of the scattering spectra of the chromophores assumed to be present in the tissue is then fitted to this measured spectrum.20 Recently, this method was expanded to more than one radial distance to allow use over a wider range of optical properties.21 Spatially resolved steady-state DRS (SR-DRS), on the other hand, uses multiple detector fibers placed at different distances from a source to obtain measurements of the reflectance versus radial distance. Spatial reflectance curves predicted using diffusion theory or Monte Carlo modeling are then fitted to these data. When using a broadband light source and spectrometer, fitting must be performed at each different wavelength of interest to determine the absorption and scattering spectra. In this study, optical properties are recovered from SR-DRS data. When compared to time-resolved techniques, this method uses simpler, generally less expensive equipment, requiring only a fiber-optic probe and spectrometer (either an imaging spectrometer or a separate single-channel spectrometer for each source–detector separation). This method differs from the spectrally constrained technique in that it can be used to extract optical properties without advance knowledge or assumptions of which chromophores are present in the tissue. Monte Carlo simulation is an effective tool to study photon transport in tissue.22,23 It offers advantages over diffusion theory and other numerical methods that are accurate only for large source–detector separations and correspondingly large probes. Probability distributions are used to describe local interactions of photons with their surroundings, and the individual histories of many different photons are simulated as they travel through tissue. Optical properties can be effectively recovered from SR-DRS data using Monte Carlo simulations.24,25 Our group is working to develop an optical biopsy instrument that makes use of SR-DRS measurements to recover the optical properties of brain tissue. This instrument will later be combined with a time-resolved fluorescence spectroscopy (TRFS) system that is being developed concurrently.26 Because both DRS and TRFS make use of fiber-optic probes, integrating two such systems is a relatively straightforward task. Potential benefits of this integration include two independent sources of contrast for tissue composition analysis and the possibility of intrinsic fluorescence spectroscopy (IFS). IFS is a technique explored by many other groups in this field,7,27–31 which uses DRS data to correct distortions in fluorescence spectra that result from scattering and absorption of light in tissue. The purpose of this paper is to present the development of a unique small-diameter fiber-optic probe design meant for DRS of brain tissue in small surgical cavities and to present a modified optical property recovery algorithm developed for use with this probe design. This expands upon previous results32 by demonstrating (through simulations) the incompatibility of previous optical property recovery algorithms with the new probe design and documents the optimization of the parameters of the Monte Carlo simulations used in the algorithm. 2.Models and Methods2.1.Monte Carlo ModelsAll Monte Carlo codes used in this study simulated a single layer of tissue with homogeneous optical properties and a refractive index of 1.4. The same procedures were used for selecting photon step size, absorption/scattering, and boundary interactions as those described by Wang et al.23 The Henyey–Greenstein phase function33 was used to calculate the scattering angle of photons23,34,35 and all simulations assumed an anisotropy factor () of 0.9. This was considered appropriate as the anisotropy factor of brain tissue is close to 0.9 across the spectral range of interest.36 The use of a single anisotropy coefficient is a common approach taken when modeling reflectance data.14,15,27 Although decreasing means that scattering is more isotropic and therefore shifts spatial reflectance curves toward shorter source–detector separations, it has been demonstrated that when , changes to the anisotropy factor have a minor effect on the reflectance.24,25 The absorption and reduced scattering coefficients ( and ) used in these simulations were chosen to be similar to those of human brain tissue (both gray and white matter) at various wavelengths. The wavelengths investigated in this study were from 360 to 950 nm, as these are the limits of the spectrometer to be used in the final DRS instrument. The optical properties of brain tissue at these wavelengths were taken from results published in a study by Yaroslavsky et al.,36 and representative values are shown in Table 1. These values were used to define the range over which a DRS instrument used in the brain would be expected to operate, and we therefore ensured that the optical property algorithms were effective within this range. Table 1Optical properties of brain tissue (Ref. 36).
A number of Monte Carlo–based techniques are described in this section. The first is the Mono Monte Carlo method, a technique for determining optical properties from SR-DRS data using the results of a single Monte Carlo simulation. This technique was used to simulate how removing detector fibers from a DRS fiber-optic probe design would affect the recovery of optical properties. As will be shown in Sec. 3, simulations indicated that the close proximity of detector fibers to the edge of the probe invalidated the assumption of a uniform refractive index at the tissue surface. This is a common assumption when modeling reflectance in tissue23,37,38 and is necessary for the spatial invariance required by the Mono Monte Carlo method. This motivated the development of a modified algorithm for the recovery of optical properties from DRS data, one that considers the true geometry of the probe and, most importantly, the different refractive indices encountered by photons leaving the tissue surface (described in Sec. 2.5). To test the validity of these Monte Carlo methods, results of the basic Monte Carlo code were compared with those from the MCML code published by Wang et al.23 and the results of diffusion theory calculations. The extended source diffusion theory model described by Farrell et al.37 was used. 2.2.Optical Property Recovery from the Results of a Single Monte Carlo SimulationAn inverse Monte Carlo algorithm was used to recover optical properties from SR-DRS spectra. This algorithm uses the iterative Marquardt–Levenberg curve-fitting routine to fit Monte Carlo–generated spatial reflectance curves to experimental data (in this work, simulated data were used in place of experimental data). Since running repeated Monte Carlo simulations is prohibitively slow, a Mono Monte Carlo technique was used, based on the condensed simulation approach introduced by Graaff et al.24 and adapted by others.25,38 This approach used a single reference simulation with optical properties and to determine the number of interactions of each photon within the medium. In such a simulation, changing the scattering coefficient only affects the path lengths followed by photons between interactions. For this reason, the results of a single Monte Carlo simulation can be applied for a sample with new optical properties so long as the distances in the original simulation can be scaled and the new albedo is less than or equal to , the albedo of the reference simulation.24 The reference simulation was run for photons with optical properties and . Note that any value of could be used, but setting the absorption to 0 guaranteed that was always higher than or equal to . Upon exiting the tissue, each photon was binned in a grid location defined by , the photon’s radial distance from the source, and , the number of scattering events it experienced while travelling through the tissue. This provided a table of the reflectance at discrete values of and as illustrated in Fig. 1. Fig. 1Photon scoring grid used to set up the Mono Monte Carlo method. is the radial distance from the source at which a photon exited the tissue and is the total number of scattering events the photon experienced.  This grid could then be used to determine the reflectance for a sample with optical properties and by applying Eq. (1). First, each value of was multiplied by the new albedo raised to the power of . This could be done since the albedo provides a measure of the fraction of photons that are scattered out of a collimated beam in one path length. The grid was then collapsed down to one dimension by taking the sum along each column. The reflectance at a given source–detector distance (SDD) could be found after first scaling the distances in the collapsed grid by the ratio of the new mean free path () to the mean free path used in the reference simulation (). Because scoring was performed radially, the boundaries of each bin were concentric circles around a central (source) point. The scaling procedure moved the boundaries of the bins inward or outward and therefore changed the bin positions and widths (areas). To compensate for this, each extracted reflectance value was normalized by the total area of the scaled bin in which it was scored. This area was found by subtracting the area of the circle defined by the inner boundary from the area of the circle defined by the outer boundary. Values of were used that corresponded to the positions of optical fibers in a DRS probe, and extracted spatial reflectance curves were fitted to SR-DRS data using the Marquardt–Levenberg curve-fitting algorithm. When used with experimental reflectance data, this inversion procedure allows determination of the optical properties of a measured sample. 2.3.Reducing the Probe SizePractically, to allow ease of use in small surgical cavities, the diameter of the fiber-optic probe will be kept quite small. This meant that any data being fitted could contain only a few short SDDs near the front of a radially resolved reflectance curve. A simulation-based procedure was used to observe the precision in the recovered optical properties as the outermost SDD was reduced. To do so, a low noise reflectance curve was generated (using Monte Carlo methods), and random Gaussian noise was added with standard deviations of 5, 10, and 15% commensurate with experimental conditions observed during preliminary investigations. These data were fitted using the Mono Monte Carlo method to recover and . This was repeated 1000 times, and the standard deviation in the recovered optical properties was determined. Previous investigations suggested that one thousand repetitions were sufficient to ensure that the uncertainties in the results approached their limiting values. This entire process was repeated as the maximum radial distance was reduced, for various input optical properties. In these simulations, reflectance data were generated at evenly spaced distances of 0.3 mm, corresponding to typical fiber diameters. Reducing the maximum SDD in the probe had the additional effect of changing the depth of tissue probed by reflectance measurements. This was investigated by simulating a probe containing a single source and detector and placing the detector at varying distances from the source. For any photon that was eventually collected by the detector, its depth was recorded each time it passed below a target radial distance. These results were then used to find the average depth probed below a target radial distance versus detector position. 2.4.True Probe Forward Monte Carlo ModelBecause of its ability to recover the reflectance at arbitrary SDDs, the Mono Monte Carlo method was effective for investigating how the number of fibers and their positioning affects optical property recovery in a custom probe. However, certain simplifying assumptions were required during the Monte Carlo simulation. These included
To keep within the small diameter constraint while maximizing the outermost SDD, detector fibers were placed very close to the outer edge of the probe. It was therefore expected that inhomogeneous boundary conditions (the difference in the refractive index of the probe and surrounding air) would have an effect on the reflectance. To investigate this effect, a forward Monte Carlo model was developed, which explicitly simulates the true probe design as closely as possible. Each fiber was given a circular profile with a refractive index of 1.46, a representative value provided by an optical fiber manufacturer (CeramOptec Industries Inc., East Longmeadow, MA). Each fiber used for diffuse reflectance measurements was given a core diameter of 200 microns. This size was chosen as a tradeoff between maximizing the SDD of the outermost fiber and minimizing the required exposure time. Larger fibers would reduce the maximum achievable SDD and affect the performance of the optical property recovery algorithm, while smaller fibers would require longer measurement times to achieve an acceptable signal-to-noise ratio. The source fiber was simulated by emitting photons randomly at any point within its core, at any angle within its numerical aperture. Similarly, only photons incident on a detector fiber core at a (refracted) angle within the numerical aperture were scored by the model. Photons incident on the epoxy region of the probe were removed from the simulation (absorbed by the epoxy), while those reaching the tissue surface outside of the probe diameter were reflected according to the Fresnel equations at a boundary with mismatched refractive indices of 1.4 and 1. The results of this true probe simulation were fitted using the previously described Mono Monte Carlo method to see if it was capable of recovering the input optical properties. This was done over a range of optical properties. 2.5.Hybrid Reflectance Recovery AlgorithmTo accurately model the reflectance that will be measured with our probe design, a true probe Monte Carlo simulation is required. Because it is not spatially invariant, however, such a simulation cannot be used to generate the scoring grid in the Mono Monte Carlo model, and therefore a new algorithm for rapid generation of reflectance curves was required. One possible solution would be to generate a two-dimensional look-up table using the forward Monte Carlo model of Sec. 2.4 over a range of and values. Achieving sufficient resolution over the wide range of optical properties listed in Table 1, however, would require a very large number of simulations, and the time required to implement this was considered impractical. Instead, a hybrid look-up table/Mono Monte Carlo method was developed for rapid generation of reflectance curves. This allowed the use of true probe simulations but required fewer simulations than a pure look-up table approach. The Monte Carlo simulations described in Sec. 2.4 were run for selected values of , but with set to 0. Detected photons were scored according to the detector in which they were collected and , the total three-dimensional path length traversed while in the tissue. Combining the results of these simulations produced the three-dimensional grid shown in Fig. 2: the reflectance in each detector for each different value of and . Fig. 2The photon scoring grid used in the hybrid reflectance recovery algorithm. A number of different simulations were run for different values of . Photons in each simulation were scored according to the detector bundle in which they were collected and , the total three-dimensional path length traveled in the tissue. 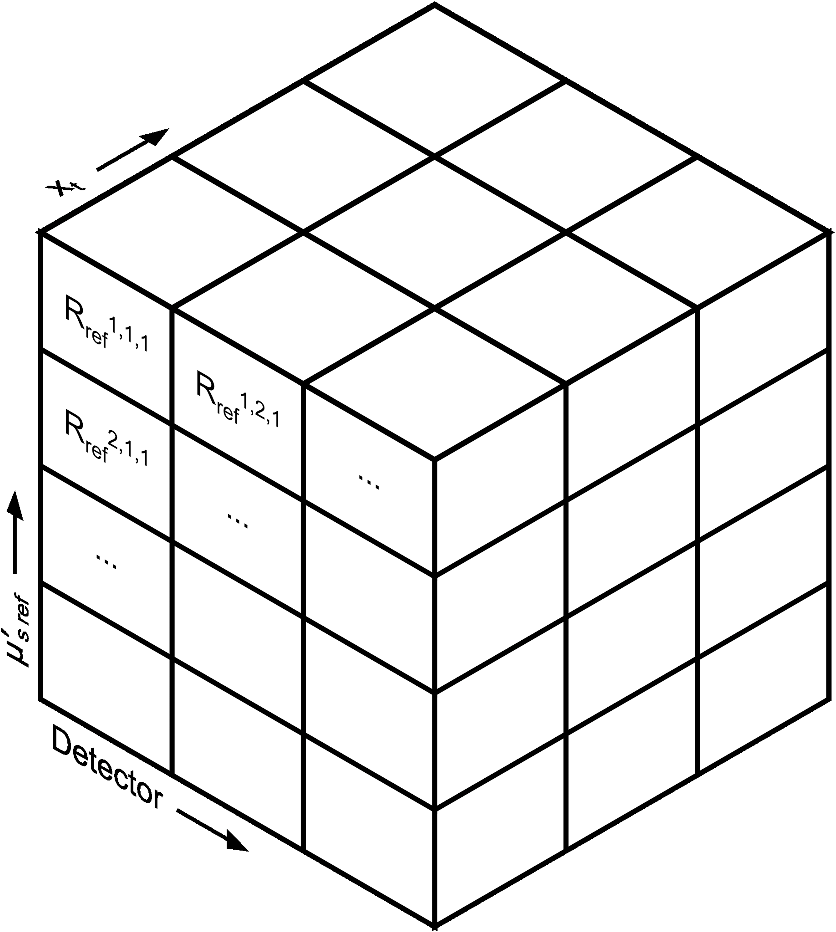 In a process similar to the one in Sec. 2.2, this grid could later be used to recover the reflectance corresponding to a measurement on a sample with arbitrary optical properties. The absorption coefficient of the sample was incorporated by applying Eq. (2), thus collapsing the grid in one dimension. This created a look-up table of the reflectance collected by each detector versus . Finally, reflectance values were extracted from this table by interpolating between values by cubic splines. This procedure is shown graphically in the Appendix. In an experimental situation, the optical properties of a tissue sample can be recovered by generating successive spatially resolved reflectance curves with this algorithm and using Marquardt–Levenberg curve-fitting to find the best fit to measured data. By changing the geometry used in the initial Monte Carlo simulations, this algorithm could be applied to any desired probe design. To ensure accuracy in reflectance curves generated with this algorithm, a number of parameters were investigated and optimized. Because photons were scored in discrete bins based on the total path length, both the maximum path length scored and the width of the bins (path length resolution) were parameters of the model. Simulations were run in which photons were scored at very high resolutions of and maximum path lengths of 150 mm. While these values would be impractical for use in a final algorithm due to time and file size constraints, they were used in initial investigations to allow for independent evaluation of each parameter. The optical properties used in these investigations were and . The four combinations of these values covered the range of optical properties of brain tissue listed in Table 1. The influence of the maximum path length () was investigated by finding the total reflectance recovered for a series of values and comparing this to the reflectance when the path length was not limited. The path length resolution was investigated by progressively summing the contents of adjacent bins to simulate coarser binning. Finally, since each simulation used to generate the grid was run with a different value of ; the resolution in was another parameter of the model (the range was previously defined as 0.5 to ). This resolution was progressively improved by running additional simulations and observing plots of the total reflectance versus . This procedure was continued until intermediate data points could be accurately interpolated by cubic splines. The error in interpolation was estimated by consecutively removing each point from the data (except the endpoints) and interpolating for the value of the missing data point. 2.6.Optical Property Recovery PerformanceUsing the Marquardt–Levenberg curve-fitting routine with absolute reflectance data from the hybrid reflectance recovery algorithm will allow recovery of and from measured SR-DRS data. A simulation-based testing procedure was used to characterize the precision of the optical property algorithm. The relative uncertainty (defined here as the standard deviation divided by the mean of 1000 runs) in the recovered optical properties was observed when simulated reflectance curves corrupted by random noise were input to the algorithm. 3.Results and Discussion3.1.Monte Carlo ModelResults of the comparison between our basic Monte Carlo model, the MCML code,23 and diffusion theory are shown in Fig. 3 for selected optical properties. It can be observed that at short SDDs (Fig. 3 inset) the results are consistent with MCML, while at longer distances, the results are consistent with both MCML and diffusion theory. Fig. 3Validation of Monte Carlo codes. Solid lines are spatially resolved diffuse reflectance spectroscopy (SR-DRS) reflectance curves generated using the Mono Monte Carlo method. Dots indicate the results of the MCML code by Wang et al.23 Crosses show the results of diffusion theory calculations using the extended source model described by Farrell et al.37  3.2.Reduced Probe SizeThe results of the investigation described in Sec. 2.3 (reducing the probe diameter) are shown in Fig. 4, which plots the percent uncertainty in the recovered optical properties versus the maximum SDD in the simulated probe design. These results indicated that the presence of random noise in the reflectance curves had a strong effect on the precision of the optical properties recovered by the Mono Monte Carlo algorithm. The relative uncertainty in the recovered optical properties was found to increase approximately linearly with the standard deviation of the added noise and to vary approximately inversely with the SDD of the outermost detector. Examination of Fig. 4 suggests that, for the optical properties shown, an outermost distance would demonstrate acceptable precision. This was consistent with other simulations using different optical properties (data not shown). It can also be observed that at short SDDs, the uncertainty in is significantly greater than . At short SDDs, collected photons have experienced short path lengths in tissue, and therefore the influence of small changes in is insignificant. Fig. 4The percent uncertainty (standard deviation divided by the mean) in the value of the optical properties recovered from 1000 reflectance curves corrupted by normally distributed random noise with a standard deviation of 5, 10, or 15% as indicated. Optical properties of and were used to generate all initial reflectance curves.  The effect that reducing the maximum SDD had on the depth probed by reflectance measurements is demonstrated by the simulation results in Fig. 5. This shows the average depth probed by photons as they passed below a radial distance of 0.89 mm when the detector was placed at various SDDs. Fig. 5The influence of the source to detector distance on the depth of tissue probed by DRS. The average depth of tissue probed below a radial distance of 0.89 mm is shown for optical properties of and .  Using these data alongside other practical constraints, a design with three detectors placed up to a maximum SDD of 1.67 mm was chosen for use in brain tissue. The furthest detector was placed near to the outer edge of the probe to maximize its SDD, and the diameter of the probe was limited to to allow easy manipulation in a small surgical cavity. Multiple detector fibers were placed at each SDD, and their outputs were bundled together to improve the photon collection efficiency. More fibers were placed in bundles at further SDDs to help compensate for the decreased signal at these distances. The design chosen for the probe is shown in Fig. 6, and the relative signal strength collected by each detector bundle is shown in Table 2. Fig. 6The proposed design for the fiber optic probe. DRS detector fibers are bundled together into three groups, each at the indicated distance from the DRS source fiber (measured from the centers of each fiber). The central fiber is used for both illumination and detection in time-resolved fluorescence spectroscopy measurements.  Table 2Relative signal strength in each of the outer two diffuse reflectance spectroscopy detector bundles of the probe shown in Fig. 6, obtained through Monte Carlo simulations. This was defined as the total reflectance (photons per unit area) collected in all fibers of the indicated bundle divided by the total reflectance in the detector bundle 0.23 mm from the source.
A 0.4-mm diameter fiber was included in the probe design for future use in a combined diffuse reflectance/time-resolved fluorescence instrument. Although photons entering this fiber were not scored during Monte Carlo simulations, its presence was considered because it altered the reflectance profile of the probe due to a difference in the index of refraction of the fiber and the surrounding probe surface. 3.3.Boundary EffectsThe consequences of ignoring the change in refractive index at the probe’s edge (boundary effects) are demonstrated in Fig. 7. These results show that although the Mono Monte Carlo algorithm was able to generate a good fit to the (simulated) true probe reflectance, this fit corresponds to incorrect optical properties. This analysis was performed over a range of optical properties, and results are listed in Table 3. The discrepancies between the target and recovered absorption coefficients in Table 3 show the strong influence of boundary effects on this probe design. This motivated the development of a new optical property recovery algorithm, one that considers the true geometry of the probe surface. This algorithm was described in Sec. 2.5. Fig. 7The effects of boundary conditions on optical property recovery with the Mono Monte Carlo algorithm. The solid line is the reflectance curve predicted by the Mono Monte Carlo model for optical properties of and . Points marked with an “” show the reflectance predicted by the true probe forward Monte Carlo model for the same optical properties. The dotted line is the fit generated with the Mono Monte Carlo algorithm, which corresponds to optical properties of and .  Table 3The effects of boundary conditions on the Mono Monte Carlo algorithm’s ability to recover optical properties.
Note: The “Target optical properties” were used to generate reflectance curves with a model that simulates the probe boundary. “Recovered optical properties” are the values returned when fitting this simulated data with a model that does not consider boundary conditions. Source–detector distances of 0.23, 0.59, and 1.67 mm were used. 3.4.Parameter Optimization: Hybrid Reflectance Recovery AlgorithmSelected results from the investigation of the maximum path length parameter are shown in Fig. 8. It was found that for path lengths , the reflectance in each detector reached of its maximum value, the total when the path length was not limited. This was true for all investigated optical properties (data not shown), and therefore 150 mm was chosen as the maximum path length to record in all simulations. Fig. 8Investigation of the maximum path length parameter for simulations with optical properties of (a) , and (b) , . Each curve corresponds to a simulated detector bundle with the indicated source-to-detector distance. is the number of photons collected that traveled a total path length equal to . is the total number of photons collected for each source–detector distance (SDD) when the path length was not limited.  Investigation of the path length resolution parameter showed that when it was decreased to 13 bins/mm, the simulated reflectance remained within 1% of the reflectance at . This was true across the range of investigated optical properties, and therefore a path length resolution of was selected for . Since the maximum path length recorded was 150 mm, 1950 path length bins were used in total. The resolution in is shown in Fig. 9 for and . The error in each point was found to be when the resolution in was set to . Fig. 9The reflectance recovered using the method described in Sec. 2.5 for each detector bundle in the probe layout of Fig. 6. Results are shown over a range of desired values, with (a) and . (b) Data points indicate the values used to generate the grid and the lines are the results of interpolation by cubic splines. The error in each data point was .  3.5.Optical Property Recovery PerformanceResults characterizing the precision of the optical property recovery algorithm are shown in Fig. 10. All reflectance data used in the fitting procedure corresponded to the probe design of Fig. 6. As expected, the highest uncertainty in the results occurs when recovering the absorption coefficient from data corresponding to low values. This is a consequence of using a probe with short SDD values; the algorithm is less sensitive to changes in than . This is especially true for tissues with very low absorption because of the shape of the corresponding reflectance curve. Fig. 10Performance of the optical property recovery algorithm when presented with simulated reflectance curves corrupted by random noise with a standard deviation of 5%. The values on the and axes are the target optical properties, while the contour lines represent the relative uncertainty in the recovered optical properties, defined as the standard deviation of the results divided by the mean over 1000 runs. 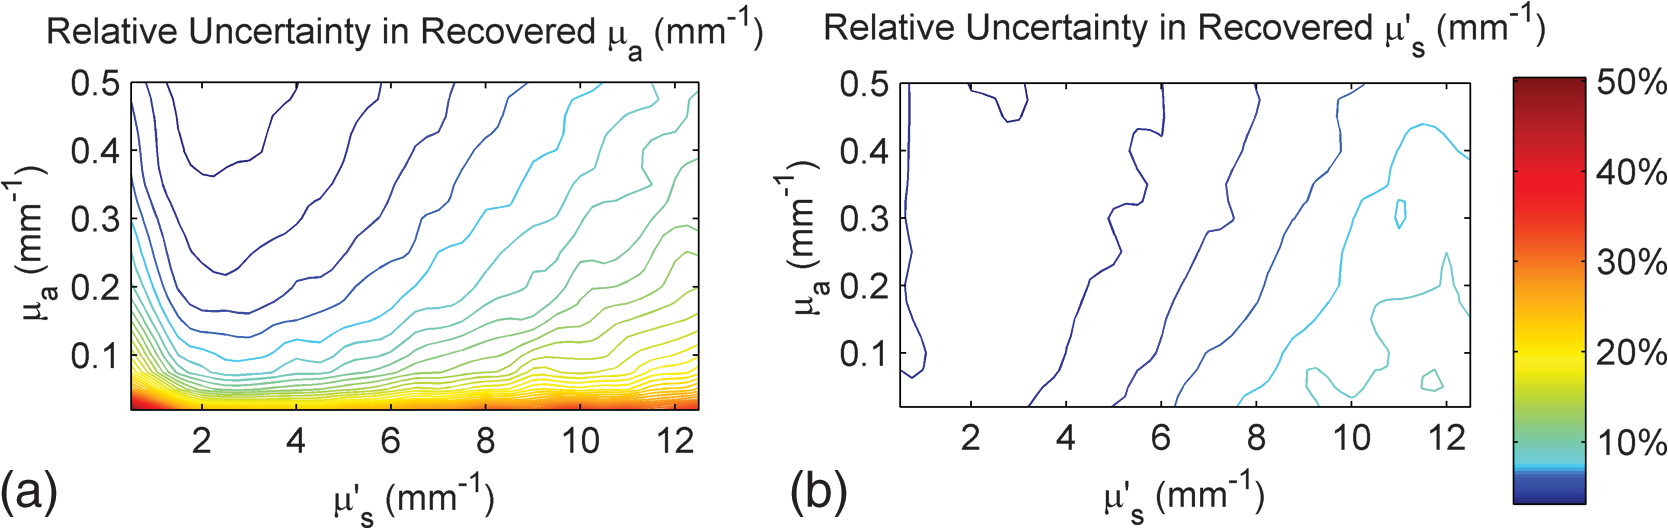 4.ConclusionMonte Carlo simulations were used to determine the minimum diameter of a fiber-optic probe meant for the recovery of optical properties from spatially resolved diffuse reflectance spectra. This was investigated over the wide range of optical properties expected in brain tissue, and the minimum diameter was found to be 1.5 mm. It was discovered that for small probe designs in which detector fibers are placed close to the edge, the true geometry of the probe must be simulated and the different refractive indices at the tissue surface must be considered. A hybrid look-up table/Mono Monte Carlo algorithm was developed to efficiently generate reflectance data that account for the true geometry of the probe. Fitting these data to measured SR-DRS data will allow optical property recovery in brain tissue. These methods were used to develop a novel, small-diameter fiber-optic probe design for use in a DRS instrument. Simulations with expected signal-to-noise ratios indicated acceptable performance across the range of optical properties of brain tissue. Although the data presented here are for a specific probe design, the algorithm could be readily adapted for any desired probe geometry. The algorithm is compatible with small-diameter probes that are easy to manipulate in surgical cavities. AppendicesAppendix:Reflectance Recovery ExampleA worked example showing the process of recovering the reflectance from the true probe simulating grid is shown in Figs. 11 and 12 for optical properties of and . Fig. 11The true probe inverse reflectance recovery process. (a) The grid is collapsed in one dimension by applying Eq. (2) to incorporate the target value. (b) The target value of is incorporated by interpolating between values, thus collapsing the grid further. (c) The expected reflectance collected by each detector when performing a measurement on a sample with optical properties and .  Fig. 12A worked example showing the process of reflectance recovery from the true probe simulating grid for optical properties of and . (a) The reflectance collected by the closest detector () is recovered. Selected data are shown in the table for to 2, and path lengths of 1.462 to 1.692 mm. (b) Equation (2) is applied to incorporate the absorption , thus collapsing each row of the table. (c) Data are interpolated by cubic splines to incorporate the scattering, . (d) This procedure is applied for all three source–detector separations in the probe.  ReferencesM. S. EljamelG. LeeseH. Moseley,
“Intraoperative optical identification of pituitary adenomas,”
J. Neurooncol., 92
(3), 417
–421
(2009). http://dx.doi.org/10.1007/s11060-009-9820-9 JNODD2 0167-594X Google Scholar
K. M. Daviset al.,
“Intraoperative ultrasound can decrease the re-excision lumpectomy rate in patients with palpable breast cancers,”
Am. Surg., 77
(6), 720
–725
(2011). AJOOA7 0096-6347 Google Scholar
J. S. Wuet al.,
“Transsphenoidal pituitary macroadenomas resection guided by PoleStar N20 low-field intraoperative magnetic resonance imaging: comparison with early postoperative high-field magnetic resonance imaging,”
Neurosurgery, 65
(1), 63
–71
(2009). http://dx.doi.org/10.1227/01.NEU.0000348549.26832.51 NEQUEB Google Scholar
D. S. OhP. M. Black,
“A low-field intraoperative MRI system for glioma surgery: is it worthwhile?,”
Neurosurg. Clin. N. Am., 16
(1), 135
–141
(2005). http://dx.doi.org/10.1016/j.nec.2004.07.010 1042-3680 Google Scholar
W. Stummeret al.,
“Extent of resection and survival in glioblastomamultiforme: identification of and adjustment for bias,”
Neurosurgery, 62
(3), 564
–576
(2008). http://dx.doi.org/10.1227/01.neu.0000317304.31579.17 NEQUEB Google Scholar
M. L. C. van Veelenet al.,
“Supratentorial low grade astrocytoma: prognostic factors, dedifferentiation, and the issue of early versus late surgery,”
J. Neurol. Neurosurg. Psychiatry, 64
(5), 581
–587
(1998). http://dx.doi.org/10.1136/jnnp.64.5.581 JNNPAU 0022-3050 Google Scholar
Z. Volynskayaet al.,
“Diagnosing breast cancer using diffuse reflectance spectroscopy and intrinsic fluorescence spectroscopy,”
J. Biomed. Opt., 13
(2), 024012
(2008). http://dx.doi.org/10.1117/1.2909672 JBOPFO 1083-3668 Google Scholar
J. Q. Brownet al.,
“Quantitative optical spectroscopy: a robust tool for direct measurement of breast cancer vascular oxygenation and total hemoglobin content in vivo,”
Cancer Res., 69
(7), 2919
–2926
(2009). http://dx.doi.org/10.1158/0008-5472.CAN-08-3370 CNREA8 0008-5472 Google Scholar
R. A. Schwarzet al.,
“Noninvasive evaluation of oral lesions using depth-sensitive optical spectroscopy,”
Cancer, 115
(8), 1669
–1679
(2009). http://dx.doi.org/10.1002/cncr.v115:8 CANCAR 1097-0142 Google Scholar
D. C. G. de Veldet al.,
“Autofluorescence and diffuse reflectance spectroscopy for oral oncology,”
Lasers Surg. Med., 36
(5), 356
–364
(2005). http://dx.doi.org/10.1002/(ISSN)1096-9101 LSMEDI 0196-8092 Google Scholar
S. A. Tomset al.,
“Intraoperative optical spectroscopy identifies infiltrating glioma margins with high sensitivity,”
J. Neurosurg., 57
(4), 382
–391
(2005). http://dx.doi.org/10.3171/2011.2.JNS101451 NEQUEB Google Scholar
P. A. Valdeset al.,
“Quantitative fluorescence in intracranial tumor: implications for ALA-induced PpIX as an intraoperative biomarker,”
J. Neurosurg., 115
(1), 11
–17
(2011). http://dx.doi.org/10.3171/2011.2.JNS101451 JONSAC 0022-3085 Google Scholar
W. Stummeret al.,
“Fluorescence-guided surgery with 5-aminolevulinic acid for resection of malignant glioma: a randomised controlled multicentre phase III trial,”
Lancet Oncol., 7
(5), 392
–401
(2006). http://dx.doi.org/10.1016/S1470-2045(06)70665-9 LOANBN 1470-2045 Google Scholar
A. Dharet al.,
“Elastic scattering spectroscopy for the diagnosis of colonic lesions: initial results of a novel optical biopsy technique,”
Gastrointest. Endosc., 63
(2), 257
–261
(2006). http://dx.doi.org/10.1016/j.gie.2005.07.026 GAENBQ 0016-5107 Google Scholar
M. D. Kelleret al.,
“Autofluorescence and diffuse reflectance spectroscopy and spectral imaging for breast surgical margin analysis,”
Lasers Surg. Med., 42
(1), 15
–23
(2010). http://dx.doi.org/10.1002/lsm.v42:1 LSMEDI 0196-8092 Google Scholar
I. J. Bigioet al.,
“Diagnosis of breast cancer using elastic-scattering spectroscopy: preliminary clinical results,”
J. Biomed. Opt., 5
(2), 221
–228
(2000). http://dx.doi.org/10.1117/1.429990 JBOPFO 1083-3668 Google Scholar
T. Svenssonet al.,
“Characterization of normal breast tissue heterogeneity using time-resolved near-infrared spectroscopy,”
Phys. Med. Biol., 50
(11), 2559
–2571
(2005). http://dx.doi.org/10.1088/0031-9155/50/11/008 PHMBA7 0031-9155 Google Scholar
J. B. Fishkinet al.,
“Frequency-domain photon migration measurements of normal and malignant tissue optical properties in a human subject,”
Appl. Opt., 36
(1), 10
–20
(1997). http://dx.doi.org/10.1364/AO.36.000010 APOPAI 0003-6935 Google Scholar
M. GurfinkelT. PanE. M. Sevick-Muraca,
“Determination of optical properties in semi-infinite turbid media using imaging measurements of frequency-domain photon migration obtained with an intensified charge-coupled device,”
J. Biomed. Opt., 9
(6), 1336
–1346
(2004). http://dx.doi.org/10.1117/1.1803549 JBOPFO 1083-3668 Google Scholar
A. KimB. C. Wilson,
“Measurement of ex vivo and in vivo tissue optical properties: methods and theories,”
Optical-Thermal Response of Laser-Irradiated Tissue, 267
–319 Springer, Netherlands
(2011). Google Scholar
A. Kimet al.,
“A fiberoptic reflectance probe with multiple source-collector separations to increase the dynamic range of derived tissue optical absorption and scattering coefficients,”
Opt. Express, 18
(6), 5580
–5594
(2010). http://dx.doi.org/10.1364/OE.18.005580 OPEXFF 1094-4087 Google Scholar
S. T. Flocket al.,
“Monte Carlo modeling of light propagation in highly scattering tissues. I. Model predictions and comparison with diffusion theory,”
IEEE Trans. Biomed. Eng., 36
(12), 1162
–1168
(1989). http://dx.doi.org/10.1109/TBME.1989.1173624 IEBEAX 0018-9294 Google Scholar
L. WangS. L. JacquesL. Zheng,
“MCML—Monte Carlo modeling of light transport in multi-layered tissues,”
Comput. Methods Programs Biomed., 47
(2), 131
–146
(1995). http://dx.doi.org/10.1016/0169-2607(95)01640-F CMPBEK 0169-2607 Google Scholar
R. Graaffet al.,
“Condensed Monte Carlo simulations for the description of light transport,”
Appl. Opt., 32
(4), 426
–434
(1993). http://dx.doi.org/10.1364/AO.32.000426 APOPAI 0003-6935 Google Scholar
A. KienleM. S. Patterson,
“Determination of the optical properties of turbid media from a single Monte Carlo simulation,”
Phys. Med. Biol., 41
(10), 2221
–2227
(1996). http://dx.doi.org/10.1088/0031-9155/41/10/026 PHMBA7 0031-9155 Google Scholar
Y. Yuanet al.,
“High-throughput acousto-optic-tunable-filter-based time-resolved fluorescence spectrometer for optical biopsy,”
Opt. Lett., 34
(7), 1132
–1134
(2009). http://dx.doi.org/10.1364/OL.34.001132 OPLEDP 0146-9592 Google Scholar
M. G. Mülleret al.,
“Intrinsic fluorescence spectroscopy in turbid media: disentangling effects of scattering and absorption,”
Appl. Opt., 40
(25), 4633
–4646
(2001). http://dx.doi.org/10.1364/AO.40.004633 APOPAI 0003-6935 Google Scholar
S. C. Kanicket al.,
“Extraction of intrinsic fluorescence from single fiber fluorescence measurements on a turbid medium,”
Opt. Lett., 37
(5), 948
–950
(2012). http://dx.doi.org/10.1364/OL.37.000948 OPLEDP 0146-9592 Google Scholar
C. M. GardnerS. L. JacquesA. J. Welch,
“Fluorescence spectroscopy of tissue: recovery of intrinsic fluorescence from measured fluorescence,”
Appl. Opt., 35
(10), 1780
–1792
(1996). http://dx.doi.org/10.1364/AO.35.001780 APOPAI 0003-6935 Google Scholar
G. M. PalmerN. Ramanujam,
“Monte-Carlo-based model for the extraction of intrinsic fluorescence from turbid media,”
J. Biomed. Opt., 13
(2), 024017
(2008). http://dx.doi.org/10.1117/1.2907161 JBOPFO 1083-3668 Google Scholar
J. WuM. S. FeldR. P. Rava,
“Analytical model for extracting intrinsic fluorescence in turbid media,”
Appl. Opt., 32
(19), 3585
–3595
(1993). http://dx.doi.org/10.1364/AO.32.003585 APOPAI 0003-6935 Google Scholar
D. J. Capponet al.,
“A novel optical property recovery algorithm for use in the optical biopsy of brain tissue,”
Biomedical Optics, OSA Technical Digest, Optical Society of America, Miami, FL
(2012). Google Scholar
L. G. HenyeyJ. L. Greenstein,
“Diffuse radiation in the Galaxy,”
Astrophys. J., 93 70
–83
(1941). http://dx.doi.org/10.1086/144246 ASJOAB 0004-637X Google Scholar
S. Prahlet al.,
“A Monte Carlo model of light propagation in tissue,”
Proc. SPIE, 5 102
–111
(1989). PSISDG 0277-786X Google Scholar
C. Zhuet al.,
“Diagnosis of breast cancer using fluorescence and diffuse reflectance spectroscopy: a Monte-Carlo-model-based approach,”
J. Biomed. Opt., 13
(3), 034015
(2008). http://dx.doi.org/10.1117/1.2931078 JBOPFO 1083-3668 Google Scholar
A. N. Yaroslavskyet al.,
“Optical properties of selected native and coagulated human brain tissues in vitro in the visible and near infrared spectral range,”
Phys. Med. Biol., 47
(12), 2059
–2073
(2002). http://dx.doi.org/10.1088/0031-9155/47/12/305 PHMBA7 0031-9155 Google Scholar
T. J. FarrellM. S. PattersonB. Wilson,
“A diffusion theory model of spatially resolved, steady-state diffuse reflectance for the noninvasive determination of tissue optical properties in vivo,”
Med. Phys., 19 879
–888
(1992). http://dx.doi.org/10.1118/1.596777 MPHYA6 0094-2405 Google Scholar
G. M. PalmerN. Ramanujam,
“Monte Carlo-based inverse model for calculating tissue optical properties. Part I: Theory and validation on synthetic phantoms,”
Appl. Opt., 45
(5), 1062
–1071
(2006). http://dx.doi.org/10.1364/AO.45.001062 APOPAI 0003-6935 Google Scholar
|
|||||||||||||||||||||||||||||||||||||||||||||||||||||||||||||||||||||||||||||||||||||||||||||||||||||||||||||


