
|
|
1.IntroductionOptical coherence tomography (OCT)1 is a high-resolution noninvasive imaging technique that allows imaging translucent structures.2 Originally developed for applications in the field of ophthalmology, OCT has been extended to imaging a wide variety of other biological tissues. It has been observed that many tissues, such as muscle, teeth, nerve, bone, and cartilage and various ocular tissues3,4 as well as composite structures in material science,5 exhibit birefringence. One of the most promising functional extensions—polarization-sensitive (PS) OCT (Refs. 67.–8) can be used both in biomedical applications and in material science. PS-OCT allows measuring the polarization properties of the object being imaged as well as its reflectivity. Making the OCT sensitive to the polarization properties of the object increases the contrast in the image as well as opening avenues to perform quantitative measurements.3 Applications of PS-OCT are diverse such as material strain field mapping,9 burn depth estimation,10 and retinal fiber layer assessment.11 Most of the early works on PS-OCT were done by sequentially illuminating the sample with polarized light and then calculating its polarization properties. The sequential approaches offered sufficient polarization data,12 but the sequential nature of the measurements slowed down the acquisition process. Other approaches relied on using two separated optical imaging channels of vertically and horizontally polarized light and then detecting each channel with a different detector.8,9 This approach required two complete OCT imaging channels with separate optical splitters and electronics, including a photodetector unit. If balance detection was to be implemented, such schemes required four photodetectors. Moreover, the conventional approaches require the division of an already weak object signal in order to record several channels at the same time. Other solutions applied electro-optic modulators and achieved stable signal carrier creation and increased speed in the sequential measurement of the polarization states.13 Another report considered a dual electro-optic modulator and demonstrated Stokes vector measurements at up to 0.5 MHz, effectively decreasing the adverse impact of sample movement-induced alignment errors in polarization calculations.14 Configurations employing acousto-optic deflectors (AODs) were previously demonstrated as a tool for stable carrier creation in OCT (Ref. 15) and low coherence interferometry.16 Also, pairs of Bragg cells were combined with a multiple delay element for simultaneous depth time domain (TD) OCT imaging17 and for long-range swept source imaging.18 This article extends the applicability of multiple path OCT channels’ configurations based on AODs toward demonstrating PS functionality. We present a novel configuration which employs a multiplexer configuration based on two acousto-optic deflectors (AODs)10 that can allow a diversity of polarization states being detected simultaneously. Such a multiplexer is used here to create two simultaneous imaging channels. Both imaging channels carry information about the amplitudes of interference that arise from vertically and horizontally oriented polarized light in two separate channels, V and H, respectively. The same balanced photodetector unit is used for both V and H channels and the amplitude and the polarization information is coded on the modulation of carriers of different frequencies for the two polarization channels. One of the main advantages of our setup is that it allows multiple channel imaging without imposing any requirement for division of the light backscattered from the object to be shared by different OCT channels. 2.Methods2.1.Experimental SetupFigure 1 shows a sketch of the assembled instrument. A broadband superluminescent diode (SLD) light source (Superlum S840-B-I-20) emits a beam with a center wavelength and a bandwidth . The light is further amplified by an Optical power booster SOA-840-30 up to 25 mW, whereas the optical bandwidth is reduced to . The optical power is equally divided by an optical fiber beam splitter into object and reference arms. Both object and reference arms employ AODs that serve multiple purposes: (1) up-shift optical beam frequencies, (2) create multiple beams in the reference arm, and (3) equalize the dispersion in both arms. After each AOD in the system, only the first-order diffracted beams are selected using pinholes (pinholes and blocked beams are not shown in the figure). Bare fiber polarization controllers, POLC1 and POLC2, are used to maximize the amount of vertically polarized light, which is launched into AOD11 and AOD21. Immediately after AOD11 and AOD21, the light in the object and reference arms passes through linear polarizers (LPs) (Thorlabs, New Jersey LPNIR050-MP) to eliminate any residual horizontally polarized light. Fig. 1Schematic layout of the RF-encoded polarization optical coherence tomography (OCT) system. MO1, 2, 3, 4: microscope objectives; AOD11, 12, 21, 22: acousto-optic deflectors; POLC1, 2, 3, 4: polarization controllers; LP: linear polarizers; OPDC: optical path difference compensator; HWP: half wave plate; QWP: quarter wave plate; XYSH: transversal scanning head equipped with mirrors to scan along X and Y; L1, L2: lenses; M: mirror; DFS: digital frequency synthesizer; DCR: dispersion compensator rod; LSS: linear scanning stage; Tx, Ty: scanner controllers; AL: achromatic doublet lens; OL objective lens; BS: beamsplitter; T: electrical signal splitter; A1, 2 signal amplifiers, Mx1, 2 frequency mixers; FG1, 2: frequency generators; BpF1, 2: bandpass filters; PC: personal computer equipped with a digitizer to produce the image on the PC display.  Four AODs (Gooch and Housego, United Kingdom 46080-1-.85-LTD) are used that are excited by signals delivered by digital frequency synthesizers (Gooch and Housego MSD040-150-0.8ADS2-A5H-8X1). In the object arm, AOD11 and AOD12 are operated at a frequency , so the light which propagates through AOD11 and AOD12 is upshifted by . After AOD12, the vertically polarized light passes through a zero-order quarter wave plate (QWP) rotated at 45 deg to produce circularly polarized light. Returning light, backscattered from the sample, passes the same QWP once again and is injected into a single-mode 50/50 fiber coupler. In the reference arm, both AOD21 and AOD22 are simultaneously operated at and frequencies. This helps to create and later recombine two first-order diffracted beams that are, respectively, upshifted by (V imaging channel) and (H imaging channel). After being diffracted by AOD21, one of the diffracted beams (H channel) passes through a zero-order half-wave plate (HWP) rotated at 45 deg, which rotates the polarization by 45 deg, ensuring the horizontal polarization of the beam. In the optical path of the second beam (V channel), a glass optical path difference compensator (OPDC) is inserted which has an optical thickness equivalent to the sum of the optical thickness of the HWP plus the OPD due to crystal birefringence in the AOD22. The OPD induced by the crystal is due to the different values of the refraction index along and axes. At 830 nm, the birefringence is . Experimentally measured OPD in air of 3.66 mm is in agreement with the result calculated using the crystal length of , specified by manufacturer. The two deflected beams are recombined by AOD22 and then injected into the 50/50 single-mode fiber coupler. At this point, we have two orthogonally polarized beams travelling similar paths. The light from the fiber coupler is detected with a balanced detector New Focus 1807, bandwidth is 80 MHz. The beating between the object and reference arm signals leads to two radio frequency encoded channels, operating at 8.3 and 29.78 MHz frequencies present in the RF spectrum of the photodetected signal. Images are obtained by raster scanning the object using a pair of closely spaced galvanometer scanners XYSH, controlled by a ramp generator Tx and a sawtooth generator Ty. Axial scanning is obtained by moving the linear scanning stage (LSS) equipped with actuator (Newport, Rhode Island, LTA-HS). The position of the LSS is digitally controlled via a Newport universal Motion controller ESP300 through a RS232 PC interface. The setup can support two imaging modes: (1) three-dimensional volume imaging where the LSS is moved in between the acquisition of subsequent en-face images and (2) B-scan imaging where the slow scanner, , is kept stationary while continuously scanning the LSS in conjunction with fast scanning. In both cases, the system is controlled using the LabView interface on the personal computer. The light in both object and reference arms is launched from fibers using lenses MO1 and MO2 (New Focus, New York 5724-B-H), and the full-width half-maximum (FWHM) of the transversal power distribution profile of collimated beams after the launchers is 0.8 mm. In the reference arm, the light is reinjected into fiber using the same New Focus 5724-B-H MO4 lens. In the object arm, we have chosen to use a lens MO3 ( OFR LLO-4-18-NIR) to increase the object light collection efficiency. The images are obtained using an aspheric objective lens (OL). The resulting numerical aperature (NA) of the interface optics toward the object is 0.02 and that determines an Airy disk diameter of of the beam focused on the object. Both arms of the second fiber coupler are equipped with polarization controllers POLC3 and POLC4. These enable the control of the polarization with the aim to ensure that the relative polarization of the light from the object and reference arms before being injected into the 50/50 fiber coupler is the same as in free space. The condition of having the same relative polarization is ensured by observing the interference peaks and adjusting fiber polarization controllers, POLC3 and POLC4, in such a way that when a silver mirror is used as an object, maximum interference is obtained in channel H, whereas minimum interference is obtained in channel V. 2.2.Demultiplexing of RF Spectrum of the Photodetected SignalThe RF spectrum of the photodetected signal contains multiple carrier signals that are created by beating of the object and reference arm beams. In this section, we present how multiple carriers, carrying the interference information from different channels created by multiplexer, are extracted from the photodetected spectrum and then recorded for further digital processing. Figure 2 illustrates a typical RF spectrum of the photodetected signal that was obtained by using a combination of an aluminum mirror and a sheet of birefringent plastic as an object and registering the spectrum by connecting the photodetector directly to the HP8590A spectrum analyzer. The photodetected signal contained peaks from both V and H channels. The two AODs in the object arm were driven at , whereas the AOD21 and AOD22 in the reference arm were driven at and , respectively. The interference information from the light with different polarization states is carried by signals of frequencies of 8.3 and 29.78 MHz. Fig. 2Typical photodetected RF spectrum when two signals are applied simultaneously to the AODs pair in the reference arm of the interferometer. Letters V and H denote two channels carrying the imaging information. 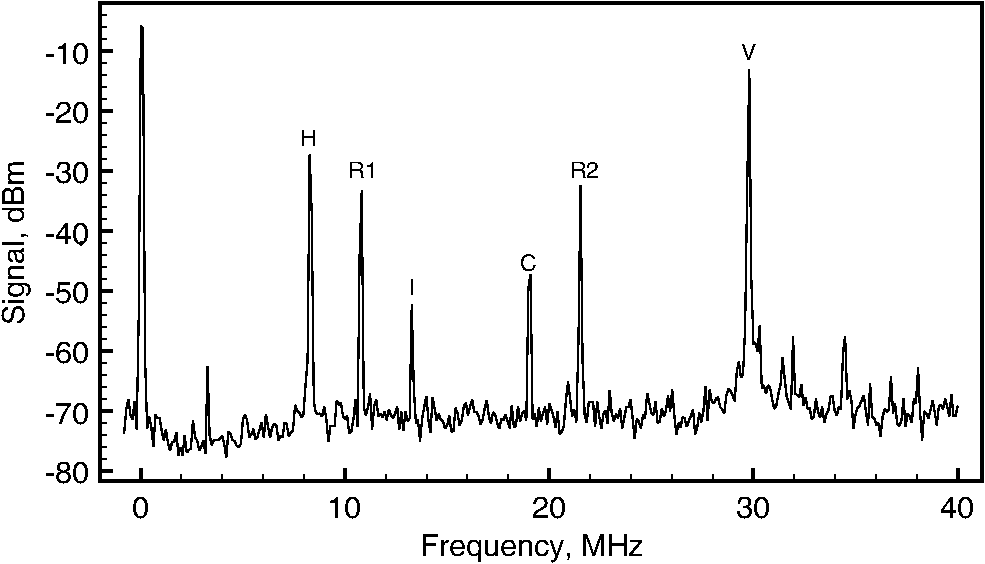 When two sinusoidal signals of frequency and propagate through the acousto-optic crystal, several harmonics are generated, including harmonics pulsating at multiples of each frequency, as well as at the sums and differences of these harmonics, known as elastic two-tone third-order intermodulation frequencies.19 As a result, in addition to main peaks, third-order intermodulation peaks arise, and care has to be taken for such intermodulation products not to fall within the photodetected RF spectrum window. The peaks and in Fig. 2 are due to the interference of the light in the reference arm and remains even if the light from the object arm is blocked. The reference arm crosstalk components can be found at and , and if necessary, they can be easily eliminated by background subtraction techniques. The peak is one of the third-order intermodulation peaks that occur due to crystal lattice interactions and it is always present at . The other significant third-order intermodulation product appears at . Third-order intermodulation products can be reduced by applying lower RF power to the acousto-optic crystal. The last significant peak appears due to the light being diffracted first by the grating produced by signal at and then by signal at or vice versa. The light producing peak propagates at a different angle than a multiplexed beam, however, some of it is still injected into the fiber. Peak can be minimized and eventually eliminated by: (1) increasing the difference in frequency between the frequencies of signals applied to adjacent channels and (2) reducing the numerical aperture of MO2 and MO4. However, additional peaks present in the spectrum do not deteriorate image quality, as they are outside the bandwidth of the RF demultiplexer. In this article, the system was used to create en-face OCT images of up to 5-mm lateral size, determining along the lateral coordinate. The bandwidth required when laterally scanning the beam at 500 Hz (1 ms for each ramp) over 200 pixels is . The technology of AODs, however, allows larger carrier frequencies in order to accommodate larger bandwidths for faster en-face scanning. In case a resonant scanner at 8 kHz was used, scanning laterally at 16-kHz line rate15 would determine a 16 times increase in the bandwidth necessary in comparison with what reported in this article, i.e., 6.4 MHz. Such bandwidth can be accommodated by AODs operating at several hundreds of megahertz and there are already commercial devices operating at over 300 MHz. The carrier signals for channels V and H are extracted from the photodetected signal RF spectrum using the RF demultiplexer. In the demultiplexer, the signal is split equally into two channels using a signal splitter T (HP 15104A). The resulting signals are then amplified with low noise amplifiers (Mini Circuits, New York ZFL-1000LN). The amplifiers act as electrical isolators that reduce crosstalk between the channels. The signals for both channels are downshifted using a combination of mixers Mx1 (Mini Circuits ZAD-8+), Mx2 (Mini Circuits ZAD-1-1) and signal generators FG1 (Stanford Research DS335) and FG2 (Stanford Research DS345) operating at frequencies equal to the signal carrier frequencies of both channels. The resulting signal from the mixer now contains both products of subtraction and summation of the photodetected and generated frequencies applied to the mixer inputs. The carrier signal, centered at 0 Hz, is subsequently extracted and separated from the rest of the spectrum using a 300-kHz low pass filter (Stanford Research SR560). (The next setting of the low pass filter was 1 MHz, and the increase in sharpness from the 300 kHz setting was insignificant in comparison with the increase in noise, therefore, some compromise of the transversal resolution was accepted.) The two resulting channels are sent to a NI 6110 card via a NI SCB-68 interface, where they are digitized and registered in the PC. 2.3.Method of Calculating the Sample Reflectivity and Birefringence ParametersThe polarization states of the light traveling through the interferometer can be described by the Jones formalism.20,21 Here, we present a simplified explanation of the model for the light propagation through reference and object arms. A more complete mathematical treatment of the polarization states of the light passing through a similar system can be found in Ref. 22. In both object and reference arms, the beams after exiting the AOD11 and AOD21 are polarized vertically with LPs. In the reference arm, the vertically polarized beam remains vertically polarized. After passing through the HWP with its fast axis rotated at 45 deg, the polarization state of the beam , is rotated by 90 deg. Both the beams are recombined into a single beam by AOD22; however, the orthogonal polarization states’ components are now modulated at different frequencies. The Jones matrix representing the polarization properties of an object can be written as that of a general retarder. In the object arm, at the point where the light is injected into MO3, its Jones vector can be described as a product of initial vertical polarization state propagated in reflection through QWP, sample, as well considering the reflectance R of the observed point in the sample. It is broadly known that the interference resulting from the V and H channels in the reference arm and the object beam can be calculated using the formula where and are the intensities of the object and reference beams, respectively, for , 2 for the V and H channel, is the modulus of the complex degree of coherence, and is the phase term of the interference signal. Eventually, using a Jones vector describing the object arm light at the injection point MO4, Eq. (1), and the known Jones vectors for both channels in the reference arm, the phase retardation and reflectivity parameters can be shown23,24 to be obtained using the following equations:3.ResultsFigure 3 shows the autocorrelation function of the system, measured using a phantom consisting of a combination of a mirror and a thin birefringent plastic plate as an object (injection molded clear polystyrene Petri dish). For this measurement, the XYSH scanning mirrors were kept stationary and the plastic plate was moved laterally along and directions until both interference peaks V and H reached the same amplitude. The autocorrelation function was measured by axially scanning the LSS on which the launcher holding the fiber input after AOD22 was mounted. For a spectral FWHM of 15 nm, the autocorrelation function FWHM should have been 40 μm, however, a value of to 60 μm was obtained (the depth resolution is half of these values, as moving the input fiber to the balanced coupler modifies a single trip of the wave along the reference path). This shows that the system still retains some uncompensated dispersion. Additionally, it can be seen that the FWHM for the V channel is higher by . This indicates that although optical path was compensated using the OPDC glass rod, due to mismatch of optical materials Abbe numbers, the differential dispersion between two channels still remained. The signal to noise ratio, when using a silver mirror in conjunction with a 30,000 times attenuator as a sample, was measured to be 47 dB. As , the sensitivity of the instrument results as 92 dB. Fig. 3Normalized autocorrelation function for the compound source used in the experiments. The blue crosses and green circles show measured values for Channels H and V, respectively, the solid lines are obtained by spline fitting. 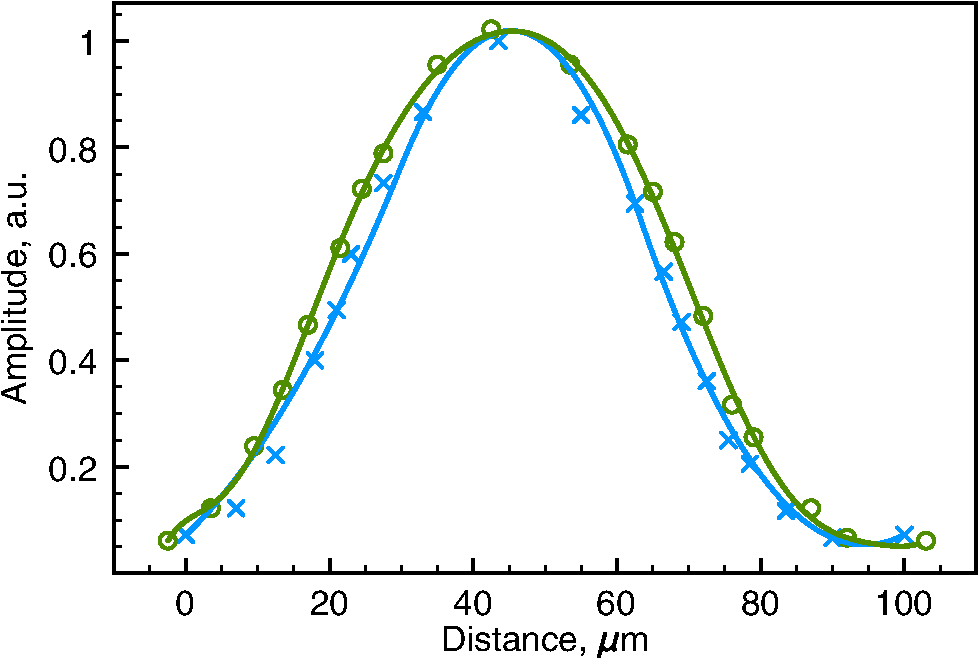 The increased FWHM of the autocorrelation function may be due to uncompensated dispersion between the object and the reference arm as only a glass rod dispersion compensator rod was used in the reference arm to partially compensate for the dispersion induced by beamsplitter, QWP, two achromatic lenses, and OL. The most straightforward way to improve the autocorrelation function would be to include matching optics in the reference arm, just after L2. We did not find it necessary to resort to a more increased complexity of the dispersion compensation system due to the narrow band of 15 nm of the compounded light source employed. To demonstrate the performance of the set-up in biological tissue, we performed in-vitro imaging of two samples of a chicken breast muscle tissue: a raw sample and another thermally damaged sample by a short contact with a hotplate. Both samples were cut from adjacent areas of the same muscle. For the intact sample, 131 C-scans were recorded with an increment of 13 μm. For the thermally damaged sample imaging, the scanning range of a fast scanner, , was increased by 50% and 159 C-scans were recorded with an increment of 19 μm. Reconstructed pseudo B-scan images consist of and , respectively, where any single pixel was exposed for 2 μs with a radiant flux on the sample of about 3 mW. The reflectivity and birefringence images that were calculated using Eqs. (2) and (3) are presented in Fig. 4. Fig. 4In-vitro images of intact (a, b) and thermally damaged (c, d) muscle tissue. Top images show reflectivity of the sample while bottom images show the phase retardation as a function of depth . The reflectivity images are presented in a logarithmic scale. A low pass Fourier filter was applied on birefringence images to enhance the visibility of the birefringence bands. 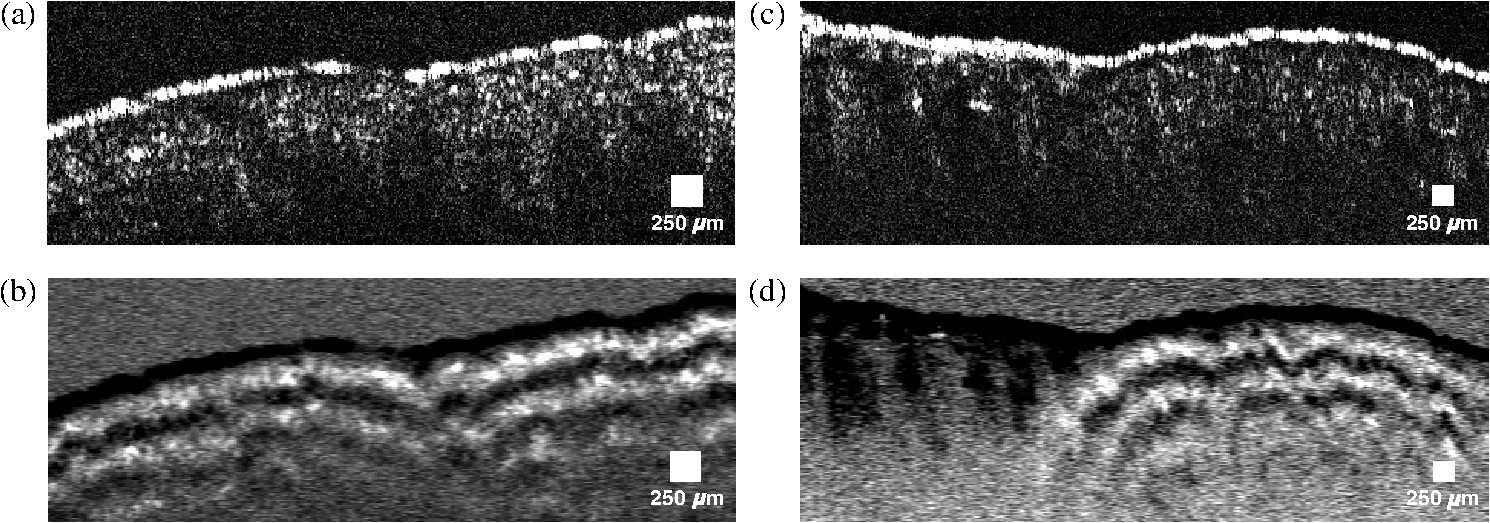 The images that show phase retardation were additionally Fourier filtered to remove the high-frequency components. A low pass filter was applied to remove features smaller than 3 pixels in the collected en-face images and B-scans were constructed from filtered images. In this way, the resolution along the axial direction, which determines the contrast of birefringence bands, was not affected. Filtering has reduced noise while conserving the birefringence information carried by lower spatial frequencies, allowing easier visual interpretation and potentially simplified automated segmentation of the birefringence image. The pseudo B-scans in Fig. 4 present the two pairs of polarization insensitive and the birefringence images acquired from a sample of chicken muscle tissue. First, the images of intact tissue were acquired [Figs. 4(a) and 4(b)] and then the collagenous matrix of the tissue was altered by a short contact with a hotplate and the imaging was repeated. Although the difference between the polarization insensitive images a and c is not obvious, clear distinction of birefringence maps is visible in Figs. 4(b) and 4(d), where in Fig. 4(d), the vanishing bands on the right indicate thermal damage. 4.DiscussionThe method presented in this article demonstrates the versatility of frequency-domain multiplexed TD-OCT, employing the pairs of Bragg cells to create multiple imaging channels. Two orthogonal polarization states are processed to produce birefringence maps and polarization-insensitive images. The configuration presented has the potential to also achieve multiple depth imaging capability.17 The method may be used to provide birefringence information from several depths simultaneously if the other channels available in the set of synthesizers are used. Although this looks possible, extra care and more research is required in reducing the crosstalk between channels and increasing the sensitivity. This may be made possible if a larger power broadband source is used to allow for higher order splitting of power in the reference path. This information could be used to predict the birefringence maps over the whole volume of the sample, enabling fast screening of multiple areas and pinpointing of problematic zones where further investigation is needed. Due to birefringence of used for the acousto-optic crystals, with the current system design, only two orthogonal polarization states could propagate unaltered through the recombining AOD22 in the reference arm. Further work on the optical design of the system is needed to compensate for the birefringence of AOD22 so that any polarization state could pass through it without being altered. In this way, the multichannel capability could be used to the full extent to perform simultaneous measurements needed to calculate a Mueller matrix. The frequency multiplexing method presented here enables the imaging of several channels simultaneously, without any added penalty of dividing the object signal. Our studies show that with more refinement, the multiplexer architecture can be implemented with a Bragg cell in reflection. This can be achieved by adapting configurations used for optical delay lines25 and by using a recirculator instead of a polarization beam splitter. In such configurations, the Bragg cell is used twice, replacing two Bragg cells in the configuration presented in Fig. 1. Such an approach reduces the cost and complexity of the system by halving the number of Bragg cells required. Further studies are needed to determine the feasibility of the reflection approach. We believe that the unique ability of frequency multiplexing approach to provide multiple en-face PS images from different depths simultaneously creates further opportunities for novel clinical applications. Normally, only a reduced number of bands of birefringence exists, i.e., each band takes more than several pixels in depth that the identification of bands present can be performed using sparsely distributed lines in the B-scan. If the material is known, then the periodicity of bands can be estimated and so, the depth difference between sparsely selected T-scan lines can be calculated. For instance, in Fig. 4, where four bands exist, a minimum number of eight T-scans are needed that are selected at axial depths of periodicity bands/2. Acquisition of several independently sparsely spaced PS images can allow quick segmentation of volumetric images of tissue into areas displaying expected birefringence patterns and areas displaying unconventional patterns due to disease or external damage. If movement takes place, then all en-face images are disturbed similarly. Therefore, the method presents the potential to provide volumetric images at high frame rates, with extra capability in defining 3-D boundaries of abnormal zones in tissue based on their polarization properties. Another avenue where the strength of acquiring the PS measurements from multiple axial points could be exploited is the retinal imaging. Due to the fact that the acquisition of multiple pixels happens at the same time, frequency multiplexing approach ensures that all the axial points acquired in simultaneous multiple en-face images are perfectly overlapped laterally even in the presence of movement. Consequently, it can be guaranteed that the two signals contributing to the two orthogonally polarized channels originate from the same OPD value, unaffected by the movement of the tissue. The confidence of multiple simultaneous measurements can thus be useful to reduce the effect of microsaccades. Additionally, frequency multiplexing may be suitable for fast volumetric PS imaging with sparse sampling along the axial direction.26 5.ConclusionsThe method presented allows simultaneous collection of polarization information using the same photodetector receiver. For the moment, acquisition and processing were performed by using a spectrum analyzer tuned sequentially on the two carrier frequencies. The “Gooch and Housego 46080-1-.85-LTD” drivers can synthesize up to eight frequencies. In this way, the method is potentially expandable to simultaneously collecting several coefficients of Mueller matrices, or collecting two polarization channels from up to four different depths, without splitting the object beam into 8. AcknowledgmentsThe research leading to these results has received funding from the European Research Council under the European Union’s Seventh Framework Programme, Advanced Grant agreement ‘COGATIMABIO’, No: 249889. A. Podoleanu is also supported by the NIHR Biomedical Research Centre at Moorfields Eye Hospital NHS Foundation Trust and UCL Institute of Ophthalmology. ReferencesD. Huanget al.,
“Optical coherence tomography,”
Science, 254
(5035), 1178
–81
(1991). http://dx.doi.org/10.1126/science.1957169 SCIEAS 0036-8075 Google Scholar
A. G. Podoleanu,
“Optical coherence tomography,”
J. Microsc., 247
(3), 209
–219
(2012). http://dx.doi.org/10.1111/j.1365-2818.2012.03619.x JMICAR 0022-2720 Google Scholar
F. Fanjul-Vélezet al.,
“Polarimetric analysis of the human cornea measured by polarization-sensitive optical coherence tomography,”
J. Biomed. Opt., 15
(5), 056004
(2010). http://dx.doi.org/10.1117/1.3486540 JBOPFO 1083-3668 Google Scholar
M. PircherC. K. HitzenbergerU. Schmidt-Erfurth,
“Polarization sensitive optical coherence tomography in the human eye,”
Prog. Retinal Eye Res., 30
(6), 431
–451
(2011). http://dx.doi.org/10.1016/j.preteyeres.2011.06.003 PRTRES 1350-9462 Google Scholar
D. Stifteret al.,
“Dynamic optical studies in materials testing with spectral-domain polarization-sensitive optical coherence tomography,”
Opt. Express, 18
(25), 25712
–25725
(2010). http://dx.doi.org/10.1364/OE.18.025712 OPEXFF 1094-4087 Google Scholar
M. R. Heeet al.,
“Polarization-sensitive low-coherence reflectometer for birefringence characterization and ranging,”
J. Opt. Soc. Am. B, 9
(6), 903
–908
(1992). http://dx.doi.org/10.1364/JOSAB.9.000903 JOBPDE 0740-3224 Google Scholar
R. G. Cucuet al.,
“Polarization-sensitive OCT system using single-mode fiber,”
Proc. SPIE, 5579 170
–177
(2004). http://dx.doi.org/10.1117/12.567421 Google Scholar
J. F. de Boeret al.,
“Two-dimensional birefringence imaging in biological tissue by polarization-sensitive optical coherence tomography,”
Opt. Lett., 22
(12), 934
–936
(1997). http://dx.doi.org/10.1364/OL.22.000934 OPLEDP 0146-9592 Google Scholar
D. Stifteret al.,
“Polarisation-sensitive optical coherence tomography for material characterisation and strain-field mapping,”
Appl. Phys. A, 76
(6), 947
–951
(2003). http://dx.doi.org/10.1007/s00339-002-2065-5 APAMFC 0947-8396 Google Scholar
K. H. Kimet al.,
“In vivo imaging of human burn injuries with polarization-sensitive optical coherence tomography,”
J. Biomed. Opt., 17
(6), 066012
(2012). http://dx.doi.org/10.1117/1.JBO.17.6.066012 JBOPFO 1083-3668 Google Scholar
E. Götzingeret al.,
“Retinal nerve fiber layer birefringence evaluated with polarization sensitive spectral domain OCT and scanning laser polarimetry: a comparison,”
J. Biophotonics, 1
(2), 129
–139
(2008). http://dx.doi.org/10.1002/(ISSN)1864-0648 JBOIBX 1864-063X Google Scholar
G. YaoL. V. Wang,
“Two-dimensional depth-resolved Mueller matrix characterization of biological tissue by optical coherence tomography,”
Opt. Lett., 24
(8), 537
–539
(1999). http://dx.doi.org/10.1364/OL.24.000537 OPLEDP 0146-9592 Google Scholar
C. E. Saxeret al.,
“High-speed fiber based polarization-sensitive optical coherence tomography of in vivo human skin,”
Opt. Lett., 25
(18), 1355
–1357
(2000). http://dx.doi.org/10.1364/OL.25.001355 OPLEDP 0146-9592 Google Scholar
H. Songet al.,
“Dual electro-optical modulator polarimeter based on adaptive optics scanning laser ophthalmoscope,”
Opt. Express, 18
(21), 21892
–21904
(2010). http://dx.doi.org/10.1364/OE.18.021892 OPEXFF 1094-4087 Google Scholar
C. Hitzenbergeret al.,
“Three-dimensional imaging of the human retina by high-speed optical coherence tomography,”
Opt. Express, 11
(21), 2753
–2761
(2003). http://dx.doi.org/10.1364/OE.11.002753 OPEXFF 1094-4087 Google Scholar
N. A. RizaZ. Yaqoob,
“Submicrosecond speed optical coherence tomography system design and analysis by use of acousto-optics,”
Appl. Opt., 42
(16), 3018
–3026
(2003). http://dx.doi.org/10.1364/AO.42.003018 APOPAI 0003-6935 Google Scholar
M. ZurauskasJ. RogersA. G. Podoleanu,
“Simultaneous multiple-depths en-face optical coherence tomography using multiple signal excitation of acousto-optic deflectors,”
Opt. Express, 21
(2), 1925
–1936
(2013). http://dx.doi.org/10.1364/OE.21.001925 OPEXFF 1094-4087 Google Scholar
M. ZurauskasA. BraduA. G. Podoleanu,
“Frequency multiplexed long range swept source optical coherence tomography,”
Biomed. Opt. Express, 4
(6), 778
–788
(2013). http://dx.doi.org/10.1364/BOE.4.000778 BOEICL 2156-7085 Google Scholar
A. P. GoutzoulisD. R. PapeS. V. Kulakov, Design and Fabrication of Acousto-Optic Devices, Marcel Dekker, New York
(1994). Google Scholar
R. C. Jones,
“A new calculus for the treatment of optical systems,”
J. Opt. Soc. Am., 31
(7), 488
–493
(1941). http://dx.doi.org/10.1364/JOSA.31.000488 JOSAAH 0030-3941 Google Scholar
H. Hurwitz Jr.R. C. Jones,
“A new calculus for the treatment of optical systems,”
J. Opt. Soc. Am., 31
(7), 493
–495
(1941). http://dx.doi.org/10.1364/JOSA.31.000493 JOSAAH 0030-3941 Google Scholar
K. Schoenenbergeret al.,
“Mapping of birefringence and thermal damage in tissue by use of polarization-sensitive optical coherence tomography,”
Appl. Opt., 37
(25), 6026
–6036
(1998). http://dx.doi.org/10.1364/AO.37.006026 APOPAI 0003-6935 Google Scholar
M. R. Heeet al.,
“Polarization-sensitive low-coherence reflectometer for birefringence characterization and ranging,”
J. Opt. Soc. Am. B, 9
(6), 903
–908
(1992). http://dx.doi.org/10.1364/JOSAB.9.000903 JOBPDE 0740-3224 Google Scholar
B. H. ParkJ. F. Boer, Polarization-Sensitive Optical Coherence Tomography, 22 Springer, Berlin Heidelberg
(2008). Google Scholar
N. A. Riza,
“Acousto-optically switched optical delay lines,”
Opt. Commun., 145
(1–6), 15
–20
(1998). http://dx.doi.org/10.1016/S0030-4018(97)00377-5 OPCOB8 0030-4018 Google Scholar
J. C. Yanget al.,
“Image super-resolution via sparse representation,”
IEEE Trans. Image Process., 19
(11), 2861
–2873
(2010). http://dx.doi.org/10.1109/TIP.2010.2050625 IIPRE4 1057-7149 Google Scholar
|


