
|
|
1.IntroductionThe biomechanical properties of tissues and cells are known to contain information about the state of health of the organs or organisms where they reside. A well-known example is the physical palpation of the skin surface and underlying tissue structures to determine their gross biomechanical properties in relation to adjacent regions of tissue. A small local hardening in the breast is often found in a number of pathologies, from benign sebaceous cysts to malignant breast cancer. Thus, there is a great deal of interest in having access to versatile diagnostic tools that could differentiate pathological tissue from normal tissue in unique ways. The field of elastography involves the use of an imaging modality to provide data on the displacement, distortion, or dynamics of tissue under various forms of static or dynamic stress. Elastography methods have been developed using ultrasound, magnetic resonance, and X-ray computed tomography, among others.1–7 However, there remains a need to develop diagnostic elastography tools with the capability of measuring biomechanical properties with high resolution on the scale of small tissues and cells. A number of methods have been reported to assess the biomechanical properties of tissues using optical methods. The high spatial resolution possible with optical methods offers the ability to provide greater displacement sensitivity compared to other elastography techniques based on ultrasound and magnetic resonance elastography.8 Optical coherence elastography (OCE) has been recognized as a versatile approach for measuring and mapping biomechanical properties of biological tissues on the micron scale.9–16 OCE measurements have been used to assess the biomechanical properties of a wide variety of tissues of interest, such as measuring the stiffness of arteries,17 different skin layers,18 tissue engineering constructs,19 and the cornea.20,21 OCE requires the application of a mechanical load (stress) on the sample, and by measuring the resulting displacements, the viscoelastic properties of the sample can be extracted. Mechanical stresses are induced in the samples of interest through either dynamic or static methods. In dynamic methods, the excitation source could be external, such as mechanical compression using piezoelectric (PZT) actuators,22–24 or it could be an internal excitation, such as by using acoustic radiation force to displace the internal tissue structures.25,26 Various methods could be used to quantify the displacement of the tissues. Earlier methods for elastography using optical coherence tomography (OCT) relied on speckle-tracking algorithms to estimate tissue displacement, however, speckle de-correlation and spatial sampling limit the range of displacements that can be reliably measured.27 Phase-resolved measurements, where the axial displacements are tracked based on the phase difference between adjacent A-scans, have been more widely employed to estimate small scale displacements.16 The lower and upper limits on the displacement range using phase-resolved methods depend on the phase noise and phase wrapping, respectively. Some research groups have also used shear wave propagation25 or surface acoustic waves28 in tissue samples to measure the stiffness of the tissue. Externally applied stresses using a load cell or PZT actuators tend to be larger in scale and coverage, which may limit the high-resolution mapping of the mechanical properties. We chose to employ magnetic nanoparticles (MNPs) in this study for dynamic mechanical actuation as these could provide localized mechanical perturbations enabling the high-resolution probing of the tissue viscoelastic properties. Their small size allows them to diffuse through the tissues of interest, thereby allowing these to be used as local probes to assess the local mechanical environment of the tissues. It has been previously shown that they can enhance the contrast in OCT images29 and can be effective transducers for sensitive magnetomotive OCE (MM-OCE) measurements.30 By measuring the response of the tissue to a step excitation at high spatial and temporal resolution, we propose a new way of simultaneously measuring several biomechanical parameters of interest, such as the elastic modulus, tissue displacement rise time, creep factor, and the natural frequency of biological tissues. 2.Methods2.1.Tissue Specimen PreparationUnder a protocol approved by the Institutional Animal Care and Use Committee at the University of Illinois at Urbana-Champaign, tissues were harvested from two New Zealand white rabbits (Covance, Princeton, New Jersey) and sectioned in cubes of approximately . The fresh tissues were then completely immersed for 4 h in a room-temperature saline suspension of MNPs (#637106, average diameter 25 nm, Sigma-Aldrich, Inc., St. Louis, Missouri) with a concentration of . Prior to imaging, the tissues were rinsed with fresh saline solution and set at rest for 5 min in order to avoid fluid flow transients in the specimen during imaging. 2.2.Imaging SystemThe MM-OCE imaging system has been previously described in detail.30 Figure 1 shows a schematic of the optical system that includes the solenoid coil. In brief, a titanium:sapphire laser (KMLabs, Boulder, Colorado) with a center wavelength of 800 nm and a bandwidth of 120 nm provided the probing light for a spectral-domain OCT system. The average power incident on the specimens was 10 mW. The axial resolution was 1.7 μm and the transverse resolution was 16 μm in the specimens, assuming an average tissue index of refraction of 1.4. A small, custom-built, computer-controlled solenoid coil situated 2 mm above the specimen provided the switchable magnetic field for triggering the motion of the MNPs. The strength of the magnetic field at the measurement locations was approximately 400 G. Fig. 1Biological magnetomotive optical coherence elastography (MM-OCE) setup. A standard 800 nm spectral-domain OCT system is used with an electromagnetic coil placed in the sample arm. A magnetic field strength of approximately 400 G was used to perturb the MNPs inside the sample and changes in the magnitude and phase of the interference pattern were detected in synchrony with the A-line scan rate and activation of the magnetic field coil. 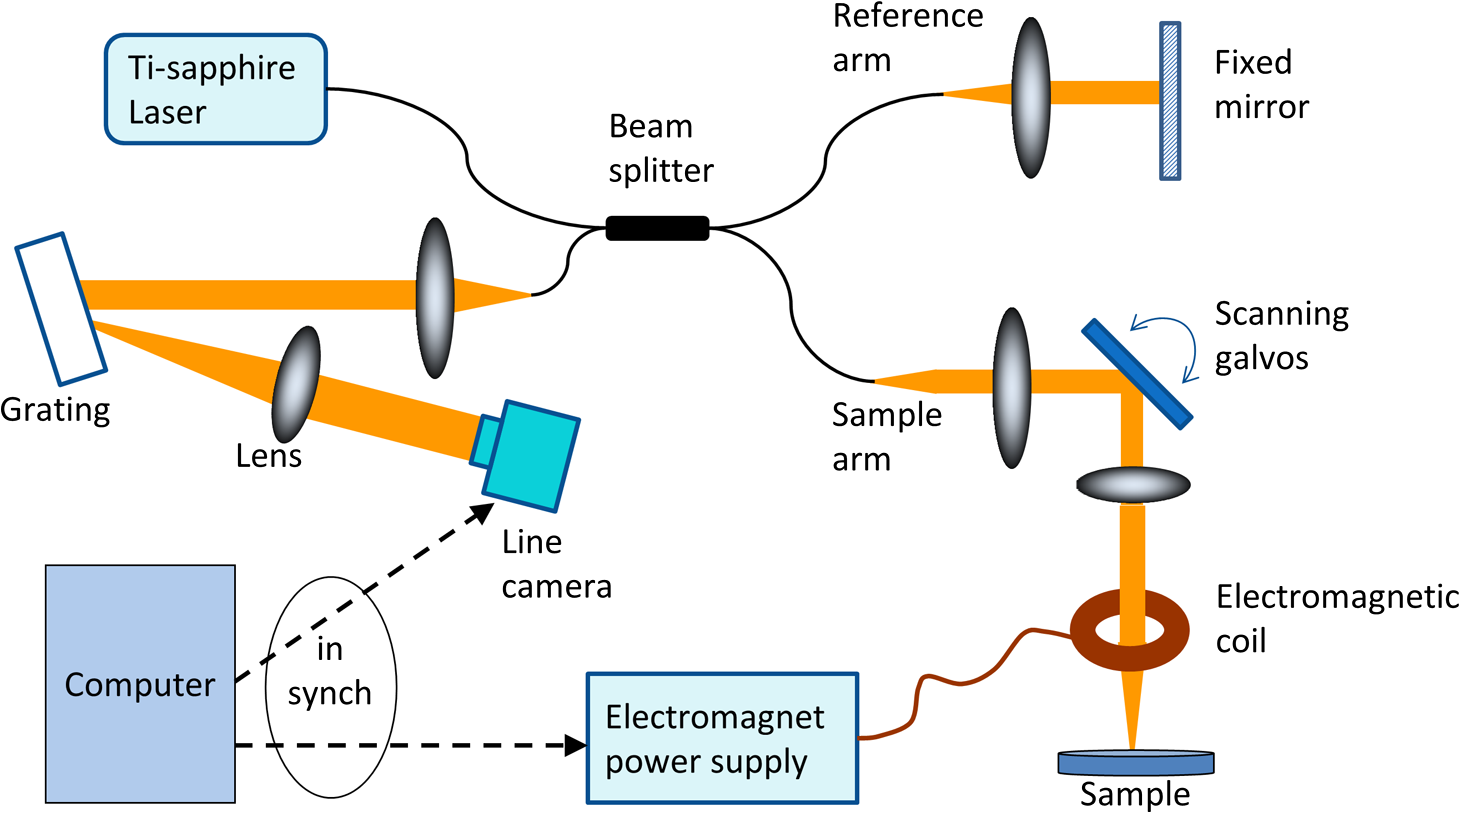 2.3.Data AcquisitionMicrorheology measurements were made from M-mode imaging data acquired at camera line rates of 5 and 20 kHz to allow high time-resolution displacement measurements of the initial dynamic response of the tissues as well as longer time measurements that would show the mechanical behavior of the tissue past the initial perturbation. Measurements were made from four different locations close to the center of each specimen. Each M-mode image consisted of 10,000 axial lines and captured four cycles of a constant step magnetic field.30 The phase content of the acquired signals was used to determine the displacements occurring in the tissue specimens, as previously demonstrated.30 The displacement sensitivity of the system was 11 nm, allowing us to detect very small displacements in real time and with high resolution. As we have shown previously, this approach to displacement measurements is preferable to amplitude measurements, whose displacement sensitivity is much lower on the order of 1 μm.30 2.4.Data AnalysisThe normalized displacement data was analyzed in MATLAB to extract the following biomechanical parameters of interest: the natural frequency of oscillation from the underdamped oscillations, the rise time, defined as the interval between the magnetic field being switched on and the moment the tissue reached the first peak of the oscillation, and the exponential creep term of the displacement following the initial oscillation. Figure 2 shows representative data for lung tissue and highlights the relevant features of the signals that are utilized to calculate the above parameters. The data shown in Fig. 2(a) was acquired with 20 kHz line scan rate and describes the fast response of the tissue while the 5 kHz data in Fig. 2(b) characterizes the slow response. In order to quantify the description of these regimes, we fit the 20 kHz data to the equation where is the displacement, is the amplitude of the oscillation, is the natural frequency of oscillation, is the time, is a phase factor, and is the damping parameter. The creep parameter is calculated by fitting the 5 kHz data to the equation where is the amplitude factor. The creep parameter quantifies how fast the tissue approaches a certain deformation state. Fig. 2Representative lung tissue response. (a) The displacement data acquired with a 20 kHz camera line rate contains a fast underdamped oscillation from which the rise time is calculated. The natural frequency of the tissue can be calculated by fitting the data after the creep component is subtracted. (b) The displacement data acquired with a 5 kHz camera line rate is fitted to determine the creep parameter, which describes how fast the tissue displaces over a large time scale compared to the initial oscillation.  Young’s moduli of the tissue specimens were calculated based on a Voigt model.31 In brief, Young’s modulus is given by the equation , where is the elastic constant of the tissue specimen, is the height of the tissue, and is the cross-sectional area of the specimen. is calculated from the expression where is the mass of the tissue specimen. 3.Results and DiscussionThe tissues measured with MM-OCE contained MNPs that had diffused into the specimens while being immersed in a concentrated suspension of MNPs in saline. Similar to our previous study with silicone tissue phantoms,30 the MNPs likely bind to the extracellular matrix of the tissue, or perhaps are internalized into some cells, and provide access to interrogate the biomechanical microenvironment of the tissue specimens when perturbed with an external magnetic field. We chose to utilize a magnetic field applied in the form of a step function that would be kept on for a period of time sufficiently long to allow the observation of the dynamic response of the tissue specimen immediately after the MNPs are set in motion. In a preliminary set of experiments, several types of rabbit tissues (adipose, heart, kidney, muscle, lung, and liver) were harvested and MM-OCE was performed. The displacement data for this set of tissue specimens is shown in Fig. 3. It is evident that each type of tissue has a distinctive response. We chose to study the lung and muscle tissues in more depth because they illustrate distinctly different types of responses, appeared more uniform than the other types of tissue, and could be handled more easily, so that each could be sectioned into simple geometric shapes such as cubes. This is important because the boundary conditions can influence the measurements of the natural frequency of oscillation, based on which Young’s moduli are calculated.13,31 Fig. 3Representative MM-OCE signals for different types of rabbit tissues acquired at a line scan rate of 20 kHz. The first transition corresponds to switching the field from off to on, while the second one corresponds to switching the field from on to off.  In another set of experiments, we performed MM-OCE measurements on tissues acquired from a different rabbit. Magnetomotive OCT images [Figs. 4(a) and 4(b)] of rabbit lung and muscle tissues acquired from the center of the specimens show the presence of the MNPs, as demonstrated by the green channel signal. Representative MM-OCE signals (normalized displacements) obtained from the lung and muscle specimens are shown in Figs. 4(c) and 4(d). M-mode MM-OCE data was taken at four nearby locations in each specimen and the displacements from bright scatterers along with the depth of the axial scans were calculated from the phase data.30 Depending on the tissue specimen and location, the number of bright scatterers varied from 6 to 20. The displacement data from these scatterers was averaged and utilized for postprocessing. Figures 4(e) and 4(f) show the noise-level signals from the same specimens when no magnetic field was present. Similar noise-level signals were observed in tissue specimens without MNPs, both with and without the switched magnetic field (data not shown). We note that the noise fluctuations of the displacement are extremely small compared to the signals we record when the magnetic field is switched from off to on or vice versa, with a ratio of maximum displacement to noise level displacement of at least . Fig. 4MM-OCT and MM-OCE of biological tissues. (a and b) B-mode MM-OCT images of rabbit lung and muscle tissues where the green channel represents the MM-OCT signal and the red channel is the structural OCT signal. (c and d) Representative normalized displacements calculated from M-mode phase MM-OCE data taken with a line rate of 20 kHz from rabbit lung and muscle while the magnetic field is modulated in a step-wise manner (square wave) for four cycles ( off followed by on). (e and f) Normalized displacement data of lung and muscle in the absence of magnetic fields.  Table 1 summarizes the averaged values of the natural frequency of oscillation from the underdamped oscillations, the rise time, the exponential creep term of the displacement following the initial oscillation, and Young’s modulus. The natural frequencies of oscillation are comparable to values measured previously in rat lung and muscle.32 Young’s modulus values are also consistent with the previous measurements, though we note that there is an acknowledged wide range of values in the literature, due to biological variability, physical constraints, chemical environment, and the geometry of the samples.14,32 Table 1Biomechanical parameters of rabbit lung and muscle tissues measured with magnetomotive optical coherence elastography.
In our previous study with silicone tissue phantoms, the displacements we observed contained an underdamped oscillation followed by an equilibrium position.30 Several cycles of the oscillation were present for these highly homogeneous samples. The more heterogeneous rabbit lung and muscle tissues exhibit a similar trend in that an underdamped oscillation is also present in their response. However, the damping in these tissue specimens is much faster than in tissue phantoms as only one (in the case of lung) or less (in the case of muscle) cycle of oscillation is observed. Moreover, the tissues undergo creep, as opposed to rapidly settling at an equilibrium position. Creep occurs when the fluid inside the tissue redistributes in response to the tissue deformation due to a constant force. Creep tests are common in the study of mechanical properties of different materials, including soft biological tissue.33 It is apparent that muscle experiences a steeper creep than lung, while the amplitude of its underdamped oscillation is relatively smaller. Also, when the magnetic field is turned off and the MNPs (and thus the forces on the tissue) are released, the tissue does not revert to its initial position, and some residual strain is present, more so in muscle than in lung. In conclusion, we have demonstrated the application of MM-OCE in biological tissues, and how phase-sensitive measurements of the tissue response from an applied external step-function magnetic field can yield several important biomechanical properties of the tissue under investigation. These differences observed demonstrate that the behaviors of different types of tissues carry a unique set of information that results from a multitude of factors, such as the physio-chemical constituents of the tissue, the micro-level bonds in the extracellular matrix, the types of cells that make up the tissue, etc. Future studies will begin to elucidate the dependency of each of these factors in the extracted MM-OCE biomechanical data. As a novel optical elastography technique, MM-OCE can potentially provide access to this biomechanical information with high spatial and temporal resolution. This method can be extended to map depth-resolved two-dimensional and three-dimensional tissue biomechanical properties and can be a promising technique for advancing the study of biomechanics on the micro-scale. AcknowledgmentsThis work was supported in part by a grant from the National Institutes of Health (R01 EB009073, S.A.B.). We thank Eric Chaney and Dr. Marina Marjanovic from the Beckman Institute for Advanced Science and Technology for their help with harvesting the tissue specimens. We also thank Dr. Steven Adie and Yue Wang for helpful discussions on the theory of elasticity. Additional information can be found at http://biophotonics.illinois.edu. ReferencesK. Nightingale,
“Acoustic radiation force impulse (ARFI) imaging: a review,”
Curr. Med. Imaging Rev., 7
(4), 328
–339
(2011). http://dx.doi.org/10.2174/157340511798038657 CMIRCV 1573-4056 Google Scholar
K. J. ParkerM. M. DoyleyD. J. Rubens,
“Imaging the elastic properties of tissue: the 20 year perspective,”
Phys. Med. Biol., 56
(1), R1
–R29
(2011). http://dx.doi.org/10.1088/0031-9155/56/1/R01 PHMBA7 0031-9155 Google Scholar
A. P. SarvazyanM. W. UrbanJ. F. Greenleaf,
“Acoustic waves in medical imaging and diagnostics,”
Ultrasound Med. Biol., 39
(7), 1133
–1146
(2013). http://dx.doi.org/10.1016/j.ultrasmedbio.2013.02.006 USMBA3 0301-5629 Google Scholar
F. I. MichaelC. B. Jeffrey,
“Tissue motion and elasticity imaging,”
Phys. Med. Biol., 45
(6), v
–vi
(2000). http://dx.doi.org/10.1088/0031-9155/45/6/001 PHMBA7 0031-9155 Google Scholar
D. M. McGrathet al.,
“Quasi-static magnetic resonance elastography at 7 T to measure the effect of pathology before and after fixation on tissue biomechanical properties,”
Magn. Reson. Med., 68
(1), 152
–165
(2012). http://dx.doi.org/10.1002/mrm.23223 MRMEEN 0740-3194 Google Scholar
S. Papazoglouet al.,
“Algebraic Helmholtz inversion in planar magnetic resonance elastography,”
Phys. Med. Biol., 53
(12), 3147
–3158
(2008). http://dx.doi.org/10.1088/0031-9155/53/12/005 PHMBA7 0031-9155 Google Scholar
K. Vijayraghavanet al.,
“Measurement of elastic properties in fluid using high bandwidth atomic force microscope probes,”
Appl. Phys. Lett., 102
(10), 103111
–103114
(2013). http://dx.doi.org/10.1063/1.4795598 APPLAB 0003-6951 Google Scholar
A. Khalilet al.,
“Tissue elasticity estimation with optical coherence elastography: toward mechanical characterization of in vivo soft tissue,”
Ann. Biomed. Eng., 33
(11), 1631
–1639
(2005). http://dx.doi.org/10.1007/s10439-005-6766-3 ABMECF 0090-6964 Google Scholar
B. F. Kennedyet al.,
“Improved measurement of vibration amplitude in dynamic optical coherence elastography,”
Biomed. Opt. Express, 3
(12), 3138
–3152
(2012). http://dx.doi.org/10.1364/BOE.3.003138 BOEICL 2156-7085 Google Scholar
X. LiangS. A. Boppart,
“Biomechanical properties of in vivo human skin from dynamic optical coherence elastography,”
IEEE Trans. Biomed. Eng., 57
(4), 953
–959
(2010). http://dx.doi.org/10.1109/TBME.2009.2033464 IEBEAX 0018-9294 Google Scholar
X. LiangV. CreceaS. A. Boppart,
“Dynamic optical coherence elastography: a review,”
J. Innov. Opt. Health Sci., 3
(4), 221
–233
(2010). http://dx.doi.org/10.1142/S1793545810001180 1793-5458 Google Scholar
A. L. Oldenburget al.,
“Phase-resolved magnetomotive OCT for imaging nanomolar concentrations of magnetic nanoparticles in tissues,”
Opt. Express, 16
(15), 11525
–11539
(2008). http://dx.doi.org/10.1364/OE.16.011525 OPEXFF 1094-4087 Google Scholar
A. L. OldenburgS. A. Boppart,
“Resonant acoustic spectroscopy of soft tissues using embedded magnetomotive nanotransducers and optical coherence tomography,”
Phys. Med. Biol., 55
(4), 1189
–1201
(2010). http://dx.doi.org/10.1088/0031-9155/55/4/019 PHMBA7 0031-9155 Google Scholar
A. L. Oldenburget al.,
“Imaging and elastometry of blood clots using magnetomotive optical coherence tomography and labeled platelets,”
IEEE J. Sel. Top. Quantum Electron., 18
(3), 1100
–1109
(2012). http://dx.doi.org/10.1109/JSTQE.2011.2162580 IJSQEN 1077-260X Google Scholar
C. SunB. StandishV. X. Yang,
“Optical coherence elastography: current status and future applications,”
J. Biomed. Opt., 16
(4), 043001
(2011). http://dx.doi.org/10.1117/1.3560294 JBOPFO 1083-3668 Google Scholar
R. K. WangZ. MaS. J. Kirkpatrick,
“Tissue Doppler optical coherence elastography for real time strain rate and strain mapping of soft tissue,”
Appl. Phys. Lett., 89
(14), 144103
–144103
(2006). http://dx.doi.org/10.1063/1.2357854 APPLAB 0003-6951 Google Scholar
R. Chanet al.,
“OCT-based arterial elastography: robust estimation exploiting tissue biomechanics,”
Opt. Express, 12
(19), 4558
–4572
(2004). http://dx.doi.org/10.1364/OPEX.12.004558 OPEXFF 1094-4087 Google Scholar
S. J. Kirkpatricket al.,
“Imaging the mechanical stiffness of skin lesions by in vivo acousto-optical elastography,”
Opt. Express, 14
(21), 9770
–9779
(2006). http://dx.doi.org/10.1364/OE.14.009770 OPEXFF 1094-4087 Google Scholar
X. LiangB. W. GrafS. A. Boppart,
“Imaging engineered tissues using structural and functional optical coherence tomography,”
J. Biophoton., 2
(11), 643
–655
(2009). http://dx.doi.org/10.1002/jbio.v2:11 JBOIBX 1864-063X Google Scholar
R. K. Manapuramet al.,
“In vivo estimation of elastic wave parameters using phase-stabilized swept source optical coherence elastography,”
J. Biomed. Opt., 17
(10), 100501
–100501
(2012). http://dx.doi.org/10.1117/1.JBO.17.10.100501 JBOPFO 1083-3668 Google Scholar
M. R. Fordet al.,
“Method for optical coherence elastography of the cornea,”
J. Biomed. Opt., 16
(1), 016005
–016005
(2011). http://dx.doi.org/10.1117/1.3526701 JBOPFO 1083-3668 Google Scholar
S. G. Adieet al.,
“Spectroscopic optical coherence elastography,”
Opt. Express, 18
(25), 25519
–25534
(2010). http://dx.doi.org/10.1364/OE.18.025519 OPEXFF 1094-4087 Google Scholar
X. Lianget al.,
“Dynamic spectral-domain optical coherence elastography for tissue characterization,”
Opt. Express, 18
(13), 14183
–14190
(2010). http://dx.doi.org/10.1364/OE.18.014183 OPEXFF 1094-4087 Google Scholar
B. F. Kennedyet al.,
“In vivo dynamic optical coherence elastography using a ring actuator,”
Opt. Express, 17
(24), 21762
–21772
(2009). http://dx.doi.org/10.1364/OE.17.021762 OPEXFF 1094-4087 Google Scholar
M. Razaniet al.,
“Feasibility of optical coherence elastography measurements of shear wave propagation in homogeneous tissue equivalent phantoms,”
Biomed. Opt. Express, 3
(5), 972
–980
(2012). http://dx.doi.org/10.1364/BOE.3.000972 BOEICL 2156-7085 Google Scholar
W. Qiet al.,
“Phase-resolved acoustic radiation force optical coherence elastography,”
J. Biomed. Opt., 17
(11), 110505
–110505
(2012). http://dx.doi.org/10.1117/1.JBO.17.11.110505 JBOPFO 1083-3668 Google Scholar
D. D. DuncanS. J. Kirkpatrick,
“Processing algorithms for tracking speckle shifts in optical elastography of biological tissues,”
J. Biomed. Opt., 6
(4), 418
–426
(2001). http://dx.doi.org/10.1117/1.1412224 JBOPFO 1083-3668 Google Scholar
K. D. MohanA. L. Oldenburg,
“Elastography of soft materials and tissues by holographic imaging of surface acoustic waves,”
Opt. Express, 20
(17), 18887
–18897
(2012). http://dx.doi.org/10.1364/OE.20.018887 OPEXFF 1094-4087 Google Scholar
R. Johnet al.,
“In vivo magnetomotive optical molecular imaging using targeted magnetic nanoprobes,”
Proc. Natl. Acad. Sci. U.S.A., 107
(18), 8085
–8090
(2010). http://dx.doi.org/10.1073/pnas.0913679107 PNASA6 0027-8424 Google Scholar
V. Creceaet al.,
“Magnetomotive nanoparticle transducers for optical rheology of viscoelastic materials,”
Opt. Express, 17
(25), 23114
–23122
(2009). http://dx.doi.org/10.1364/OE.17.023114 OPEXFF 1094-4087 Google Scholar
X. Lianget al.,
“Optical micro-scale mapping of dynamic biomechanical tissue properties,”
Opt. Express, 16
(15), 11052
–11065
(2008). http://dx.doi.org/10.1364/OE.16.011052 OPEXFF 1094-4087 Google Scholar
R. JohnE. J. ChaneyS. A. Boppart,
“Dynamics of magnetic nanoparticle-based contrast agents in tissues tracked using magnetomotive optical coherence tomography,”
IEEE J. Sel. Top. Quantum Electron., 16
(3), 691
–697
(2010). http://dx.doi.org/10.1109/JSTQE.2009.2029547 IJSQEN 1077-260X Google Scholar
M. SridharM. F. Insana,
“Ultrasonic measurements of breast viscoelasticity,”
Med. Phys., 34
(12), 4757
–4767
(2007). http://dx.doi.org/10.1118/1.2805258 MPHYA6 0094-2405 Google Scholar
|


