
|
|
1.IntroductionNeurons have an intrinsic growth capacity during the embryonic stage, which is repressed upon the adult transition to allow proper synaptic development. However, after axotomy, neurons switch again from a transmission state to a growth state, with changes in the expression of genes that encode for transcription factors,1–3 which in turn regulate the expression of genes involved in cell survival and neurite outgrowth (for reviews see Refs. 4 and 5). This switch is essential in the capacity of neurons to regenerate; therefore, the neuronal reaction is stronger after peripheral than central injuries, in which regeneration is poor and limited.6 The increased intrinsic growth capacity of injured peripheral neurons is manifested experimentally by the conditioning lesion paradigm.7 Axotomy of a peripheral neuron previous to the test lesion, primes the neuron, switches it on to a regenerative state, and, thus, it will regenerate faster after receiving the second injury. Since the effect may require time for gene transcription, the conditioning lesion is effective if applied from 2 to 14 days before the test lesion.1,4 In neuronal cell bodies, axotomy-triggered morphological changes have been referred to as chromatolysis.8,9 Acute reactions are quite similar in both regeneration-competent neurons (such as peripheral nervous system neurons) and regeneration-incompetent neurons (such as central nervous system neurons), and these include dispersal of the Nissl substance, displacement of the nucleus to the cell’s periphery, swelling of the cell body, and loss or retraction of synaptic terminals. The extent of these changes depends on the distance of the injury site to the cell body and the number of remaining axonal collaterals. Several studies have shown that sciatic nerve injury induced the loss of some dorsal root ganglia (DRG) neurons (as much as 15 to 30% in lumbar ganglia L4–L6 of the rat), which is the result of being deprived of their target-derived neutrophic growth factor.10 This was observed in our previous work11 in which we have shown that sciatic nerve axotomy induced the disappearance of large-sized somatic diameters (45 to 60 μm). Elasticity is a determining parameter of membrane mechanical properties and provides important information about the health and function of the cell. Interestingly, it has been shown that membrane tension influences growth cone dynamics.4 The use of atomic force microscopy (AFM) to image living biological materials in their native environment with molecular or submolecular resolution is developing with great interest to the biological and medical communities.7 In the area of neuroscience, the application of AFM to neurons has been limited12 and has concentrated on internal organelles13,14 or nanoscale features of the surface, including gap junctions, ionic channels, and focal adhesion points.15 Others have used AFM technology to image neurons in the fixed state.16 However, the overall architecture of living neurons at high resolution has not been thoroughly evaluated with this technology until the first report in this series.17 In this manuscript, we present a differential interference contrast (DIC) microscopy, fluorescence microscopy, and AFM study of the morphology and the membrane mechanical properties of sensory neuron somas from adult mice DRG following left sciatic nerve injury. Our results reveal that conditioned axotomy, induced by prior in vivo sciatic nerve injury, does not increase somatic size but promotes the appearance of longer and larger neurites, which was previously observed.18 AFM on live neurons is also employed to investigate changes in membrane mechanical properties of somas of conditioned neurons. Our work presents a comprehensive mechanical analysis of both control and injured neuron cell bodies and reveals slightly softer conditioned somas than control ones, displaying a lesser range of stiffness variation. This augmentation of body cell elasticity suggests a change in the ratio and the inner structure of the main structural proteins. 2.Material and Methods2.1.Animal Surgery and Cell CultureCare and use of adult female Swiss mice (6 to 8 weeks old CERJ, Le Genest St. Isle, France) conformed to institutional policies and guidelines, and was approved by the local ethics committee. Sciatic nerve section was performed under isoflurane anesthesia.19 To optimize the number of conditioned neurons, mice were kept alive for 4 to 5 days following surgery.17 Neuronal cultures were established from either control or conditioned lumbar L4–L5 DRG, as previously described.11,18 For better neuron adhesion during AFM manipulations, plastic Petri dish covers were coated with collagen and laminin before neuronal culture, as explained elsewhere.11 2.2.Contrast MicroscopyA DIC system mounted on a Nikon TE2000-E inverted microscope equipped with a objective and a thermostatted sample holder was used for neuron imaging under AFM. Phase contrast images of neurons were recorded with an LD A-Plan objective. 2.3.Fluorescence MicroscopyFor immunocytochemistry, neuronal cultures were fixed in paraformaldehyde and processed as previously described.11 The primary antibodies used were mouse anti-III-tubulin (1/500; Sigma) and rabbit anti-actin (1:50; Sigma). Secondary antibody incubations were performed with Alexa Fluor-594 or Alexa Fluor-488 conjugated secondary antibodies (Molecular Probes 1:1000). Images were collected with a PL-Apochromat objective on an upright Zeiss microscope equipped with an AxioCam MRm CCD camera (Zeiss, Le Pecq, France). Axio Vision (Zeiss) was used for image acquisition and analysis. 2.4.Atomic Force MicroscopyThe AFM experimental system used for both cell imaging and force mapping was the Asylum MFP-3D coupled to the Molecular Force Probe 3D controller (Asylum Research, Santa Barbara, California) and mounted on an inverted Olympus microscope. Ultrasoft silicon nitride cantilevers (MLCT-AUHW, Veeco and BL-RC150VB, Olympus) were used. AFM topographic images were obtained in contact mode in a bathing solution11 at an average temperature of 30°C. Neurons were imaged with a pixel resolution of 512 pixels at a line rate of 0.6 Hz. During scanning, both trace and retrace images were recorded and compared for accuracy. Force-volume maps were acquired with a tip loading speed of , meaning a piezo-extension rate of 3 Hz to minimize hydrodynamic and viscoelastic artifacts20,21 and with a maximum loading force of . Young’s modulus () was calculated for each force, according to a modified Hertz model,22 as described elsewhere.11 AFM measurements were never exceeding 2 h. 3.Results and DiscussionBoth DIC and fluorescence images show that control neurons display an arborizing neurite growth characterized by numerous branching [Figs. 1(b) and 1(d)], whereas conditioned axotomized sensory neurons presented an elongated neurite growth characterized by significantly less branching, longer and thicker neurites [Figs. 1(a) and 1(c)]. Fig. 1Differential interference contrast and fluorescence microscopy immunostaining with anti-III-tubulin images of mice dorsal root ganglion sensory neurons: (a) and (c) conditioned neurons and (b) and (d) control neurons at one day in vitro (1DIV) (Scale bars 30 μm).  In order to evidence structural differences between conditioned and control somas, we used immunocytochemistry to localize actin (anti-actin antibody) and neuronal microtubules (anti-III-tubulin). Figure 2 depicts tubulin, actin, and merged images that show preferential tubulin localization to cell periphery for both cell bodies. Furthermore, actin is hardly visible in conditioned neurons [Fig. 2(a)] as compared with a clear spreading of actin in control neurons [Fig. 2(b)]. These results suggest a modification in the ratio and the inner framework of the main structural proteins, namely actin and tubulin. Fig. 2Immunostaining of III-tubulin and actin in somas from control and axotomized sensory neurons. (a) Images of double immunostaining with anti-III-tubulin and anti-actin antibodies in a conditioned sensory neuron at 1DIV. Images show preferential tubulin localization at cell periphery. Note the appearance of a rather large neurite. (b) Images of double immunostaining with anti-III-tubulin (Tub, green) and anti-actin antibodies (Actin, red) in control sensory neuron at 1DIV. Images also show tubulin localization in the cell periphery and a much higher density of actin within the cell body. (Scale bars 10 μm, ×63).  The cell body morphology of live neurons was further studied using AFM. Typical AFM topography and deflection images, taken in contact mode, and the corresponding 3D reconstruction of somas from conditioned and control sensory neurons are shown in Fig. 3. Scan line profiles of the soma cross-sections and several neurite height profiles are gathered in Fig. 4. Conditioned soma maximal height is 3.21 μm, while the maximal height of the control one is 1.71 μm, for these particular cells; nevertheless we did not observe axotomy-induced soma height changes in general. Contrariwise, height and width values of neurites from conditioned neurons (ranging from 200 to 700 nm and 440 nm to 1.50 μm, respectively) are larger than the height and width of neurites from control neurons (ranging from 125 to 170 nm and 700 nm to 1.05 μm, respectively). These results confirm that axotomy does not significantly increase somatic size,11 but yields to the generation of much thicker neurites. Fig. 3Atomic force microscopy (AFM) images in contact mode. [(A) and (B)] Three-dimensional reconstructions of topography images of conditioned and control somas [(C) and (D)], respectively, scale bars 8 μm. Conditioned somas are characterized by significantly less branching and the appearance of large neurites. The scan line profiles of the soma cross-sections (black lines) and six neurite height profiles [(a) to (f)] are gathered in Fig. 4. [(E) and (F)] AFM deflection images of the same conditioned and control somas revealing cell membrane and neurites.  Fig. 4Height profiles [(A) to (F)] of the cross-sections (a) to (f) indicated in Figs. 3(C) and 3(D). Neurites from injury conditioned neurons are significantly thicker than neurites from control ones. Their height and width range from 200 to 700 nm and 440 nm to 1.50 μm, respectively. Height and width of neurites from control neurons range from 125 to 170 nm and 700 nm to 1.05 μm, respectively. [(G) and (H)] Height profiles along the fast scanned lines shown in Figs. 3(C) and 3(D). The measured injury conditioned soma height (up to 3.21 μm) is slightly higher than the control one (1.71 μm).  To follow the effects of conditioning injury on the nanomechanical properties of the live sensory neurons, we recorded AFM force-volume images. Force curves were measured on the soma region to investigate the membrane elasticity of the cell that is related mainly to the intrinsic properties of the cell membrane and underlying cytoskeleton structures: actin filaments and microtubules. For both types of neurons, force-volume images, constructed from force curves collected at each point in a two-dimensional scan, were acquired in relative triggering mode. Typical images are gathered in Fig. 5. Force-volume scanning areas are indicated by boxes on the optical micrographs [Figs. 5(a) and 5(b)]. Figures 5(c) and 5(d) represent the height of the contact point maps recorded during the force-volume measurement of conditioned and control neurons, roughly exposing their morphology and shape. Corresponding adhesion maps are shown in panels (e) and (f). The geometry of the somas observed on the adhesion maps is in agreement with the topography of the cells as seen on the height of the contact point maps. Adhesion maps reveal a reduced tip-cell adhesion in the nucleus area, while the cytoskeleton and the collagen-coated substrate display higher adhesion. A comparison between the AFM Young’s modulus maps of conditioned and control neurons is shown in Figs. 5(g) and 5(h). Map of injury conditioned soma shows a rather homogeneous stiffness distribution in contrast with the control soma map, and, importantly, Young’s modulus maps reveal a softer conditioned soma than the control one. The corresponding Young’s modulus histograms are presented in Fig. 6. Interestingly, conditioned somas and control ones exhibit different trends. Conditioned somas display a narrow, spiked peak with little spread and followed by a tail, whereas control somas display an asymmetric broad peak. Distributions were best fitted with two Gaussians ( and ), suggesting the co-existence of two different elasticity populations that could be correlated to the main structural proteins inner framework. Statistical analysis proved that both components and were significantly smaller for conditioned neurons (average Young’s moduli of 104 and 153 Pa, respectively) compared to control ones (average Young’s moduli of 192 and 237 Pa, respectively), . Fig. 5AFM force-volume maps of cell bodies. [(a) and (b)] Optical micrographs of conditioned and control somas, respectively. Boxes depict cell body regions studied by AFM. [(c) and (d)] Corresponding height of the contact point recorded during the force-volume measurement, for and points, respectively. [(e) and (f)] Corresponding adhesion maps. For both cell types, the tip-cell adhesion displayed by the nucleus area is smaller than the adhesion revealed by the cytoskeleton. [(g) and (h)] Young’s modulus maps of the conditioned and control somas revealing a softer conditioned soma compared to the control one. Associated Young’s modulus histograms of (g) and (h) are presented in Figs. 6(a) and 6(b), respectively. (Scale bars 4 μm). 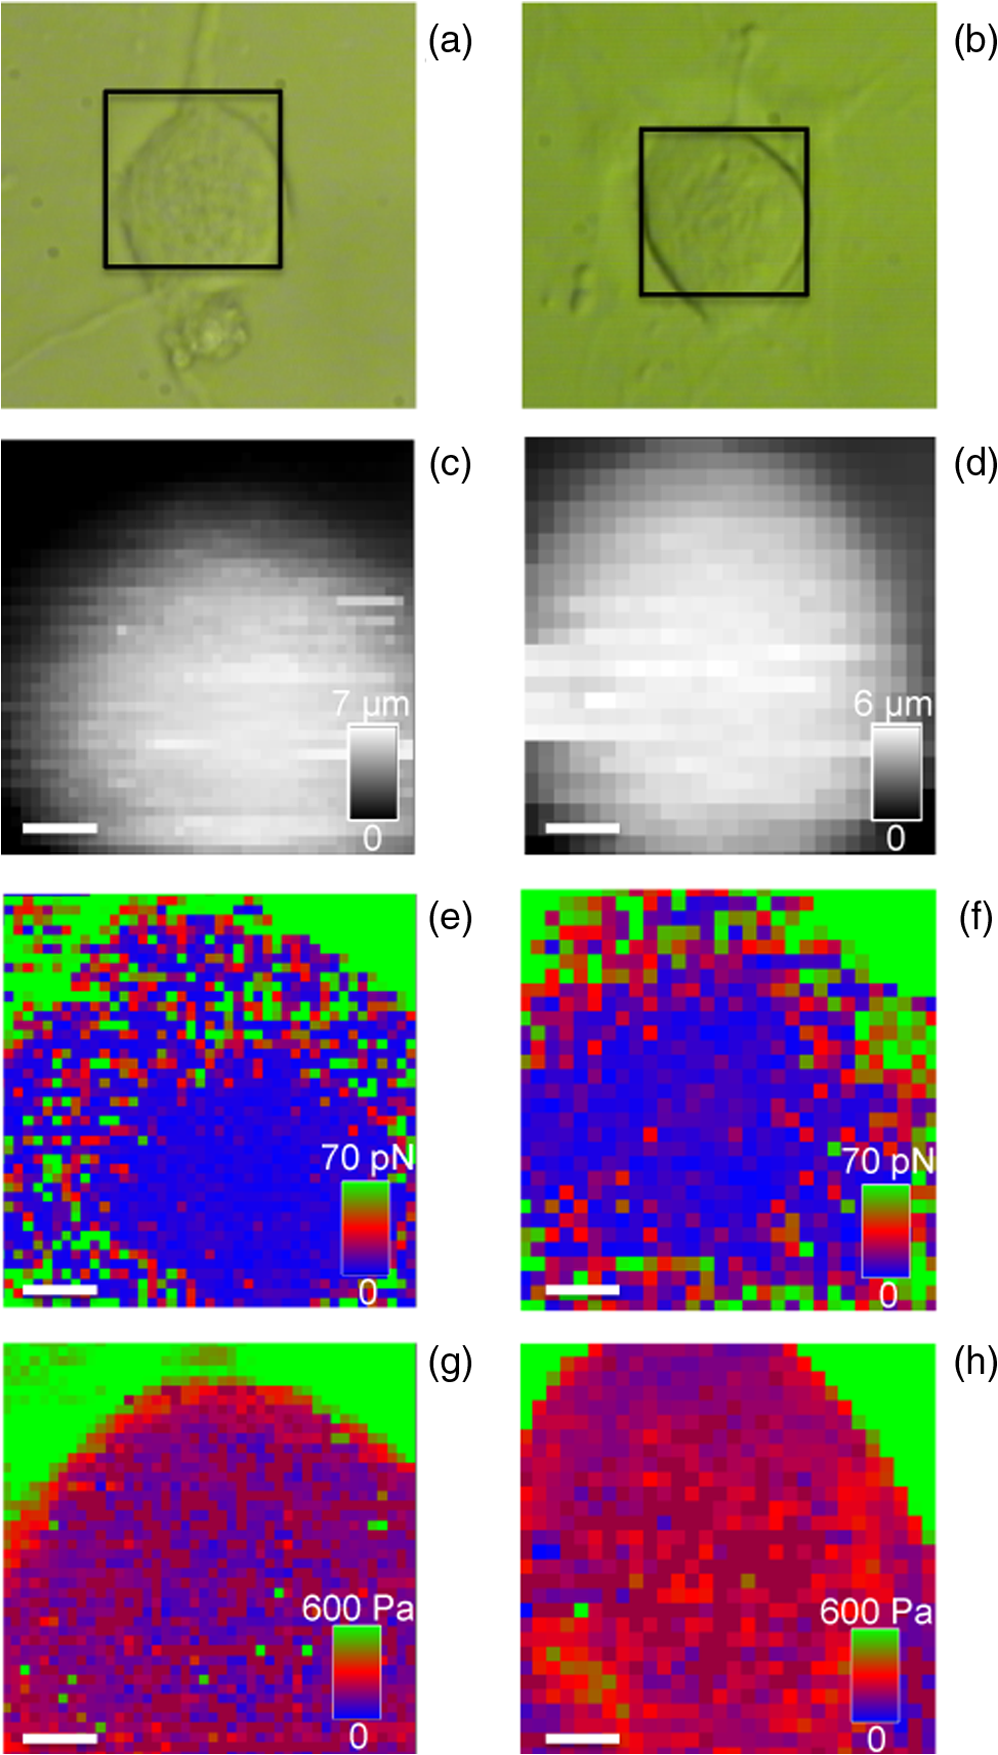 Fig. 6Young’s modulus-E histograms of (a) an injury conditioned soma and (b) control soma. Histograms were best fitted with two Gaussians. Mean values ( and ) are also indicated. and suggest the co-existence of two different elasticity populations that could be related to the inner framework of the main structural proteins. Both Young’s modulus mean values [(c) and (d)] are smaller in conditioned somas compared with the control ones (***).  Young’s modulus value of living cells as a whole varies in a wide range of 30 to 140 kPa. In particular, concerning neuron soma studies, Young’s modulus values of 30 to 500 Pa have been reported for rat cortical neurons.23–25 Meanwhile, Young’s modulus in the range of 200 to 2000 Pa and 650 to 1590 Pa have been revealed for mouse P19-derived neurons25 and guinea pig retinal neurons,26 respectively. Significantly higher values have also been reported for chick DRG neurons in the range of 1 to 8 kPa (Ref. 25) and 10 to 140 kPa (Ref. 27). Young’s modulus variation within this range can be expected due to the heterogeneity of mechanical properties of cells, as when the AFM tip contacts the cell membrane, it is unknown if the underlying structure consists of the cytoskeleton, organelles, vacuoles, etc. Interestingly, our Young’s modulus values for mouse DRG are significantly lower than those presented by Mustata et al.,27 where live DRG neurons measured by individual force curves were reported to yield elastic modulus values averaging . Elastic modulus mapping of living DRGs, however, has yielded averages of , with individual points on DRG somas ranging between 0.1 and 8 kPa.25 It is always delicate to compare Young’s modulus values from different studies as this parameter can be influenced by a number of experimental factors such as sample temperature,24 mice age,28 stiffness of the substrate as well as cell interaction with growth factors (i.e., laminin),25 and finally, timescale, magnitude, and loading rates of the externally applied forces,26 to name just a few. Therefore, one of the aims of our study was the comparison of membrane mechanical properties between somas of conditioned neurons following sciatic nerve injury and control somas under the same experimental conditions. In addition, our results reveal an increase of the soma elasticity (lower Young’s modulus) after axotomy. Previous studies on different cellular structural components have revealed that most of them display a much higher mechanical stiffness than the one presented by the cell as a whole. For instance, single actin filament rigidity is (Ref. 29), while a single microtubule has a Young’s modulus ranging from 10 MPa to 1 GPa.30 This difference in rigidity between actin and tubulin could account for the increase in stiffness of the control somas that display a wide spreading of actin within the whole cell body, according to our immunocytochemistry results [Fig. 2(b)]. Indeed, the conditioning nerve lesion studies of Woolf and colleagues31,32 showed that peripheral axotomy, but not central axotomy, generates an enhanced axonal growth state. Presumably, this is attributable to the induction of neuronal regeneration-associated genes (RAGs) by peripheral axotomy. In general, RAGs are also highly expressed during nervous system development, suggesting that regeneration recapitulates development. The majority of the identified RAGs encode proteins in one of several categories: cytoskeletal proteins such as tubulin and actin, neurotransmitter metabolizing enzymes, neuropeptides, cytokines, neurotrophins, and neurotrophin receptors. In particular, the changes in cytoskeletal protein expression support the notion that developmental processes are being recruited.1 Moreover, the observed increase in elasticity of conditioned neurons may also be related to signals from the injury site that arrive to the soma and switch the neuron to a pro-regenerative state, activating a set of transcription factors. At the lesion site, entrance of extracellular sodium and calcium to the injured axoplasm triggers action potentials that will be the first signals to warn the soma of the axonal injury and will provoke chromatolytic changes in the cell body33 mediated by rapid elevation of intracellular calcium and cyclic adenosine monophosphate. Secretion of active molecules in regenerating sensory neurons is a cellular mechanism that could be related to the increase in intracellular that we previously reported.19 Such increase in the internal concentration not only promotes exit of anions and related membrane depolarization, but also induces cell osmotic tension. On the other hand, the injury also disrupts the retrograde transport flow of signals from normal innervated targets, providing negative signals that inform the soma of the disconnection. Therefore, the reconnection has to be linked to recovery of the lost signals to allow proper synaptic development.1 4.ConclusionTo the best of our knowledge, this study is the first that investigated the effects of conditioning injury on the mechanical properties of sensory neurons membrane. Our DIC microscopy and fluorescence microscopy results show a reduction in the spreading structure in conditioned neurons, together with the increase of neurite thickness. This could be related to an increased volume necessary for fast elongation of neurites. Moreover, we demonstrate by means of AFM that the regenerative mode of growth is characterized by a decrease of cell body elasticity. Correlation with our immunocytochemistry results suggests a clear relation between the structural protein content of the cell body and its rheological behavior. The high actin content observed in control somas imparts mechanical strength to the cells. The observed stiffness of the somas in this case is certainly related to the main role of the actin network in a cell, namely providing a framework to support the plasma membrane and define a cell’s shape. Contrary to the conditioned somas, where actin is much less present in favor of III-tubulin, cell bodies are considerably softer. We might speculate on the role of the microtubules on the rapid neurites outgrowth in conditioned neurons. Microtubules, being highly dynamic structures and exhibiting repeated growth and depolymerization cycles, can rapidly undergo restructuring into various functional network architectures as for example the radial microtubule network that controls directional migration and growth of cells. The observed cellular volume variations might be also due to increased intracellular influence on membrane tension, which in turn regulates neurite growth. This may be a consequence of injury chemical and electrical signals switching the soma to a pro-regenerative state. AcknowledgmentsThis work was supported by the Association Française contre les Myopathies and the Ministère de la Recherche et la Technologie (grant to O.L.). We thank the regional imaging platform RIO for technical assistance. We are grateful for the financial support obtained from the LABEX NUMEV for the PhD of O.B. ReferencesI. AllodiE. UdinaX. Navarro,
“Specificity of peripheral nerve regeneration: interactions at the axon level,”
Prog. Neurobiol., 98
(1), 16
–37
(2012). http://dx.doi.org/10.1016/j.pneurobio.2012.05.005 PGNBA5 0301-0082 Google Scholar
T. Herdegenet al.,
“Expression of c-jun, jun b and jun d proteins in rat nervous system following transection of vagus nerve and cervical sympathetic trunk,”
Neuroscience, 45
(2), 413
–422
(1991). http://dx.doi.org/10.1016/0306-4522(91)90237-I NERSD9 0735-2743 Google Scholar
I. G. McQuarrieB. GrafsteinM. D. Gershon,
“Axonal regeneration in the rat sciatic nerve: effect of a conditioning lesion and of dbcAMP,”
Brain Res., 132
(3), 443
–453
(1977). http://dx.doi.org/10.1016/0006-8993(77)90193-7 BRREAP 1385-299X Google Scholar
D. S. SmithJ. H. Skene,
“A transcription-dependent switch controls competence of adult neurons for distinct modes of axon growth,”
J. Neurosci., 17
(2), 646
–658
(1997). JNRSDS 0270-6474 Google Scholar
G. W. Kreutzberg,
“Acute neural reaction to injury,”
in Life Science Research Report,
57
–69
(1982). Google Scholar
D. M. SuterK. E. Miller,
“The emerging role of forces in axonal elongation,”
Prog. Neurobiol., 94
(2), 91
–101
(2011). http://dx.doi.org/10.1016/j.pneurobio.2011.04.002 PGNBA5 0301-0082 Google Scholar
V. J. MorrisA. R. KirbyA. P. Gunning, Atomic Force Microscopy for Biologist, 352 Imperial College Press, London
(2001). Google Scholar
A. Brodal, Neurological Anatomy in Relation to Clinical Medicine, 1072 Oxford University Press, Oxford, UK
(1981). Google Scholar
A. R. Lieberman,
“The axon reaction: a review of the principal features of perikaryal responses to axon injury,”
Int. Rev. Neurobiol., 14 49
–124
(1971). http://dx.doi.org/10.1016/S0074-7742(08)60183-X IRNEAE 0074-7742 Google Scholar
A. S. Sheryl, Sensory Neurons: Diversity, Development, and Plasticity, 452 Oxford University Press, New York
(1992). Google Scholar
M. Martinet al.,
“Morphology and nanomechanics of sensory neurons growth cones following peripheral nerve injury,”
PloS One, 8
(2), e56286
(2013). http://dx.doi.org/10.1371/journal.pone.0056286 1932-6203 Google Scholar
D. RicciM. GrattarolaM. Tedesco, Growth Cones of Living Neurons Probed by Atomic Force Microscopy, 125
–140 Humana Press, Totowa, New Jersey
(2004). Google Scholar
V. ParpuraP. G. HaydonE. Henderson,
“3-D imaging of living neurons and glia with the atomic force microscope,”
J. Cell. Sci., 104
(2), 427
–432
(1993). JNCSAI 0021-9533 Google Scholar
R. Lalet al.,
“Imaging real-time neurite outgrowth and cytoskeletal reorganization with an atomic force microscope,”
Am. J. Physiol., 269
(1 Pt 1), 275
–285
(1995). AJPHAP 0002-9513 Google Scholar
B. P. Jena,
“Atomic force microscope: providing new insights on the structure and function of living cells,”
Cell Biol. Int., 21
(11), 683
–684
(1997). http://dx.doi.org/10.1006/cbir.1997.0212 CBIIEV 1065-6995 Google Scholar
T. Tojimaet al.,
“3-D characterization of interior structures of exocytotic apertures of nerve cells using atomic force microscopy,”
Neuroscience, 101
(2), 471
–481
(2000). http://dx.doi.org/10.1016/S0306-4522(00)00320-1 NERSD9 0735-2743 Google Scholar
H. McNallyR. Borgens,
“Three-dimensional imaging of living and dying neurons with atomic force microscopy,”
J. Neurocytol., 33
(2), 251
–258
(2004). http://dx.doi.org/10.1023/B:NEUR.0000030700.48612.0b JNCYA2 0300-4864 Google Scholar
S. Andreet al.,
“Axotomy-induced expression of calcium-activated chloride current in subpopulations of mouse dorsal root ganglion neurons,”
J. Neurophysiol., 90
(6), 3764
–3773
(2003). http://dx.doi.org/10.1152/jn.00449.2003 JONEA4 0022-3077 Google Scholar
S. Pierautet al.,
“NKCC1 phosphorylation stimulates neurite growth of injured adult sensory neurons,”
J. Neurosci., 27
(25), 6751
–6759
(2007). http://dx.doi.org/10.1523/JNEUROSCI.1337-07.2007 JNRSDS 0270-6474 Google Scholar
M. J. RosenbluthW. A. LamD. A. Fletcher,
“Force microscopy of nonadherent cells: a comparison of leukimia cell deformability,”
Biophys. J., 90
(8), 2994
–3003
(2006). http://dx.doi.org/10.1529/biophysj.105.067496 BIOJAU 0006-3495 Google Scholar
M. Radmacheret al.,
“Measuring the viscoelastic properties of human platelets with the atomic force microscope,”
Biophys. J., 70
(1), 556
–567
(1996). http://dx.doi.org/10.1016/S0006-3495(96)79602-9 BIOJAU 0006-3495 Google Scholar
M. G. Hertz,
“Uber die Beruhrung Fester Elastischer Korper,”
J. Reine. Angew. Math., 92 156
–171
(1881). Google Scholar
K. B. Bernicket al.,
“Biomechanics of single cortical neurons,”
Acta. Biomater., 7
(3), 1210
–1219
(2011). http://dx.doi.org/10.1016/j.actbio.2010.10.018 ABCICB 1742-7061 Google Scholar
E. Speddenet al.,
“Young’s modulus of cortical and P19 derived neurons measured by atomic force microscopy,”
MRS Proc., 1420
(2012). http://dx.doi.org/10.1557/opl.2012.485 1946-4274 Google Scholar
E. Speddenet al.,
“Elasticity maps of living neurons measured by combined fluorescence and atomic force microscopy,”
Biophys. J., 103
(5), 868
–877
(2012). http://dx.doi.org/10.1016/j.bpj.2012.08.005 BIOJAU 0006-3495 Google Scholar
Y. B. Luet al.,
“Viscoelastic properties of individual glial cells and neurons in the CNS,”
Proc. Natl. Acad. Sci. U. S. A., 103
(47), 17759
–17764
(2006). http://dx.doi.org/10.1073/pnas.0606150103 1091-6490 Google Scholar
M. MustataK. RitchieH. A. McNally,
“Neuronal elasticity as measured by atomic force microscopy,”
J. Neurosci. Method., 186
(1), 35
–41
(2010). http://dx.doi.org/10.1016/j.jneumeth.2009.10.021 JNMEDT 0165-0270 Google Scholar
H. HorielS. IkutaT. Takenakal,
“Membrane elasticity of mouse dorsal root ganglion neurons decreases with aging,”
F. E. B. S. Lett., 269
(1), 23
–25
(1990). http://dx.doi.org/10.1016/0014-5793(90)81109-2 FEBLAL 0014-5793 Google Scholar
F. Gitteset al.,
“Flexural rigidity of microtubules and actin filaments measured from thermal fluctuations in shape,”
J. Cell Biol., 120
(4), 923
–934
(1993). http://dx.doi.org/10.1083/jcb.120.4.923 JCLBA3 0021-9525 Google Scholar
F. Pampaloniet al.,
“Thermal fluctuations of grafted microtubules provide evidence of length-dependent persistence length,”
Proc. Natl. Acad. Sci. U. S. A., 103
(27), 10248
–10253
(2006). http://dx.doi.org/10.1073/pnas.0603931103 1091-6490 Google Scholar
M. S. Chonget al.,
“Axonal regeneration from injured dorsal roots into the spinal cord of adult rats,”
J. Comp. Neurol., 410
(1), 42
–54
(1999). http://dx.doi.org/10.1002/(ISSN)1096-9861 JCNEAM 0021-9967 Google Scholar
S. NeumannC. J. Woolf,
“Regeneration of dorsal column fibers into and beyond the lesion site following adult spinal cord injury,”
Neuron, 23
(1), 83
–91
(1999). http://dx.doi.org/10.1016/S0896-6273(00)80755-2 NERNET 0896-6273 Google Scholar
G. Mandolesiet al.,
“Acute physiological response of mammalian central neurons to axotomy: ionic regulation and electrical activity,”
FASEB J., 18
(15), 1934
–1936
(2004). FAJOEC 0892-6638 Google Scholar
|


