

|
|
1.IntroductionRecent years have seen great progress and accomplishments in photonics and biophotonics bringing the development of novel and compact noninvasive optical diagnostic devices in biomedicine.1–6 Though there are a great variety of devices in this class, the largest group of equipment implements the principle of noninvasive medical spectrophotometry (NMS).7 These optical systems can report the levels of various biochemical components, such as de/oxyhemoglobins, collagen/elastin, porphyrins, lipofuscin, NADH, flavins, etc., in tissues. They can, thus, measure the dynamics of metabolism and examine the major regulatory processes of blood flow without the need to take biopsies (skin, oral mucosa, etc.). A promising direction in the development of NMS devices is the creation of multifunctional noninvasive diagnostic systems, which combine in a single-hardware different methods of NMS: fluorescence spectroscopy (laser fluorescence diagnostics), absorption spectroscopy (UV/VIS or near IR spectral region)—tissue reflectance oximetry (TRO) and/or near infrared spectroscopy (NIRS), laser Doppler flowmetry (LDF), pulse oximetry, etc.8 Such devices allow acquisition of comprehensive real-time biomedical information from the site examined. Until recently, such diagnostic systems were generally empirically designed in the absence of any well-developed and systematized theory. The theoretical modeling framework, metrological certification, and testing of these devices are still in the earliest stages of development. There are virtually no evidence-based approaches and techniques to intelligently formulate specialized medical and technical requirements (MTRs) for diagnostic device parameters. For example, there are few recommendations and rationales in the literature for selecting the accuracy class required for NMS devices.9 Recently, the theoretical issues of formalizing diagnostic tasks for NMS have been examined, with structural and functional model circuits developed and physical–mathematical theory generalized for NMS.2,10,11 These apply to the general phases of the ideological and technical design and realization of such devices. These authors considered some key features of metrology of the NMS for in vivo measurements.9 For instance, they proposed an investigation into the diagnostic volume in NMS, alongside a theoretical and experimental study of the impact of diagnostic volume on the metrological parameters of such devices. In addition, there have been propositions to develop reproducible and standard methods of tuning, calibration, and verification of NMS devices without the use of human subjects by using optical phantoms as test objects. In this article, we report further developments in the scientific approaches to substantiate meeting of MTRs for noninvasive spectrophotometric diagnostic devices. This is primarily based on study of the influence of tissue blood volume on registered signal levels and the sensitivity of such devices. 2.Methods and Functional Scheme of Measurements by the NMSIn NMS, the most sensitive method for recording the dynamic processes in the blood microcirculatory system is LDF. This is based on the assessment of Doppler frequency shifts, which occur after the backscattering of radiation from red blood cells moving at different speeds in small vessels—arterioles, capillaries, and venules.4 This is represented as a microcirculation index in arbitrary perfusion units. Perfusion fluctuations are recorded as a complex nonperiodic process. The variable component provides valuable information on the modulation of blood flow. Spectral signal processing algorithms used for decoding and analysis provide information about the vascular tone in terms of contribution of the different regulatory mechanisms of microhemodynamics (endothelial, neurogenic, myogenic, breath, pulse, etc.).12 Tissue reflectance oximetry is based on the principles of absorption spectroscopy and allows noninvasive (in vivo, transcutaneous) monitoring of microhemodynamics and oxygen transport and utilization within the entire blood microcirculation system.13,14 TRO determines the relative volume of all fractions of hemoglobin (total hemoglobin) in a tissue volume (average level of blood volume—) and oxygen saturation of the microvasculature, generally containing arterioles with oxyhemoglobin and venules with deoxyhemoglobin (average level of tissue oxygen saturation—).2 Following an integrated biotechnical approach, we can formulate the measurement tasks for the methods incorporated into the NMS and consider the general functional scheme of the measurements made in NMS (Fig. 1). In the diagnostic device, light with a wavelength and with a power from the radiation source 1 is delivered by optical lighting system 2 to the examined biological object (BO) 3. Depending on the diagnostic method, the light source may be either a monochromatic (laser) or a set of variable light sources with different emission spectra. Fig. 1The generalized functional scheme of the optical measurements by the NMS: 1—radiation source, 2—optical lighting system, 3—biological object, 4—irradiation transporting system, 5—photodetector, 6—electronics block, 7—computer. —power from the radiation source, —received power (backscattered radiation), ()—photocurrent on photodetector, —measurement depth, —separation distance between the source and detector fibers.  In tissue, radiation is extensively scattered at the boundaries of morphological irregularities and is partially absorbed by substances like water, melanin, hemoglobin, etc., before the re-emergence of the attenuated radiation. Due to multiple scattering events, part of the radiation exiting the BO forms a flux of backscattered light. This irradiation with power is delivered to the device by the irradiation transporting system 4 to the recording unit of the diagnostic device. In a simplified case, it is sent to the photodetector 5 that performs a linear transformation of the optical power to the photocurrent . The produced electrical signal is processed in analogue mode (photocurrent to voltage conversion, amplification, filtering, etc.) in the electronics block 6, digitized and transmitted to the computer 7 for further computation. As a result, biomedical parameters, such as , , and , are calculated. Thus, the NMS implements an indirect measurement method.15,16 Changes in blood microcirculation can be registered by the diagnostic NMS following changes in the optical properties of biotissue. Thus, changes in the optical properties of biological tissues have a major impact on signal levels recorded by the NMS and can be used in developing the MTRs of optical diagnostic devices. 3.Theoretical Estimation of the Levels of the Received SignalsTheoretical estimation of the signal variability measured by NMS devices operating in a backscattering mode using different spectral channels leads to the challenge of quantitative metrology using such measurements. It should be noted that attempts have been made to estimate the measurement depth (parameter in the schematic Fig. 1) and the diagnostic volume for some methods of NMS [for example, LDF (Ref. 17)]. However, they use numerical simulation methods which do not deal with the relationship of estimated signal levels or MTRs for optical diagnostic devices. Depending on the types of tissues studied (with different absorption, scattering, and others properties), the measurement depth can range from 1 to 8 mm.9 A BO considered in the functional schematic (Fig. 1) can be represented as a nonlinear spectral-optical filter, which converts the power of initial to the power of secondary radiation . Such representation is mathematically equivalent to the multiplication of the original optical signal by a dimensionless coding function , which is dependent on the optical and physical, and medical and biological parameters of the object as well as the lighting conditions and delivered irradiation. The well-known expression obtained for the diffusion approximation of a semi-infinite medium can be cited as an example of the function:18 where represents the effective path length of the light; is the detector area; is the separation distance between the source and detector fibers in Fig. 1; and are the reduced scattering coefficient; , the anisotropy factor; , the scattering coefficient; and , the absorption coefficient.For most of the nontransparent biological tissues, the anisotropy factor value is in the range of 0.7 to 0.95, and the for skin (both the dermis and epidermis) can be determined by the following empirical equation:19 For the theoretical estimates of the parameters for the received signals, it is possible to calculate values of the function according to Eq. (1) for commonly used wavelengths at different levels of blood volume: where is the blood volume in tissue, and are scattering and absorption coefficients of blood, and and are scattering and absorption coefficients of the bloodless tissue (bloodless dermis/papillary dermis).Absorption spectroscopy (TRO/NIRS) commonly uses wavelengths in the visible (more often—green, yellow, red) and/or infrared ranges, whereas in LDF, red/infrared ranges are used.1,2,4,7 Considering, e.g., the “multifunctional laser analyzer of capillary blood flow” system2 or other NMS devices using LDF and absorption spectroscopy technology,1,5,20 for calculations in this article we will use the 514- to 940-nm wavelength range (namely for green—514 nm, for yellow—584 nm, for red—633 nm, and for infrared—800 and 940 nm). There are a number of articles in existing literature which offer data regarding the impact of blood volume on tissue optical characteristics.19,21–23 From these publications, it is possible to assess the approximate range of blood volume of different skin surfaces. Thus, Meglinski and Matcher24,25 provide data on the blood volume of skin layers, for example, papillary dermis—4% and upper blood net dermis—30%. Lister et al.23 report the range of 0.2% to 2% for epidermal and dermal blood volume fractions. The reported data on the blood volume in the skin of the forearm is 5.03%,26 and at a tissue depth of 100 to 300 μm, the blood volume is 2 to 5%,19 and from our experience, blood volume of the palmar surface of middle finger is 10 to 20%.27 Taking all of these into account, our study uses 0 to 20% as the range of the tissue blood volume and in some cases up to 50% to assess the changes in functions. Taking the value of the spacing 17,28 (which can be up to 3 mm29), the area of the detector (an optical multimode fiber with about ) and using the appropriate scattering and absorption coefficients30–35 (Table 1), can be plotted against tissue blood volume (Fig. 2). Figure 3 shows with , 5%, 10%, and 15% for the 514 to 940 nm range of wavelengths, respectively. It should be noted that these graphs are constructed using five points, as it is difficult to find the values of the necessary scattering and absorption coefficients for blood and bloodless dermis for the same wavelengths. It is shown in Fig. 4 that is dependent on the value of the source–detector spacing to 2 mm when . Table 1Optical properties for blood and tissue (bloodless dermis).
Fig. 2The dependence of on the level of the tissue blood volume . Here and in the following graphs, calculations for the 514- and 800-nm curves used the optical properties of blood for a wavelength of 517 and 810 nm, respectively (from Table 1).  Fig. 3The dependence of on the range of the wavelengths from 514 to 940 nm for different levels of the tissue blood volume (, 5%, 10%, 15%). 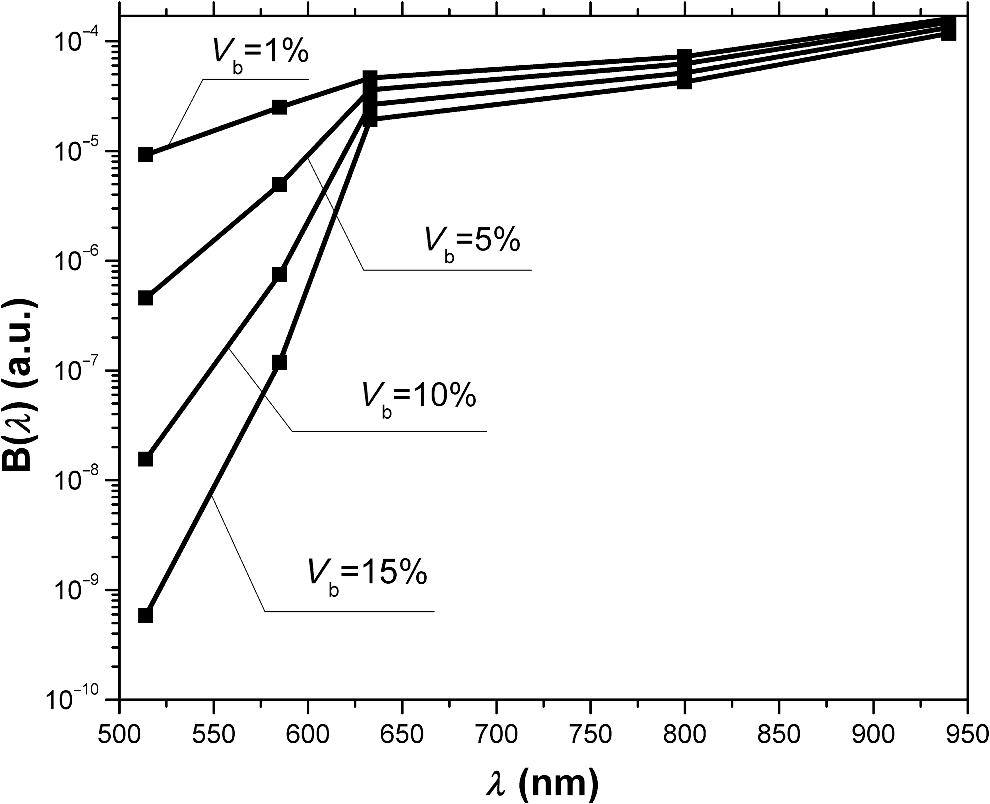 Fig. 4The dependence of on the value of the source–detector spacing to 2 mm for the tissue blood volume .  Thus, as shown in Fig. 2, the signal attenuation is 4 to 5 orders of magnitude. Probe power in such devices generally ranges up to 10 mW,7 with 3 to 4 mW being used in the LAKK-M system. At a probe power of 3 mW and sensor sensitivity of (e.g., silicon photodiode literature values are 36 and 0.3 to 37), the registered photocurrents will be in the order of several microamperes. The dependence of the photocurrent and its derivative with respect to the blood volume of tissue (the differential sensitivity) relative to the level of the blood volume are shown in Figs. 5 and 6, respectively. To account for signal noise, instrument errors, etc., a signal ambiguity threshold was set to respect the MTRs for noninvasive spectrophotometric diagnostic devices. A magnitude of 0.1 nA was selected for this threshold as dark photocurrent is in the range of 1 pA37 to 10 nA.38 The minimum registered change in blood volume must be greater than or equal to the volume corresponding to the selected threshold photodetector current change. Figure 7 shows the change in blood volume corresponding to the change of the photocurrent by 0.1 nA against the tissue blood volume . Fig. 6The dependence of the derivative of photocurrent with respect to blood volume upon the level of the tissue blood volume . 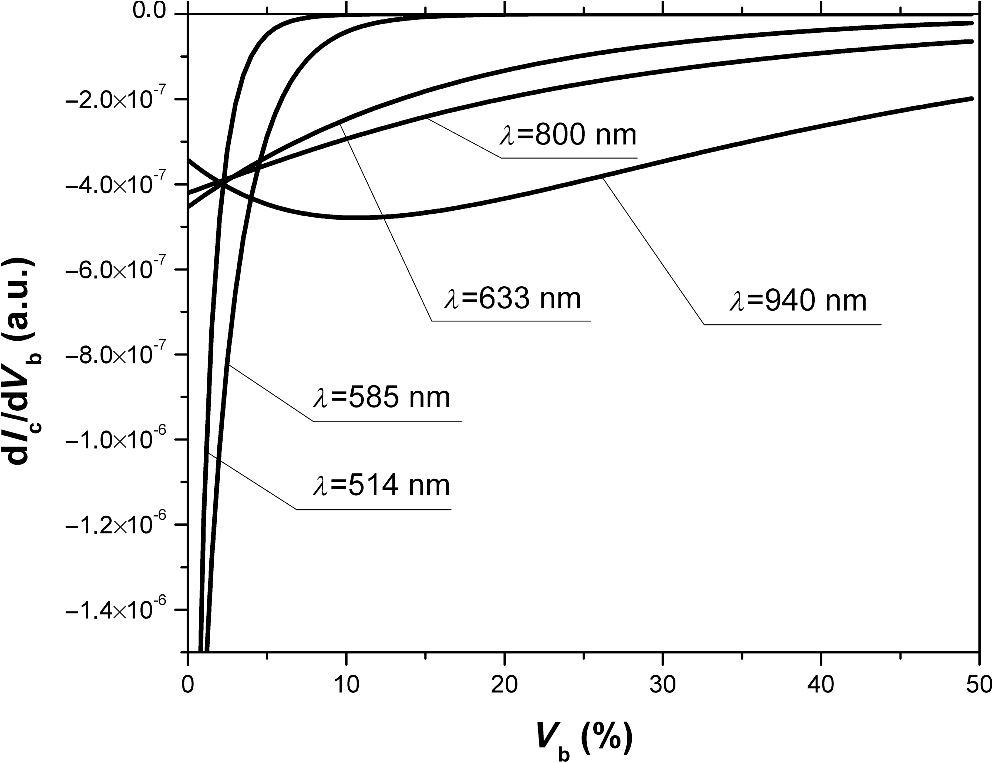 Fig. 7The dependence of the change of the blood/tissue ratio , which corresponds to the change of the photocurrent in 0.1 nA, on the tissue blood volume : for and 585 nm (a) and for , 800, and 940 nm (b). 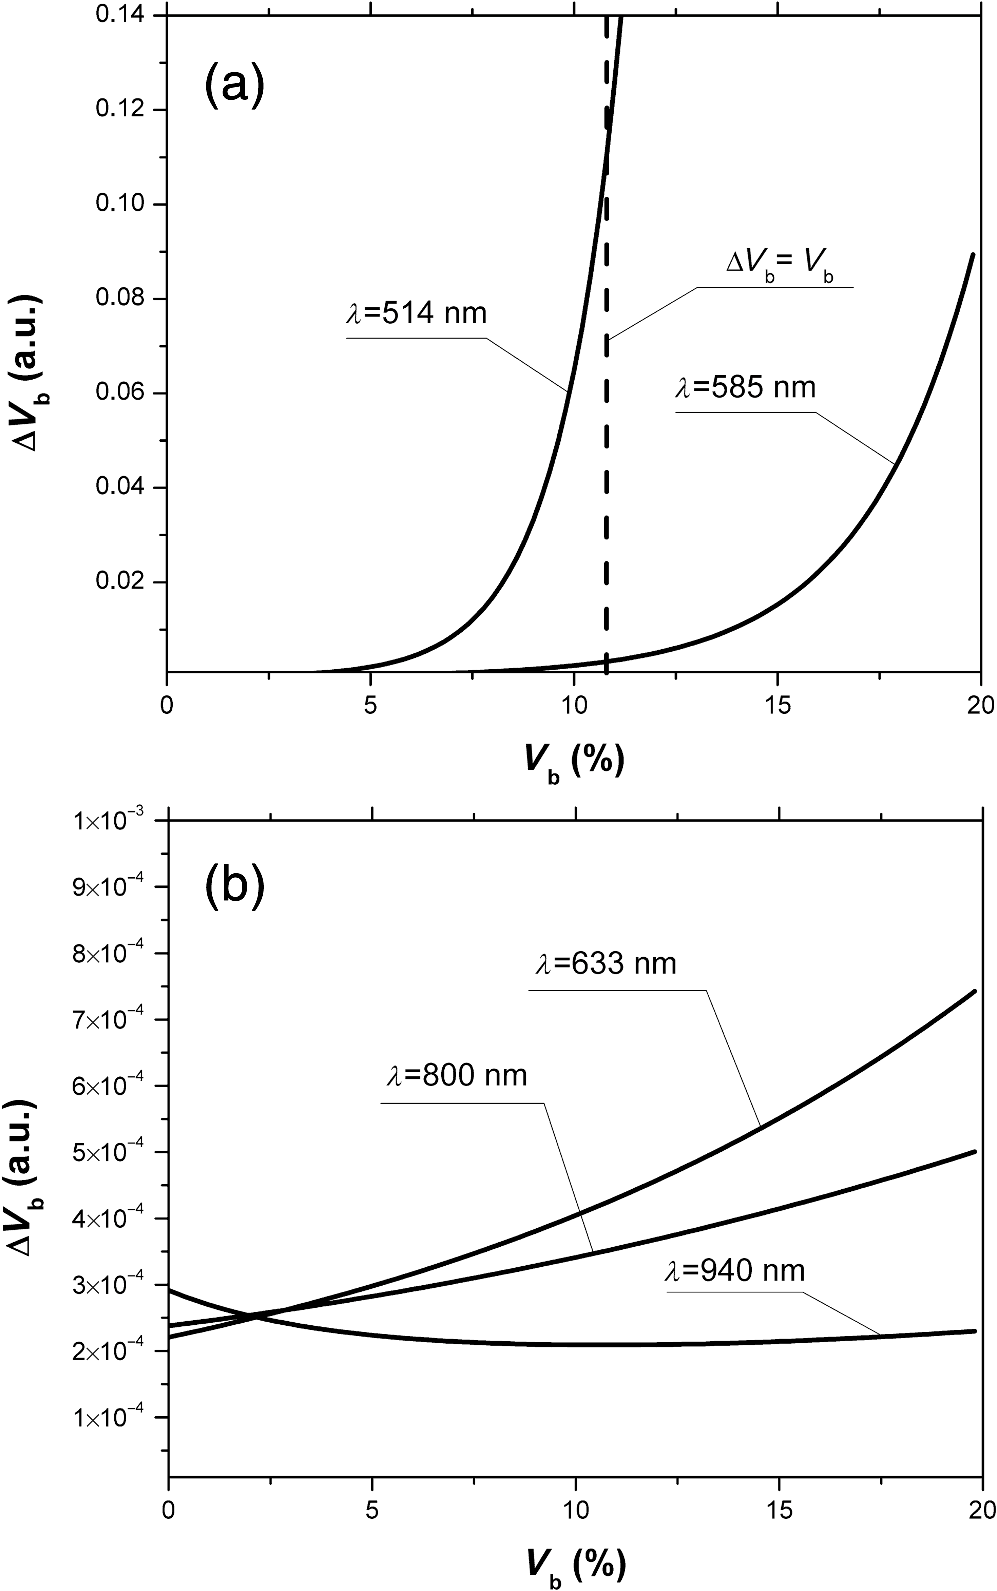 The ratio (Fig. 8) can be interpreted as the signal-to-noise ratio (SNR) during blood volume registration by the NMS devices. Hence, the relation in Fig. 8 is the dependence of SNR upon the level of blood volume at a given wavelength. Figure 8 shows that in the cases of 633 and 800 nm (red and infrared) light, the maximum SNR for NMS devices is in the higher tissue blood volume ranges near 15% to 20%, and for the 940-nm wavelength, the maximum SNR corresponds to 25% to 30% tissue blood volume. 4.DiscussionTheoretical data gained in this work shows that the use of NMS devices for functional diagnostics has specialized MTRs. The development of a common basis for the engineering design of such systems is necessary. With NMS, it is also necessary to create a complete system of metrological support as for instruments and measurement techniques, in general.9 However, there are a number of specific features of the technology that add complexity in solving such problems. One of these features is a nonlinear dependence on the physical properties of the BO (such as light transmission) from its physiological state (e.g., blood volume level) and the wavelength of the probe radiation. A second feature is a wide range of variation of the physiological parameters, e.g., blood volume, which strongly affects the absorption of the radiation in the tissue. All of these problems can be solved by deriving the appropriate relationships which will improve the accuracy of diagnostics of the corresponding methods. As shown in Figs. 2 to 8, the analysis of the dimensionless coding function graphs and the derivative characteristics based on this function (, , , ) highlights three spectral range–dependent groups. These groups are related to the changes in optical absorption and scattering coefficients of blood and tissue (see Table 1). The first group, at 514 and 585 nm, is defined by the blood’s similar and strong absorption curves for green and yellow light. In the second group, the absorption coefficient of blood decreases by an order of magnitude for red and IR wavelengths. In the third group at IR (940 nm), the absorption coefficient of blood remains at a similar level, but the absorption coefficient of tissue decreases by an order of magnitude. For example, Figs. 2 to 5 show that with linear variation of the blood volume, the light transmission through the tissue will vary nonlinearly, but the logarithm of photocurrent can make the characteristics of MTRs linear. Figure 3 demonstrates that increasing the wavelength of tissue irradiation in the range of 314 to 940 nm increases the dimensionless coding function at any fixed tissue blood volume. It is evident that in the spectral range of 633 to 940 nm, has an almost linear inverse relationship to tissue blood volume. However, between 514 and 633 nm, this function exhibits a significant nonlinear decrease with increased tissue blood volume. These dependences are probably due to absorption by blood at 500 to 585 nm being an order of magnitude higher than at 630 to 700 nm.21,23,39 Figures 2 and 3 demonstrate that optical properties of blood (primarily the absorption coefficient) in the observed spectral range, and consequently, the tissue blood volume, have a major impact on . Figure 4 confirms the need to consider the parameter using different wavelengths in the NMS devices depending on the tissue of study (absorption and scattering coefficients and the level of tissue blood volume). It is apparent from the computed data (Fig. 5) that the green (when ) and yellow (when ) irradiation power used in the present case must be increased in order to exceed the signal-to-noise threshold due to the stronger absorption of these wavelengths by biological tissue. The analysis of data from Figs. 6 and 7 shows that at higher blood volume, the discrimination of the changes in the blood volume by NMS devices is reduced and the relationship can be described by a nonlinear function. In turn, the sensitivity of the NMS devices to the blood volume is also a nonlinear function. Thus, in formulation of MTRs for NMS devices, this nonlinearity must be considered. The differential sensitivity () depicted in Fig. 6 clearly demonstrates that the detection of lower blood volumes in tissue (under 10%) should preferably be probed with green (514 nm), yellow (585 nm), red (633 nm), and infrared (800 nm) wavelengths. However, to detect tissue blood volumes of greater than 10% to 20% with a high differential resolution and sensitivity, a wavelength of 940 nm is preferred. Figure 7 shows the minimum discernible signal and the consequent rapid reduction in SNR with an increase in blood volume for green and yellow lights [Fig. 7(a)]. For example, the useful signal becomes indistinguishable against background noise () when at a wavelength of 514 nm. The dependence of upon is much less pronounced for the red and infrared spectra [Fig. 7(b)] compared to the green and yellow lights, although these relationships are also nonlinear. Data from Fig. 8 justifies the use of different wavelengths for measuring different ranges of tissue blood volumes. Green and yellow lights provide a greater sensitivity for a lower blood volume (up to 5%), whereas the infrared irradiation is more efficient in terms of sensitivity and SNR even at higher blood volumes. Delivering the necessary light power for each wavelength for a given blood volume is essential, particularly for measurement of the upper levels of blood volume by TRO. In addition, at levels of tissue blood volume, the blood perfusion and consequently measurements become unreliable due to SNRs of for the green wavelength. In general, the theoretical limit of the measurement scale for TRO is an average tissue blood volume level of 0% to 30% with the selected input data and geometry of the receiving radiation. Similar reasoning can be extended to laser Doppler flowmetry (800 to 940 nm), which is the most sensitive technique for monitoring microvascular rhythms. According to the data presented, this approach is not near to its limit of sensitivity and should have good resolution over a broad range of . According to Fig. 8, for examination of tissue with blood volume level around 10% to 15% with an acceptable SNR, a wavelength of 800 nm should be applied. In the case of 20% to 30% (for example, when measuring the internal organs with an endoscopic probe) of tissue blood volume, however, the 940-nm wavelength is preferable. Moreover, our data (Fig. 6) defines the lowest detection limits of the blood volume for each wavelength. It should be noted that the function , based on a homogeneous model, has a number of limitations. It does not account for a number of optical characteristics and properties of biological tissues, for example, the refractive index as well as layer structures of skin and the so called vessel packaging effect.40 Moreover, it is reported that differing levels of melanin and water alter the optical properties of the tissue relevant to the function.25,41 These factors affect the NMS measurement result and must be taken into account in formulating the MTRs for devices of this type. It must be emphasized that the measurement accuracy (systematic error) of NMS is significantly affected by the algorithms used for calculation of biomedical parameters.9 Thus, the computational algorithms currently used for calculating and by TRO have a complex and multistep character; the scatter of the measured results is two to three times greater than the measurement errors of the initial physical signals.42 It should also be underlined that in addition to the thermal noise in NMS systems, there are other limitations (electrical noise, instability of the radiation source, etc.), which should also be taken into account and normalized in formulating MTRs. 5.ConclusionThe application of new noninvasive medical spectrophotometric techniques and instruments for the functional diagnosis and evaluation of therapeutic interventions requires the specification of the MTRs for the specific type of medical devices. Considering different levels of the tissue blood volume, the approach proposed here allows the calculation of important technical and metrological restrictions of the instruments such as the sensitivity ranges and power-related SNRs for different spectral channels and biomedical parameters. It is clear that the nonlinearity of the measurements carried out with NMS systems depends directly on the characteristics of the examined object. In general, the further successful development of NMS technology will be heavily dependent on the metrological support of these devices and their methods of use. This support will enable noninvasive spectrophotometric diagnostics to be raised from research level technology to a standardized level satisfying the requirements of medical end users. AcknowledgmentsThis work partially was supported by the European Community’s Seventh Framework Programme (FP7-People-2009-IAPP) under Grant Agreement no. 251531 MEDILASE. ReferencesH. LiuM. Kohl-BareisX. Huang,
“Design of a tissue oxygenation monitor and verification on human skin,”
Proc. SPIE, 8087 80871Y
(2011). http://dx.doi.org/10.1117/12.889197 PSISDG 0277-786X Google Scholar
D. A. Rogatkinet al.,
“Basic principles of design and functioning of multifunctional laser diagnostic system for non-invasive medical spectrophotometry,”
Proc. SPIE, 7890 78901H
(2011). http://dx.doi.org/10.1117/12.874258 PSISDG 0277-786X Google Scholar
“Oxford Optronix,”
(2013) http://www.oxford-optronix.com/cat10/page29/Tissue-Vitality-Monitoring.html August ). 2013). Google Scholar
M. J. LeahyG. E. Nilsson,
“Laser Doppler flowmetry for assessment of tissue microcirculation: 30 years to clinical acceptance,”
Proc. SPIE, 7563 75630E
(2010). http://dx.doi.org/10.1117/12.843780 PSISDG 0277-786X Google Scholar
R. KrammeK.-P. HoffmannR. S. Pozos, Springer Handbook of Medical Technology, Springer, Berlin, Heidelberg
(2011). Google Scholar
J. KraitlU. TimmH. Ewald,
“Non-invasive measurement of blood and tissue parameters based on VIS-NIR spectroscopy,”
Proc. SPIE, 8591 859105
(2013). http://dx.doi.org/10.1117/12.2001274 PSISDG 0277-786X Google Scholar
D. A. RogatkinL. G. Lapaeva,
“Prospects for development of non-invasive spectrophotometry medical diagnostics,”
Biomed. Eng., 37
(4), 217
–222
(2003). http://dx.doi.org/10.1023/B:BIEN.0000003304.00591.e7 BIMEB6 0006-3398 Google Scholar
D. A. Rogatkinet al.,
“Multifunctional laser noninvasive spectroscopic system for medical diagnostics and metrological provisions for that,”
Proc. SPIE, 7368 73681Y
(2009). http://dx.doi.org/10.1117/12.831602 PSISDG 0277-786X Google Scholar
D. A. RogatkinA. V. DunaevL. G. Lapaeva,
“Metrological support of methods and devices for noninvasive medical spectrophotometry,”
Biomed. Eng., 44
(2), 66
–70
(2010). http://dx.doi.org/10.1007/s10527-010-9157-x BIMEB6 0006-3398 Google Scholar
A. Cysewska-Sobusiak,
“Metrological problems with noninvasive transillumination of living tissues,”
Proc. SPIE, 4515 15
–24
(2000). http://dx.doi.org/10.1117/12.432969 PSISDG 0277-786X Google Scholar
V. Tchernyiet al.,
“Some results of multiwave in situ autofluorescence diagnostics,”
Proc. SPIE, 5693 336
–343
(2005). http://dx.doi.org/10.1117/12.589777 PSISDG 0277-786X Google Scholar
Laser Doppler Flowmetry of Blood Microcirculation, Meditcina-Press, Moscow
(2005). Google Scholar
D. Colquhounet al.,
“Non-invasive estimation of jugular venous oxygen saturation: a comparison between near infrared spectroscopy and transcutaneous venous oximetry,”
J. Clin. Monit. Comput., 26
(2), 91
–98
(2012). http://dx.doi.org/10.1007/s10877-012-9338-0 1387-1307 Google Scholar
M. V. Amzinaet al.,
“Combined medical diagnostic system with separated laser-Doppler and reflectance oximeter channels,”
Proc. SPIE, 6163 616317
(2006). http://dx.doi.org/10.1117/12.697321 PSISDG 0277-786X Google Scholar
The Biomedical Engineering Handbook, CRC Press, LLC, Boca Raton, Florida
(2000). Google Scholar
H. CzichosT. SaitoL. E. Smith, Springer Handbook of Metrology and Testing, Springer-Verlag, Berlin, Heidelberg
(2011). Google Scholar
I. FredrikssonM. LarssonT. Strömberg,
“Measurement depth and volume in laser Doppler flowmetry,”
Microvasc. Res., 78
(1), 4
–13
(2009). http://dx.doi.org/10.1016/j.mvr.2009.02.008 MIVRA6 0026-2862 Google Scholar
Handbook of Optical Biomedical Diagnostics, SPIE Press, Bellingham, Washington
(2002). Google Scholar
S. L. Jacques,
“Origins of tissue optical properties in the UVA, visible and NIR regions,”
Advances in Optical Imaging and Photon Migration, 364
–370 OSA, Washington, DC
(1996). Google Scholar
U. Timmet al.,
“Photometric sensor system for a non-invasive real-time hemoglobin monitoring,”
Proc. SPIE, 8572 857204
(2013). http://dx.doi.org/10.1117/12.2001421 PSISDG 0277-786X Google Scholar
S. L. Jacques,
“Optical properties of biological tissues: a review,”
Phys. Med. Biol., 58
(11), R37
–R61
(2013). http://dx.doi.org/10.1088/0031-9155/58/11/R37 PHMBA7 0031-9155 Google Scholar
G. ZoniosA. Dimou,
“Modeling diffuse reflectance from semi-infinite turbid media: application to the study of skin optical properties,”
Opt. Express, 14
(19), 8661
–8674
(2006). http://dx.doi.org/10.1364/OE.14.008661 OPEXFF 1094-4087 Google Scholar
T. ListerP. A. WrightP. H. Chappell,
“Optical properties of human skin,”
J. Biomed. Opt., 17
(9), 090901
(2012). http://dx.doi.org/10.1117/1.JBO.17.9.090901 JBOPFO 1083-3668 Google Scholar
I. V. MeglinskiS. J. Matcher,
“Quantitative assessment of skin layers absorption and skin reflectance spectra simulation in the visible and near-infrared spectral regions,”
Physiol. Meas., 23
(4), 741
–753
(2002). http://dx.doi.org/10.1088/0967-3334/23/4/312 PMEAE3 0967-3334 Google Scholar
I. V. MeglinskiS. J. Matcher,
“Computer simulation of the skin reflectance spectra,”
Comput. Methods Programs Biomed., 70
(2), 179
–186
(2003). http://dx.doi.org/10.1016/S0169-2607(02)00099-8 CMPBEK 0169-2607 Google Scholar
S. J. MatcherM. CopeD. T. Delpy,
“In vivo measurements of the wavelength dependence of tissue-scattering coefficients between 760 and 900 nm measured with time-resolved spectroscopy,”
Appl. Opt., 36
(1), 386
–396
(1997). http://dx.doi.org/10.1364/AO.36.000386 APOPAI 0003-6935 Google Scholar
A. V. Dunaevet al.,
“Laser reflectance oximetry and Doppler flowmetry in assessment of complex physiological parameters of cutaneous blood microcirculation,”
Proc. SPIE, 8572 857205
(2013). http://dx.doi.org/10.1117/12.2001797 PSISDG 0277-786X Google Scholar
A. LiebertM. LeahyR. Maniewski,
“Multichannel laser-Doppler probe for blood perfusion measurements with depth discrimination,”
Med. Biol. Eng. Comput., 36
(6), 740
–747
(1998). http://dx.doi.org/10.1007/BF02518878 MBECDY 0140-0118 Google Scholar
S. Takatani,
“Toward absolute reflectance oximetry: I. Theoretical consideration for noninvasive tissue reflectance oximetry,”
Adv. Exp. Med. Biol., 248 91
–102
(1989). http://dx.doi.org/10.1007/978-1-4684-5643-1 AEMBAP 0065-2598 Google Scholar
A. Kienleet al.,
“Investigation of multilayered tissue with in vivo reflectance measurements,”
Proc. SPIE, 2326 212
–221
(1995). http://dx.doi.org/10.1117/12.200824 PSISDG 0277-786X Google Scholar
A. N. Yaroslavskyet al.,
“Optical properties of blood in the near-infrared spectral range,”
Proc. SPIE, 2678 314
–324
(1996). http://dx.doi.org/10.1117/12.239516 PSISDG 0277-786X Google Scholar
T. H. Daiet al.,
“Comparison of human skin opto-thermal response to near-infrared and visible laser irradiations: a theoretical investigation,”
Phys. Med. Biol., 49
(21), 4861
–4877
(2004). http://dx.doi.org/10.1088/0031-9155/49/21/002 PHMBA7 0031-9155 Google Scholar
S. L. Jacques,
“Skin Optics,”
(1998) http://omlc.ogi.edu/news/jan98/skinoptics.html August 2013). Google Scholar
R. Graaffet al.,
“Optical properties of human dermis in vitro and in vivo,”
Appl. Opt., 32
(4), 435
–447
(1993). http://dx.doi.org/10.1364/AO.32.000435 APOPAI 0003-6935 Google Scholar
V. V. Tuchin, Tissue Optics—Light Scattering Methods and Instruments for Medical Diagnosis, Tutorial Texts in Optical Engineering, SPIE, Bellingham, WA
(2000). Google Scholar
J. Haus,
“Photodetectors,”
Optical Sensors, 27
–36 Wiley-VCH Verlag GmbH & Co. KGaA, Weinheim, Germany
(2010). Google Scholar
“HAMAMATSU,”
(2013) http://www.hamamatsu.com/us/en/product/category/3100/4001/4103/ August ). 2013). Google Scholar
M. Cvijetic, Optical Transmission Systems Engineering, Artech House, Norwood, MA
(2004). Google Scholar
A. Rogganet al.,
“Optical properties of circulating human blood in the wavelength range 400–2500 nm,”
J. Biomed. Opt., 4
(1), 36
–46
(1999). http://dx.doi.org/10.1117/1.429919 JBOPFO 1083-3668 Google Scholar
I. FredrikssonM. LarssonT. Strömberg,
“Accuracy of vessel diameter estimated from a vessel packaging compensation in diffuse reflectance spectroscopy,”
Proc. SPIE, 8087 80871M
(2011). http://dx.doi.org/10.1117/12.889684 PSISDG 0277-786X Google Scholar
G. I. Petrovet al.,
“Human tissue color as viewed in high dynamic range optical spectral transmission measurements,”
Biomed. Opt. Express, 3
(9), 2154
–2161
(2012). http://dx.doi.org/10.1364/BOE.3.002154 BOEICL 2156-7085 Google Scholar
D. A. Rogatkinet al.,
“Principal sources of errors in noninvasive medical spectrophotometry. Part 1. Physicotechnical sources and factors of errors,”
Meas. Tech., 56
(2), 201
–210
(2013). http://dx.doi.org/10.1007/s11018-013-0180-7 MSTCAL 0543-1972 Google Scholar
|
||||||||||||||||||||||||||||||||||||||||||||||||||||||||||||||||||||||||


