
|
|
1.IntroductionApproximately one in eight women in the United States will develop breast cancer in their lifetime.1 An estimated 207,000 new cases of breast cancer will be diagnosed in the United States in the next year, and approximately 40,000 U.S. women will die of this disease in the same period.2 Currently, histologic assessment is the gold standard for differentiating neoplastic from non-neoplastic lesions to diagnose breast cancer. However, histologic assessment has limitations including the requirement for extensive tissue processing, and it takes several days to complete preparation before samples can be assessed by pathologists. Furthermore, if cores or tissue excised are inadequate for clinical diagnosis or research applications, an additional tissue excision procedure must be performed. Frozen section pathology can be performed the same day of tissue excision;3,4 however, frozen section has shown to be limited by sampling variability, which can lead to false negatives.5,6 Breast pathology experts in the United States7 and Europe8,9 do not recommend frozen section for breast lesions which cannot be identified by macroscopic examination, which are smaller than 10 mm in size, and for which a preoperative diagnosis is not possible.7,8,10 Fine needle aspiration cytology can also be used for rapid breast lesion assessment,5,8 but does not preserve tissue architecture in the context of the lesion microenvironment. There is a need for a rapid technique that provides high-resolution morphologic detail to differentiate neoplastic from non-neoplastic breast lesions in real time and to inform the management of breast disease. Confocal microscopy is an emerging tool that may address the limitations of current histologic approaches by providing images of tissue architecture and morphology with subcellular resolution in real time without the need for extensive tissue processing.11–15 Confocal fluorescence images can be obtained in either reflectance or fluorescence mode. When used following topical application of acetic acid, confocal reflectance microscopy can be used to acquire high-resolution images of excised breast tissue that reveal cellular and nuclear morphological features characteristic of neoplasia.16 Application of proflavine enhances contrast in confocal images by staining DNA within nuclei. Proflavine was recently used as an optical contrast agent to assess Barrett’s esophagus and axillary lymph nodes,17–19 and results from these studies demonstrate that fluorescence microscopy with proflavine yields images with morphologic detail that is visually comparable with that of histologic sections. The goal of this work was to determine whether confocal fluorescence images of fresh human breast tissue provide sufficient information to enable discernment of neoplastic and non-neoplastic breast features. To achieve this goal, we characterized the microscopic features of normal, benign, and neoplastic breast biopsies visible using confocal microscopy and assessed diagnostic accuracy using these features compared with the gold standard of histology. 2.Materials and MethodsPatients were eligible for the study if they were undergoing surgery for breast cancer or ultrasound-guided core-needle breast biopsy for untreated, newly diagnosed inflammatory breast cancer.20 The study protocol was reviewed and approved by the institutional review boards of The University of Texas MD Anderson Cancer Center and Rice University, and each participant gave written informed consent. Thirty-one patients with known primary breast cancer, who presented for imaging staging or for surgery, agreed to participate in the study between November 2010 and February 2012. A total of 70 tissue specimens were collected: 62 specimens were obtained from 23 patients who underwent a surgical excision procedure, and 8 specimens were obtained from 8 patients who underwent a core-needle biopsy procedure. Of the specimens imaged, 25 consisted of normal or benign tissue, 11 were diagnosed as ductal carcinoma in situ (DCIS), 19 as invasive ductal carcinoma (IDC), 13 as invasive lobular carcinoma (ILC), and 2 as mucinous carcinoma. For surgical specimens, two specimens (approximately in size, with thickness varying between 2 and 7 mm) were taken from excised tissue within 10 min of resection: one specimen was selected from a grossly normal-appearing region and the other from an area that appeared grossly to contain neoplastic tissue. For core-needle biopsy specimens, a single core of breast tissue was obtained within 5 min of the procedure; core biopsy specimens were typically in size. Specimens were kept moist in isotonic phosphate buffered saline (PBS) () prior to imaging. Imaging was performed in vitro within 10 min of tissue removal. The superficial cell layers of fresh tissue specimens were stained before imaging by applying 0.01% proflavine in sterile PBS to the surface for 1 min.21 Proflavine is a fluorescent topical antiseptic, and it preferentially stains nuclei and has been used previously as a contrast agent for fluorescence confocal microscopy.17,18 Proflavine has an excitation maximum of 460 nm and an emission maximum of 530 nm. After staining, tissue specimens were washed for 1 min in isotonic PBS. A white-light photograph was taken with a digital camera to record tissue shape and gross appearance. Confocal fluorescence images of each specimen were obtained using a scanning confocal microscope (Vivascope 2500®; Caliber Imaging and Diagnostics Inc., Rochester, New York). Images were obtained at 488-nm excitation with a bandpass filter using a water immersion objective lens with a numerical aperture of 0.8. At these settings, the lateral resolution was 1.0 μm at the center of the region of interest (ROI), the axial resolution was 5.0 μm at the center of the ROI, and the ROI was . Images were acquired at a frame rate of 9 frames per second. Tissue specimens were positioned on the microscope stage. The imaging depth was set to acquire images from the superficial cell layers of the tissue specimen and up to 60 μm into the tissue surface. Illumination power was initially set to 2.0 mW () and manually adjusted to maximize signal, while avoiding saturation. For the surgical specimens, the stage was scanned to obtain images from adjacent ROIs at the same axial depth in a grid pattern to create a composite image with a maximum area of . For the core-needle biopsy specimens, the composite images comprised the surface of the entire specimen, which is approximately . For each specimen, a series of three composite images was acquired at three different axial depths in increments of 20 μm beneath the surface. Total imaging time for each specimen was approximately 10 min. After imaging, each specimen was placed in a tissue cassette, fixed in 10% buffered formalin, and submitted for routine processing and histologic assessment by a dedicated breast pathologist. Composite confocal images were visually compared with images of hematoxylin and eosin (H&E)-stained tissue sections at magnification to identify ROIs with similar prominent architectural features. Confocal and histologic images of these areas were examined at higher magnification; single ROIs obtained with the confocal microscope were compared to histologic images at magnification (Fig. 1). Matched ROIs containing features that had similar appearances in the histologic slides and the corresponding confocal microscopy images were selected by two observers blinded to the histologic diagnosis (authors Dobbs and Ding); a board-certified, dedicated breast pathologist (author Krishnamurthy) reviewed the H&E-stained image of each of these matched ROIs and provided a diagnosis using standard histologic criteria.22 The confocal images of the matched ROIs were examined and compared with the corresponding histologic image to establish which features of neoplastic and non-neoplastic breast tissues could be imaged using confocal fluorescence microscopy (CFM) with proflavine staining; the procedure for identifying matching ROIs is shown in Fig. 1. The matched ROIs were used to assess the ability of pathologists to identify the presence of neoplasia in a confocal fluorescence image. Fig. 1Schematic of the procedure used to identify matching regions of interest (ROIs) within images acquired by the CFM system (top right, left, and center) and conventional histology (bottom right, left, and center). The two center images are low-resolution images of the entire breast-core biopsy specimen. The high-resolution images at left represent a region of tissue exhibiting histologic transition from normal to neoplastic (IDC). The high-resolution images at right represent a region of tissue with invasive carcinoma. Scale bars are 1.5 mm for the low-resolution images and 100 μm for the high-resolution images.  To investigate the intensity of proflavine staining versus histologic diagnosis, the mean fluorescence intensity was calculated for a representative group of ROIs from each diagnostic category. Confocal fluorescence images were manually segmented to isolate regions with morphology of interest including nonhyperplastic ducts, hyperplastic ducts, DCIS, and IDC. Fluorescence intensity was normalized by the laser power used for image acquisition, and a mean fluorescence intensity value was measured for each region by calculating the average pixel brightness over the area of the region. Statistical analysis of mean fluorescence intensity was performed using Student’s t-test. To compare the performance of CFM and conventional histology, a validation study was performed using corresponding confocal and histologic images to calculate the sensitivity and specificity of these techniques for distinguishing between neoplastic and non-neoplastic breast features. A subset of matched confocal and histologic images was selected for use as a training set; these images were displayed side-by-side to familiarize readers with features of neoplasia visible in confocal fluorescence images. A subset of the remaining matched ROIs was used to create a validation set to compare the ability of readers to identify the presence of neoplasia in either confocal fluorescence images or standard histologic images. Readers first reviewed the training set for approximately 10 min. Readers were then asked to review histologic and confocal fluorescence images in the validation study based on standard histologic criteria and to use criteria presented in the training set to assist with review of confocal fluorescence images. Readers ranked images on a scale of 1 to 5 (1 = normal tissue or nonproliferative adipocytes, collagen, lobules, and ducts; 2 = indecisive between normal and benign changes; 3 = benign changes such as mild hyperplasia, chronic inflammation, fibrocystic changes, and fibrosis; 4 = indecisive between benign changes and neoplasia; 5 = neoplastic tissue including DCIS, IDC, and ILC). Both confocal fluorescence and histology images in the validation study were presented in random order. Accuracy was assessed relative to diagnosis by histology, which was made by a certified, dedicated breast pathologist (author Krishnamurthy). 3.ResultsA total of 235 unique ROIs were identified in the confocal fluorescence images that could be matched to an ROI in the corresponding standard histologic slide; a summary of patients, specimens, and ROIs from which data were acquired is shown in Table 1. Forty-nine ROIs showed histologically normal, non-neoplastic breast tissue. Figure 2 shows representative confocal fluorescence images of normal breast features with images of corresponding features identified in conventional histologic slides: adipocytes, collagen, blood vessels, ducts, and lobular units. Both confocal fluorescence images and conventional histologic images show closely packed adipocytes [Figs. 2(a) and 2(f)]. In confocal images, adipocytes exhibit weak proflavine staining of the pericellular nuclei, moderate staining of the cell membranes, and no staining of the lipid droplets within the cytoplasm [Fig. 2(f)]. Confocal fluorescence images of extracellular matrix are characterized by brightly stained fibroblast nuclei interspersed throughout bundles of collagen fibers, which exhibited weak proflavine staining [Figs. 2(b) and 2(g)]. Blood vessels are easily recognized in confocal fluorescence images; the nuclei of the endothelial cells are stained moderately with proflavine and arranged around a dark lumen [Figs. 2(c) and 2(h)]. Confocal fluorescence images of individual ducts show weakly stained myoepithelial and columnar cell nuclei that surround an unstained lumen [Figs. 2(d) and 2(i)]. Confocal and histologic images show cells arranged in acini to form terminal ductal lobular units (TDLU) [Figs. 2(e) and 2(j)]. Confocal fluorescence images of lobules are characterized by intensely stained epithelial cell nuclei [Fig. 2(j)]. Table 1Summary of patients, specimens, and regions of interest (ROIs).
Fig. 2Normal, non-neoplastic breast architectural features (from left): adipocytes (a, f), collagen (b, g), blood vessel (c, h), ducts (d, i), and lobules (e, j). (a–e) Architectural features in human breast tissue specimens prepared according to standard histologic technique with hematoxylin and eosin (H&E) staining. (f–j) Architectural features from the same fields of view as (a–e) imaged with CFM. Scale bar is 100 μm.  Sixty-one ROIs showed breast features considered to be non-neoplastic benign changes. Figure 3 shows representative confocal images of benign breast features with corresponding standard histologic images: chronic inflammation, fibrosis, mild hyperplasia, and fibrocystic changes. Chronic inflammation is identified in histologic images by the increased number of lymphocytes [Fig. 3(a)]. On the corresponding confocal images, chronic inflammation is characterized by clusters of small, intensely stained inflammatory cell nuclei [Fig. 3(e)]. Fibrosis in confocal and histologic images is associated with an increased number of fibroblasts diffusely distributed throughout the stroma [Figs. 3(b) and 3(f)]. Confocal images of ROIs with fibrosis show fibroblasts with intensely stained nuclei interspersed throughout weakly stained collagen fibers in the stroma [Fig. 3(f)]. Mild ductal hyperplasia without atypia was identified in histologic images by an increase in number of cells lining a ductal space [Figs. 3(c) and 3(g)]. This increase in cell number is also evident in confocal images, where the columnar cell nuclei are weakly stained with proflavine [Fig. 3(g)]. Confocal and histologic images of sclerosing adenosis, a hallmark of fibrocystic changes, show distortion of acini with stromal fibrosis in TDLUs [Figs. 3(d) and 3(h)]. Sclerosing adenosis is identified in confocal images by small, weakly stained cuboidal cell nuclei that formed distorted acinar structures [Fig. 3(h)]. Fig. 3Benign, non-neoplastic breast architectural features (from left): Inflammation (a, e), fibrosis (b, f), mild hyperplasia without atypia (c, g), and fibrocystic changes (d, h). (a–d) Architectural features in human breast tissue specimens prepared according to standard histologic technique with H&E staining. (e–h) Architectural features from the same fields of view as (a–d) imaged with CFM. Scale bar is 100 μm.  One hundred and twenty-five ROIs showed histologically neoplastic breast tissue. Figure 4 shows representative confocal and histologic images including neoplastic features: DCIS, IDC, and ILC. DCIS was identified in histologic and confocal images by disorganized cell proliferation in ducts with no invasion into the surrounding stroma [Figs. 4(a) and 4(d)]. IDC was characterized in histologic images by disorganized invasion of ductal carcinoma cells into stroma [Fig. 4(b)]. In confocal fluorescence images, invading ductal carcinoma cells show large, pleomorphic, weakly stained nuclei [Fig. 4(e)]. ILC was characterized in histologic images by lobular carcinoma cells invading single-file into stroma [Fig. 4(c)]. These cells are easily identified in confocal fluorescence images, which show single-file invading cells with enlarged, intensely stained nuclei [Fig. 4(f)]. Fig. 4Neoplastic breast architectural features (from left): ductal carcinoma in situ (a, d), IDC (b, e), and ILC (c, f). (a–c) Architectural features in human breast tissue specimens prepared according to standard histologic technique with H&E staining. (d–f) Architectural features from the same fields of view as (a–c) imaged with CFM. Scale bar is 100 μm.  The representative images of normal, benign, and neoplastic features (Figs. 2–4) demonstrate that confocal fluorescence images capture a wide range of histologic features of the breast, which can be observed using standard histology. Confocal images were grouped into three categories based on histologic diagnosis: normal, benign, and neoplastic. Images in each category were reviewed to characterize the following features: (1) cell architecture and orientation, (2) nuclear spacing, (3) nuclear size, and (4) intensity of proflavine fluorescence. The confocal image features of each category were compiled into a lexicon by tissue diagnosis (Figs. 5 and 6). Fig. 5Normal and benign breast architectural features imaged by CFM. Normal breast architectural features (left column): adipocytes, collagen, blood vessels, ducts, and lobules. Architectural features of benign changes in the breast tissue (right column): inflammation, stromal fibrosis, stromal-multinucleated giant cells, mild hyperplasia with no atypia, and fibrocystic changes. Each feature is described by four criteria which can be used to aid in interpretation of images acquired with confocal fluorescence microscopy: cell architecture, inter-nuclear distance, nuclear size, and nuclear staining characteristics. Scale bars are 100 μm.  Fig. 6Neoplastic breast architectural features imaged by CFM. Neoplastic breast architectural features: DCIS, IDC, and ILC. Each feature is described by four criteria which can be used to aid in interpretation of images acquired with confocal fluorescence microscopy: cell architecture, inter-nuclear distance, nuclear size, and nuclear staining characteristics. Scale bars are 100 μm.  Mean fluorescence intensity was measured at ROIs in confocal fluorescence images illustrating non-neoplasia: normal, nonhyperplastic ducts (), and ductal hyperplasia (), and neoplasia: DCIS () and IDC (). To ensure that mean fluorescence intensity was assessed in a representative set of samples, we measured mean fluorescence intensity in ROIs that were included in the training and validation sets and in additional ROIs identified in confocal fluorescence images of specimens summarized in Table 1. The histologic diagnosis for all additional ROIs identified in confocal fluorescence images and assessed for mean fluorescence intensity was verified by a dedicated breast pathologist. Figure 7 shows the mean fluorescence intensity by diagnostic category. The mean fluorescence intensity reported in Fig. 7 supports the descriptors provided in Figs. 5 and 6. The mean fluorescence intensity of DCIS (), described as having intensely stained nuclei, is higher than IDC, normal ducts, and hyperplastic ducts, all described with weakly stained nuclei. Differences in the mean fluorescence intensity of DCIS are statistically significant when compared with that of IDC () and non-neoplastic ducts (). Mean fluorescence intensity values observed in normal ducts (), ductal hyperplasia (), and IDC () were not significantly different (). Fig. 7Mean fluorescence intensity measured in confocal fluorescence images at ROIs with non-neoplasia: normal, nonhyperplastic ducts (), and ductal hyperplasia (), and neoplasia: DCIS () and IDC ().  Matched confocal and histology images were assembled into a training and validation set to compare the diagnostic performance of CFM and standard histology in distinguishing between neoplastic and non-neoplastic features. Matched pairs of confocal and histology images acquired from 23 sites were used to train readers to review confocal images based on characteristics including morphology, staining, and nuclear size (Figs. 5 and 6). From the remaining images, 98 images of 49 matched ROIs were separated into groups of confocal and histologic images, which were randomly ordered in the validation set. A total of seven readers, five pathologists, and two cytopathology fellows (Department of Pathology, MDACC) underwent training and reviewed validation images. Table 2 illustrates the results of visual assessment of images acquired by histology with H&E staining [Table 2(a)] and CFM [Table 2(b)]. Results are organized based on the rankings assigned to the images in the validation set by each reader and by the true histologic diagnosis for each image as determined by a board-certified breast pathologist. Sensitivity and specificity of evaluation of confocal fluorescence images and conventional histologic images were calculated based on each reader’s review of the validation images; neoplasia was classified by a ranking of 4 or 5, and non-neoplasia was classified by a ranking of 1 to 3. Table 2Results of visual assessment of images in the validation study. The total number of rankings, 343, is based on the rankings assigned by seven pathologists to each of the 49 images in the validation set. Each validation set included 18 images with histologically normal breast morphology, 10 images that showed morphology with benign changes, and 21 images with neoplastic breast morphology; when the images were ranked by all seven readers, this resulted in 126 rankings for normal ROIs, 70 rankings for ROIs with benign changes, and 147 rankings for ROIs with neoplasia. False positives were classified as images whose true histologic diagnosis was normal or benign changes, but which were assigned a ranking of 4 or 5. Similarly, false negatives were designated as images with a diagnosis of neoplasia, which were assigned a ranking of 1 to 3.
Table 3 gives a summary of each reader’s performance in reviewing images in the validation set. In Fig. 8, a receiver operator characteristic (ROC) curve shows the averaged performance of all readers in distinguishing neoplastic from non-neoplastic breast cellular features. At the -point for the histology ROC curve (square markers, solid line), sensitivity is 93% and specificity is 97% with an area under the ROC curve of 0.987, and at the -point for the confocal fluorescence microscopy ROC curve, sensitivity is 93% and specificity is 93% with an area under the ROC curve of 0.957. When accuracy is assessed based on experience level, the readers with more experience in image review (pathologists A-E) have higher accuracy in identifying neoplasia than those with less experience (pathology fellows A and B). Pathologists and pathology fellows assigned twice the number of false positive rankings in confocal fluorescence images than in H&E images. Readers assigned false negative rankings to the same number of sites in confocal fluorescence and H&E images. In both types of images, DCIS, IDC, and ILC sites were assigned false negative rankings. There were twice as many sites identified as false positives in confocal fluorescence images than in H&E images. More than half of the false positive rankings assigned to confocal fluorescence images were given to sites with normal lobules; however, the highest number of false positive rankings was assigned to a single confocal fluorescence image of inflammation (classified incorrectly by 4/7 readers). Table 3Summary of reader accuracy in distinguishing neoplastic from non-neoplastic breast cellular features in conventional histologic and confocal fluorescence images. When the results are separated based on reader experience in image review, the averaged sensitivity and specificity values are higher for readers with more experience (pathologists A–E) than for readers with less experience (pathology fellows A and B). FP = false positive rankings assigned; FN = false negative rankings assigned.
Fig. 8Receiver operator characteristic (ROC) curve for the averaged performance of all readers in distinguishing neoplastic from non-neoplastic breast architectural features in conventional histologic (square markers, solid line) and confocal fluorescence images (triangular markers, dashed line). At the -point of the ROC curve for histology performance, the sensitivity is 93% and the specificity is 97% with an area under the ROC curve of 0.987. At the -point of the ROC curve for CFM performance, the sensitivity is 93% and the specificity is 93% with an area under the ROC curve of 0.957. 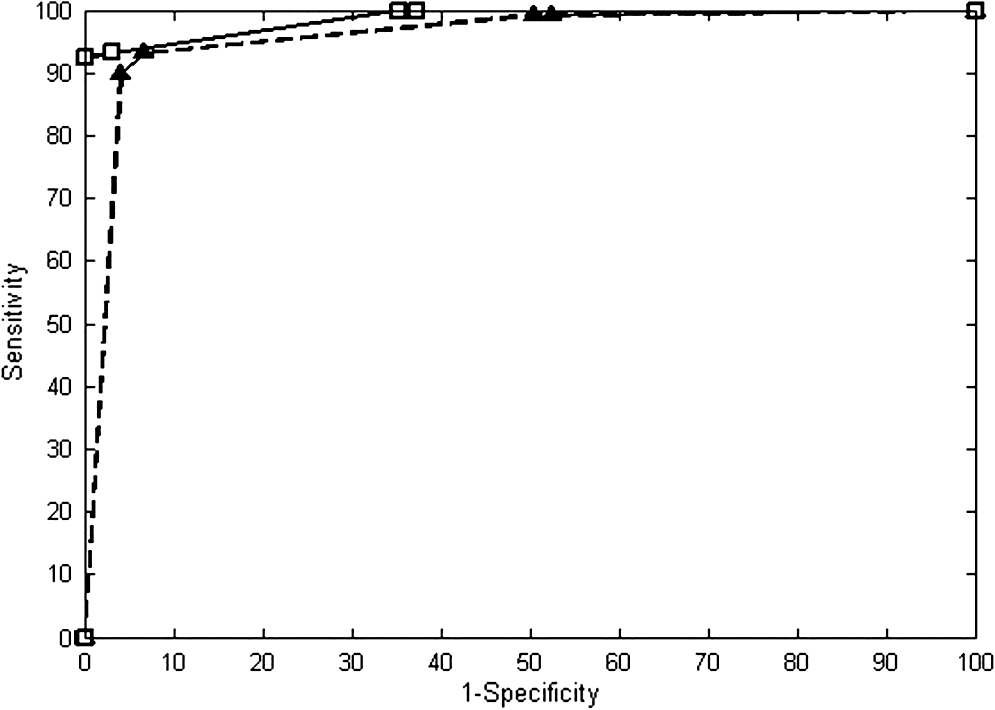 We calculated a Kappa score to evaluate inter-rater agreement for visual assessment of H&E and confocal fluorescence images. Since there were seven raters who assigned rankings to images, we used a formula developed to calculate a Kappa score for multiple ratings per subject.23 The Kappa score for raters’ agreement when ranking H&E images is 0.63, and the test statistic is 30.0 (). When ranking CFM images, inter-rater agreement is characterized by a Kappa score of 0.51 and a test statistic of 24.6 (). Landis and Koch described the ranges of kappa statistic values in intervals of 0.2 from 0 to 1 (where kappa values of 1 and 0 indicate perfect agreement and agreement that could occur by chance, respectively), which are commonly used for kappa statistic interpretation.24–27 The ranges of kappa statistic values 0.41 to 0.60 and 0.61 to 0.80 indicate moderate and substantial agreement strengths, respectively. 4.DiscussionThe objective of this work was to determine if assessment of breast architecture in CFM images has similar performance as the assessment of histologic slides with H&E staining without the need for extensive tissue processing. The findings of this study show that confocal fluorescence images of fresh human breast tissue stained topically using proflavine provide sufficient information to enable discernment of neoplastic and non-neoplastic breast features. Histology slides are produced through an intricate, time-intensive process. Tissue specimens are fixed through immersion in a chemical fixative to prevent cell autolysis and degradation; adequate tissue fixation takes approximately 24 to 48 h. After fixation, tissue specimens are dehydrated through immersion in alcohol to remove excess water and formalin, alcohol is removed from tissue, and specimens are infiltrated with an embedding agent such as paraffin wax. After the wax solidifies, a microtome is used to cut the tissue specimen into 5-μm thick sections. Excess wax is melted off over a few hours, and then a histochemical stain such as H&E is applied. Complete preparation of histologic slides is costly and delays assessment and diagnosis by 1 to 2 days. CFM offers a number of important potential advantages as an imaging tool. Sample preparation for CFM is fast and simple. Fresh, unprocessed tissue specimens are stained for 1 min, and then washed to remove excess dye. The specimen is then imaged with no further processing and without the need for fixation, embedding, or sectioning. The camera in the microscope is integrated into the system hardware, allowing for image acquisition at near video rate; a specimen can be imaged using CFM in 10 min, and imaging a core-needle biopsy requires less than 2 min. Portable confocal microscopes with real-time imaging capability are now commercially available. A number of other optical imaging modalities have been explored for real-time imaging of breast tissue. Optical coherence tomography (OCT) has been evaluated in several studies for real-time, intraoperative assessment of lymph nodes and breast tumor margins,28–30 but the resolution of OCT has been too low to provide sufficient detail for rapid tissue assessment. While higher-resolution OCT systems are in development, the greater axial resolution of CFM enables resolution of cellular and nuclear features comparable with that of high-magnification () light microscopic images of thin sections. Confocal reflectance microscopy offers resolution similar to that of CFM. Tilli and colleagues showed that acetic acid enhances image detail in confocal reflectance images of mouse mammary and resected human breast tissue, which enabled measurements of nuclear size. Their work demonstrated that near-infrared reflectance confocal microscopy images of mouse mammary and human breast tissue morphology correlate to histologic images with H&E staining.15 The work described here was performed as a small study to determine the features of neoplastic and non-neoplastic breast tissues that could be assessed at sample acquisition in a routine clinical setting using CFM. All specimens were acquired at a single center, and only a small number of observers participated in image assessment. Further studies are necessary to determine whether confocal fluorescence images contain sufficient detail to enable diagnosis. If confocal fluorescence images prove adequate for evaluation of breast tissue specimens, this technique could be useful in a number of clinical scenarios. A potentially significant clinical application of this platform is (1) immediate evaluation of the adequacy of tissue core biopsy specimens procured with or without imaging guidance. The first and current technique of touch preparation of core biopsies does not ensure adequate representation of the targeted lesion for subsequent morphological, phenotypic, and molecular characterizations.31 (2) A potential application for this technique is rapid assessment of tumor margin status, which could be performed without the necessity for extensive tissue preparation while yielding results comparable with those of frozen section histology. (3) Confocal microscopy could be useful to ensure procurement of adequate viable tumor tissue for molecular testing. The ability to image tissue morphology with minimal specimen preparation could be valuable in the era of sophisticated and detailed molecular analysis, including genomic sequencing, for purposes of developing targeted and personalized therapy. Other possible applications for confocal microscopy include assessment of adequate tissue specimens in bio-banking, assistance in identifying desired cell types for use in cell culture, and facilitation in identifying suitable tissue for genomic or proteomic studies. (4) This technique may be useful to provide histologic diagnosis in low-resource settings, where infrastructure for traditional histologic preparation is not available.32 In conclusion, we presented the results of an observational study comparing images acquired with minimal tissue processing using CFM to identify characteristics of a wide range of neoplastic and non-neoplastic breast lesions. CFM can be performed inexpensively and at near video rate with optimal preservation of the entire tissue for any kind of subsequent analysis. High-resolution images acquired using CFM have micron resolution allowing evaluation of nuclear features and cell morphology, which correlate to those observed in histologic images with H&E staining. In the validation study, image review based on visual assessment shows that CFM and standard histology had similar sensitivity and specificity values for distinguishing between neoplasia and non-neoplasia. The potential utility of this platform for different types of clinical and research applications needs to be tested in larger studies. AcknowledgmentsThe authors would like to thank Constance Albarracin, M.D., Lei Huo, M.D., Savitri Krishnamurthy, M.D., Xioxian Li, M.D., Andrew Sholl, M.D., Michelle Williams, M.D., and Yun Wu, M.D. for their assistance with image review. This work was supported by Department of Defense Synergistic Award W81XWH-08-1-0712, Department of Defense Era of Hope Award W81XWH-09-1-0410, and Susan G. Komen Breast Cancer Foundation KG091020. This work was also supported in part by The State of Texas Grant for Rare and Aggressive Cancers through the Morgan Welch Inflammatory Breast Cancer Research Program. ReferencesE. J. Feueret al.,
“The lifetime risk of developing breast cancer,”
J. Natl. Cancer Inst., 85
(11), 892
–897
(1993). http://dx.doi.org/10.1093/jnci/85.11.892 JNCIEQ 0027-8874 Google Scholar
A. Jemal,
“Cancer statistics, 2010,”
CA Cancer J. Clin., 61
(2), 277
–300
(2011). http://dx.doi.org/10.3322/caac.v61:2 CAMCAM 0007-9235 Google Scholar
P. P. Rosen,
“Frozen section diagnosis of breast lesions. Recent experience with 556 consecutive biopsies,”
Ann. Surg., 187
(1), 17
–19
(1978). http://dx.doi.org/10.1097/00000658-197801000-00004 ANSUA5 0003-4932 Google Scholar
C. WintherN. Graem,
“Accuracy of frozen section diagnosis: a retrospective analysis of 4785 cases,”
APMIS, 119
(4–5), 259
–262
(2011). http://dx.doi.org/10.1111/apm.2011.119.issue-4-5 APMSEL 0903-4641 Google Scholar
D. E. Bauermeister,
“The role and limitations of frozen section and needle aspiration biopsy in breast cancer diagnosis,”
Cancer, 46
(S4), 947
–949
(1980). http://dx.doi.org/10.1002/(ISSN)1097-0142 60IXAH 0008-543X Google Scholar
L. Chenget al.,
“The results of intraoperative consultations in 181 ductal carcinomas in situ of the breast,”
Cancer, 80
(1), 75
–79
(1997). http://dx.doi.org/10.1002/(ISSN)1097-0142 60IXAH 0008-543X Google Scholar
J. L. Connollyet al.,
“Immediate management of mammographically detected breast lesions,”
Am. J. Surg. Pathol., 17
(8), 850
–851
(1993). http://dx.doi.org/10.1097/00000478-199308000-00011 AJSPDX 0147-5185 Google Scholar
J. Sloane,
“Quality assurance guidelines for pathology in mammography screening,”
European guidelines for quality assurance in mammography screening, Office for Official Publications of the European Communities, Luxembourg
(1996). Google Scholar
B. Zafraniet al.,
“Guidelines for the pathological management of mammographically detected breast lesions,”
Breast, 4
(1), 52
–56
(1995). http://dx.doi.org/10.1016/0960-9776(95)90030-6 1475-3480 Google Scholar
R. Scheidenet al.,
“Accuracy of frozen section diagnoses of breast lesions after introduction of a national programme in mammographic screening,”
Histopathology, 39
(1), 74
–84
(2001). http://dx.doi.org/10.1046/j.1365-2559.2001.01162.x HISTDD 1365-2559 Google Scholar
V. Campo-Ruizet al.,
“Evaluation of hepatic histology by near-infrared confocal microscopy: a pilot study,”
Human Pathol., 33
(10), 975
–982
(2002). http://dx.doi.org/10.1053/hupa.2002.127445 HPCQA4 0046-8177 Google Scholar
D. S. Gareauet al.,
“Rapid screening of cancer margins in tissue with multimodal confocal microscopy,”
J. Surg. Res., 178
(2), 533
–538
(2012). JSGRA2 0022-4804 Google Scholar
A. Parrishet al.,
“Reflectance confocal microscopy for characterization of mammary ductal structures and development of neoplasia in genetically engineered mouse models of breast cancer,”
J. Biomed. Opt., 10
(5), 051602
(2005). http://dx.doi.org/10.1117/1.2065827 JBOPFO 1083-3668 Google Scholar
L. M. Schiffhaueret al.,
“Confocal microscopy of unfixed breast needle core biopsies: a comparison to fixed and stained sections,”
BMC Cancer, 9 265
(2009). http://dx.doi.org/10.1186/1471-2407-9-265 BCMACL 1471-2407 Google Scholar
M. T. Tilliet al.,
“Real-time imaging and characterization of human breast tissue by reflectance confocal microscopy,”
J. Biomed. Opt., 12
(5), 051901
(2007). http://dx.doi.org/10.1117/1.2799187 JBOPFO 1083-3668 Google Scholar
R. H. Webb,
“Confocal optical microscopy,”
Rep. Prog. Phys., 59
(3), 427
–471
(1996). http://dx.doi.org/10.1088/0034-4885/59/3/003 RPPHAG 0034-4885 Google Scholar
T. J. Muldoonet al.,
“High-resolution imaging in Barrett’s esophagus: a novel, low-cost endoscopic microscope,”
Gastrointest. Endosc., 68
(4), 737
–744
(2008). http://dx.doi.org/10.1016/j.gie.2008.05.018 GAENBQ 0016-5107 Google Scholar
M. C. PierceD. J. JavierR. Richards-Kortum,
“Optical contrast agents and imaging systems for detection and diagnosis of cancer,”
Int. J. Cancer, 123
(9), 1979
–1990
(2008). http://dx.doi.org/10.1002/ijc.v123:9 IJCNAW 1097-0215 Google Scholar
K. J. Rosbachet al.,
“High-resolution fiber optic microscopy with fluorescent contrast enhancement for the identification of axillary lymph node metastases in breast cancer: a pilot study,”
Biomed. Opt. Express, 1
(3), 911
–922
(2010). http://dx.doi.org/10.1364/BOE.1.000911 BOEICL 2156-7085 Google Scholar
H. Yamauchiet al.,
“Inflammatory breast cancer: what we know and what we need to learn,”
Oncologist, 17
(7), 891
–899
(2012). http://dx.doi.org/10.1634/theoncologist.2012-0039 OCOLF6 1083-7159 Google Scholar
A. L. van de VenK. Adler-StorthzR. Richards-Kortum,
“Delivery of optical contrast agents using Triton-X100, part 2: enhanced mucosal permeation for the detection of cancer biomarkers,”
J. Biomed. Opt., 14
(2), 021013
(2009). JBOPFO 1083-3668 Google Scholar
P. P. Rosen, Rosen’s Breast Pathology, Lippincott Williams & Wilkins, Philadelphia, Pennsylvania
(2008). Google Scholar
J. L. FleissB. LevinM. C. Paik,
“The measurement of interrater agreement,”
Statistical Methods for Rates and Proportions, John Wiley & Sons, Inc., Hoboken, New Jersey
(2003). Google Scholar
M. B. BartonR. HarrisS. W. Fletcher,
“The rational clinical examination. Does this patient have breast cancer? The screening clinical breast examination: should it be done? How?,”
J. Am. Med. Assoc., 282
(13), 1270
–1280
(1999). http://dx.doi.org/10.1001/jama.282.13.1270 JAMAAP 0098-7484 Google Scholar
J. R. LandisG. G. Koch,
“The measurement of observer agreement for categorical data,”
Biometrics, 33
(1), 159
–174
(1977). http://dx.doi.org/10.2307/2529310 BIOMB6 0006-341X Google Scholar
J. SimC. C. Wright,
“The kappa statistic in reliability studies: use, interpretation, and sample size requirements,”
Phys. Ther., 85
(3), 257
–268
(2005). POTPDY Google Scholar
A. J. VieraJ. M. Garrett,
“Understanding interobserver agreement: the kappa statistic,”
Fam. Med., 37
(5), 360
–363
(2005). Google Scholar
R. A. McLaughlinet al.,
“Imaging of human lymph nodes using optical coherence tomography: potential for staging cancer,”
Cancer Res., 70
(7), 2579
–2584
(2010). http://dx.doi.org/10.1158/0008-5472.CAN-09-4062 CNREA8 0008-5472 Google Scholar
F. T. Nguyenet al.,
“Intraoperative evaluation of breast tumor margins with optical coherence tomography,”
Cancer Res., 69
(22), 8790
–8796
(2009). http://dx.doi.org/10.1158/0008-5472.CAN-08-4340 CNREA8 0008-5472 Google Scholar
F. T. Nguyenet al.,
“Optical coherence tomography: the intraoperative assessment of lymph nodes in breast cancer,”
IEEE Eng. Med. Biol. Mag., 29
(2), 63
–70
(2010). http://dx.doi.org/10.1109/MEMB.2009.935722 IEMBDE 0739-5175 Google Scholar
F. D’Halluinet al.,
“Intra-operative touch preparation cytology following lumpectomy for breast cancer: a series of 400 procedures,”
Breast, 18
(4), 248
–253
(2009). http://dx.doi.org/10.1016/j.breast.2009.05.002 1475-3480 Google Scholar
O. A. Adeyi,
“Pathology services in developing countries—the West African experience,”
Arch. Pathol. Lab. Med., 135
(2), 183
–186
(2011). APLMAS 0003-9985 Google Scholar
|
|||||||||||||||||||||||||||||||||||||||||||||||||||||||||||||||||||||||||||||||||||||||||||||||||||||||||||||||||||||||||||||||||||||||||||||||||||||||||||||||||||||||||||||||||||||||||||||||||||||||||||||||||||||||||||||||||||||||||||||||||||||||||||||||||


