|
|
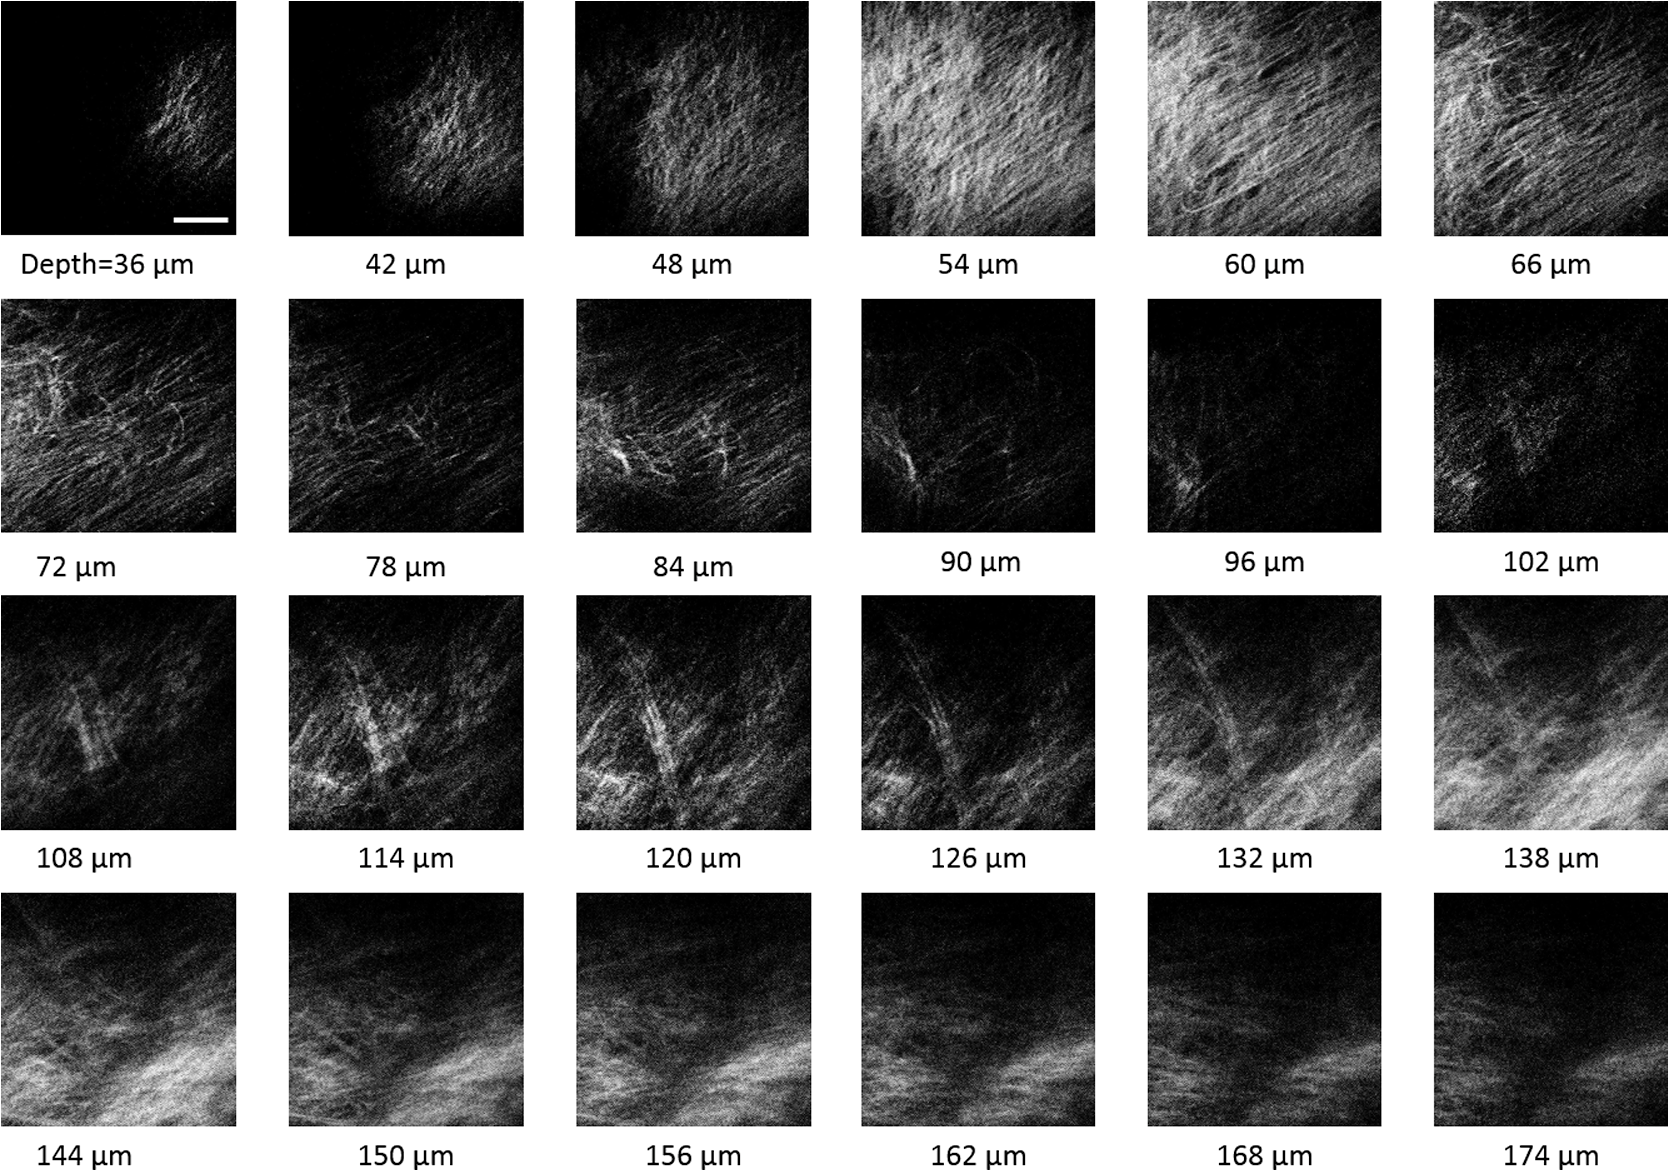
1.IntroductionRecently, there have been significant developments in phonosurgery, the surgical treatment of vocal fold pathology, but vocal fold scarring remains a therapeutic challenge.1 Chronic voice impairment due to vocal fold scarring is estimated to affect million people in the United States alone.2 However, there is no reliable treatment for restoring proper phonation to individuals with scarred vocal folds. One of the current treatment methods, speech therapy, consists of training appropriate voice behavior.3 Although this technique has been reported to improve voice quality in some cases, surgical restoration of scarred phonatory mucosa is still difficult to achieve in the clinics.4 The use of injectable materials to restore pliability of the superficial lamina propria (LP) is a strategy that has shown promise in preclinical studies.1,5–9 Ongoing development of such materials is a significant research focus in the field of phonosurgery. A common unsolved problem faced by the surgical use of injectable materials is their accurate and effective placement in a superficial plane in scarred vocal folds. Contemporary understanding of the microanatomy of the human vocal fold10 reveals a layered structure that consists of epithelium as the outermost layer, followed by the LP and the vocalis muscle. The LP can be subdivided into superficial, intermediate, and deep lamina sublayers based on the distribution of extracellular matrix (ECM) fibrous proteins such as collagen and elastin. Collagen and elastin fibers are largely responsible for providing the strength and elasticity of the vocal folds. The superficial LP (SLP) has a thin sheet of collagen fibers that are highly aligned along the length of the vocal fold.11 Below these fibers, the SLP mainly consists of amorphous ground substance (primarily, proteoglycans and glycosaminoglycans) with scattered elastin and collagen fibers, fibroblasts, and other elements typical of loose connective tissue.12 During the wound healing response, scar tissue can replace the SLP along with deeper parts of the LP. The scar tissue predominantly consists of collagen and fibronectin, both of which increase the stiffness of the mucosa and can lead to severe impairment in voice production or dysphonia.1 According to Burns et al.,13 injection of soft biomaterials in the subepithelial region of scarred vocal fold tissue is likely to be challenging due to presence of dense scar tissue. Such dense tissue could require high-injection pressures and limit precision, since injections tend to take a path of least resistance. We propose a method to overcome this challenge by creating a planar ablation void—essentially a thin subepithelial plane of separation, so that the injected substances could easily dissect into it, forming a mattress-like layer similar to the normal SLP regardless of scar tissue inhomogeneities.14 The ablation plane would ideally encompass the scarred phonatory area, which could extend over an area as large as in a heavily scarred vocal fold. We hypothesize that such a void will reduce the required injection pressure and improve the superficial localization of an injected biomaterial for restoration of a phonatory mucosal wave. Focused ultrafast laser pulses are uniquely suited for creating subsurface voids. Having short-pulse durations, and thus high-peak intensities, ultrafast lasers ensure the use of minimal energies for high-precision ablation with minimal damage to the surrounding tissue. Ablation of a dielectric material, such as tissues, with ultrafast laser pulses begins with the generation of free electrons through combination of multiphoton ionization and band-gap (Zener) tunneling.15,16 The quasi-free electrons may then act as seed electrons for avalanche ionization. During avalanche, quasi-free electrons accelerate by gaining kinetic energy from the incident laser field. Accelerated free electrons collide with bound valence electrons and ionize them through impact ionization. This exponential multiplication process repeats and cascades until the termination of the laser pulse. The final value of the free electron density determines the photodamage mechanism, which can be photochemical, induced by thermo-elastic stress confinement, or a result of optical breakdown when a critical electron density is reached.17,18 In the thermo-elastic stress confinement, thermalization of the plasma occurs faster than the acoustic relaxation time.15 The confinement of thermal stresses can overcome tensile strength of tissue and lead to its tearing. Similarly, tissue fracture/tearing may occur in the optical breakdown regime due to the shock wave formation, as the strength of the pressure increase across the shock wave exceeds tissue tensile strength.19 In addition to mechanical effects, the mechanism for the free electron generation determines the ablation threshold that depends on the laser pulse duration, initial seed electrons, and the linear absorption of tissue. The multiphoton ionization dominates the free electron generation for pulse widths .20 At longer pulse durations in the range of 500 fs to 10 ps, the contribution of cascade ionization to the formation of free electrons increases by at least 3 to 4 orders of magnitude, however, with no drastic change in the ablation threshold and the thermo-mechanical effects.21 Lower threshold fluence can be observed in the presence of initial seed electrons in the focal volume due to impurities. However, this effect is only noticeable for pulse widths .22 For the effect of linear absorption, a two to threefold decrease in the ablation threshold can be observed if tissue absorption coefficient is increased by 3 orders of magnitude from 0.1 to (Ref. 23). The ultrafast ablation process relies upon efficient and rapid energy absorption at the focal plane, which results in minimal energy deposition to the surrounding tissue. The nonlinear nature of the process further confines the efficient absorption to subfocal volumes. Such a high degree of damage confinement is especially important when working with delicate tissue, such as vocal folds, and may reduce postablation scar formation. Successful laser microsurgery of vocal fold tissue using femtosecond laser pulses has been previously demonstrated, showing the potential for subsurface ablation confined within the sublayers of the LP by our group14 and others.24 To guide ultrafast laser microsurgery, focused ultrafast laser pulses can also be used to visualize intrinsic molecular and morphological properties of tissues through nonlinear optical microscopy. Specifically, simultaneous two photon-autofluorescence (TPAF) and second harmonic generation (SHG) microscopies25–27 can provide complementary information on the structure of the superficial layer of vocal folds and scar tissue that might be present. The use of near-infrared (NIR) wavelengths provides superior penetration depth for nonlinear microscopy techniques with respect to conventional fluorescence microscopy. Low-energy ultrafast laser pulses for imaging can thus provide ultrafast laser microsurgery devices a means for visualizing the region of surgery with the identical field-of-view and resolution of the surgical laser. We have recently demonstrated fiber-based miniaturized probes for delivering ultrafast laser pulses for microsurgery and nonlinear imaging28,29 and found that we could create two-dimensional voids within porcine vocal folds using laser and focusing parameters that are deliverable with these probes.14 Here, we examine the effect of morphological and structural differences on the creation of thin voids within ex vivo tissue samples. We specifically compare ablations in superior and inferior porcine vocal folds and in healthy and scarred hamster cheek pouches. Our primary goals are to characterize the ablation parameters, such as ablation threshold fluence (pulse energy per area of the focused laser spot), maximum ablation depth, and dynamics of bubbles in subepithelial voids in these samples. 2.Methods and Materials2.1.Experimental SetupWe upgraded our home-built, bench-top laser-scanning microscope (Fig. 1) to include two channels for simultaneous imaging of TPAF and SHG signals. For both microsurgery and imaging, the microscope uses a single ultrafast laser system: a 303-kHz (or 2-MHz) repetition rate and 3-W erbium-doped fiber laser ( Discovery, Raydiance Inc., Petaluma, California). This laser is a slightly modified version of the one used in our previous study14 and provides two modes of repetition rate, a 2-MHz mode (1-ps pulse duration) and a 303-kHz mode (3.2-ps pulse duration). It can be frequency doubled to 776 nm with a 36% conversion efficiency at the SHG box. At 776 nm, the laser produces maximum pulse energies of 0.5 and 3.6 μJ at 2 MHz and 303 kHz, respectively. The overall optical transmission of the microscope at 776 nm is 42%, delivering maximum pulse energies of 0.2 and 1.5 μJ at 2 MHz and 303 kHz, respectively, to tissue surface. Fig. 1Schematic of the two-channel, bench-top microscope for combined nonlinear imaging and microsurgery. Ultrafast laser pulses from a compact fiber laser system pass through an energy attenuator consisting of a half-wave plate () and polarizing cube beam splitter (PCBS). The beam is scanned by a pair of galvanometric scanning mirrors (SM) through a scan lens (SL) and tube lens (TL), which image the beam on the SM to the back aperture of a 0.75 NA, objective lens (OL). The laser pulses irradiate the sample placed on a three-axis motorized stage (XYZ) for either ablation or imaging. Emitted light is collected by a cold mirror (CM1—HT-1.00, CVI Laser, Carlsbad, CA) and collection optics (CO). A second cold mirror (CM2—Di01-R405, Semrock, Lake Forest, IL) separates the second harmonic generation (SHG) and two-photon autofluorescence (TPAF) signals into different collection paths. We collect the TPAF signal through collection optics A (COA) and a laser-blocking filter (FA) into the PMT A (H10770PA-40, Hamamatsu, Japan) and the SHG signal through collection optics B (COB) and a laser-blocking filter B (FB) into the PMT B (R3896, Hamamatsu, Japan). The two PMT’s, stage, and scanning mirrors are all connected to a personal computer through data acquisition cards (not shown). Insets show (a) the schematic of the laser-scanning pattern at the sample during microsurgery and (b) the degree of overlapping between subsequent laser pulses.  We focused the laser beam with a 0.75 NA, air objective (Nikon Plan Apo, Tokyo, Japan) to a spot size achievable in our recent miniaturized microsurgery probes.28,29 We characterized the spatial distribution of laser beam at the focal volume by measuring the two-photon point spread function () of our system. Specifically, we used 100-nm fluorescent beads (Invitrogen, Grand Island, NY, F8803) suspended in agar gel at a concentration of and covered with a glass cover slip (0.17-mm thickness). This bead concentration provided an equivalent scattering length of 35 μm at 776-nm excitation wavelength, which was in the range of effective scattering length of LP of our samples. Independently, previous studies have demonstrated that the IPSF2 in turbid media is constant in the range of our imaging depths, as the two-photon signal is mainly generated by the ballistic photons reaching the focal volume.30–32 The average lateral and axial full-width half-maximums (FWHM) of the were measured to be and corresponding to and diameter of the intensity distributions. The diameter of the intensity distribution is times of the FWHM of the (Ref. 25). For microsurgery, we raster scanned the laser beam at a single depth below the surface for the duration of one frame, namely 310 ms (3.21 fps), using a pair of galvanometric mirrors (Cambridge Technologies, Inc., Bedford, MA). The inset in Fig. 1 shows how the focal spot was swept over a area. This scanning mechanism was slightly different than the one used in our previous study,14 where the surgery beam was raster scanned only in one direction, while a translation stage continuously moved the sample in the other direction. With a goal to minimize the ablation duration, we chose to use minimal continuous overlapping of the laser pulses in the direction of the scanning. A low degree of overlapping improves the possible beam distortion of consequently overlapping pulses as well as the speed of ablation. However, without significant pulse-to-pulse accumulation effects, higher pulse energies are usually needed for complete ablation.17 The choice of one overlapping pulse in the -direction (822 Hz) automatically dictates approximately three overlapping pulses in the -direction (3.21 Hz) by the imaging software (MPScan). Considering that it takes 310 ms to scan a wide region, we can estimate the speed of ablation with three overlapping pulses as . The axial displacement of the sample was performed using a motorized stage. The amount of the axial movement of the stage results in a focal shift within the tissue, due to the index of refraction mismatch at the air/tissue interface. The ratio of the real displacement within tissue to that of the stage, the focal shift ratio, is defined by the ratio of the refractive index of the tissue to the medium in which it is immersed in. We experimentally determined the focal shift ratio of the air lens through taking a stack of images and comparing it to the images acquired with a water-dipping lens, having a negligible mismatch at the water/tissue interface. By comparing images at different depths, we observed the focal shift ratio to be 1.2, slightly less than the expected value of 1.33. We attributed the low-focal shift ratio possibly to positive spherical aberrations observed in the air objective when focused in tissue samples. In our experiments, we therefore multiplied the stage displacement by the measured ratio of 1.2 to obtain the correct focal shift, thus axial scaling, within the tissue. 2.2.Ex Vivo Tissue SamplesThe elastin and collagen distributions within the porcine LP have been shown to be similar to human.33–35 We used the hamster cheek pouch as a model of scarred mucosa. The hamster cheek pouch model has been accepted as one of the best animal models for studying epithelial diseases36–38 and determining the efficacy of treatments.39–41 In order to understand the effect of fiber structure and morphology on ablation, we used five fresh porcine vocal folds (superior and inferior) and three Golden Syrian hamster cheek pouches (healthy and scarred). 2.2.1.Fresh porcine vocal foldsWe acquired fresh porcine airway specimens from a local slaughterhouse and isolated the larynx in a room temperature saline bath within 2 h after sacrificing the animal. Porcine vocal folds have layered LP very similar in structure to human vocal folds. Although some preliminary studies showed the presence of a prominent subepithelial collagen layer in the SLP, there is no agreement whether the superior or inferior LP of the porcine is primarily responsible for phonation.42 Therefore, we decided to use both the superior and inferior porcine vocal folds for our experiments to test whether differences in their microanatomy correlate in meaningful ways with differences observed in laser ablation and imaging. After excision, we placed each vocal fold in saline and covered it with a glass cover slip (0.17-mm thickness) to flatten the surface. In a clinical application, the glass cover slip would be akin to having the window of a microsurgery probe in contact with the sample, and thus helping to maintain a constant depth of ablation. Short-lived cellular autofluorescence of fresh tissue samples guided us to identify the surface of the sample during imaging. For follow-up histology, we placed the superior and inferior vocal fold samples in 10 mL of 10% formalin (SF98-4, Fisher Scientific, Pittsburgh, PA) and stored them at 4°C for at least 48 h prior to paraffin embedding, sectioning, and staining (TherapeUTex, Austin, Texas). The dehydration process was performed with ethanol and Citrisolv. A combination Masson-Trichrome and Verhoeff staining was used to differentiate elastin and collagen.43 2.2.2.Hamster cheek pouch mucosa as a scar modelWe used adult male Golden Syrian hamsters (Charles River Labs, Wilmington, Massachusetts) of 100 to 120 g body weight as an animal model, in which scar can be created within an easily accessible mucosal surface. The goal in these experiments was to observe how the structural differences between normal and scarred buccal mucosae affected ablation results. To scar the cheek pouches, we first anesthetized the animals by injecting a mixture of ketamine () and xylazine () intraperitoneally. We then cauterized 5 to 10-mm-diameter circular areas of one cheek pouch with an electrocautery unit (Conmed Saber, Utica, NY, 2400). The hamsters were euthanized after a survival period of 1 month using 0.5 ml intraperitoneal euthasol. The scarred and contralateral normal cheek pouches were removed and mounted on rubber test-tube stoppers with fine needles to hold the cheek pouch mucosa flat. After rinsing with saline, the tissue was frozen in isopentane cooled in liquid nitrogen. The cheek pouch tissue was prepared at Massachusetts General Hospital Voice Laboratory (MGH) in Boston and shipped on dry ice to the Ben-Yakar Laboratory at the University of Texas at Austin for bench-top testing. After delivery, the cheek pouches were stored at . For each experiment, we thawed the cheek pouches in saline solution and covered them with a glass cover slip to flatten their epithelial surface. For the histological analysis of the healthy and scarred tissues, we placed them in 10 mL of 10% formalin (SF98-4, Fisher Scientific, Pittsburgh, PA) and stored them at 4°C prior to paraffin embedding, sectioning, and staining (TherapeUTex, Austin, Texas). For cheek pouches, an additional dehydration step with ethanol and xylene was added due to the abundant fat content in this tissue. Masson-Trichrome staining was used to show the orientation of the collagen fibers.43 3.Results3.1.Imaging of Tissue ArchitectureWe combined TPAF and SHG nonlinear imaging modalities for characterizing the tissue architecture of our samples, identifying the desired depth for laser ablation, analyzing the dynamics of the ablated voids, and finally characterizing the tissue ablation properties. The combination of SHG and TPAF imaging is a powerful method to differentiate the structure and type of fibers in the SLP, whether it is made of collagen and/or elastin. Previous studies have shown that elastin fibers auto-fluoresce44–46 but cannot produce SHG signal, while a wide variety of collagen fibers generates SHG.27 Therefore, SHG is considered to be selective of collagen fibers. Since some collagen types with SHG signal can also auto-fluoresce;44 TPAF alone, however, this is not considered to be selective of elastin fibers. Therefore, combined SHG and TPAF imaging is necessary to clearly identify the fiber type and its density. Figure 2 shows a stack of representative overlaid images of TPAF and SHG signals through the mucosa of fresh superior porcine vocal fold. Close to the surface, only TPAF (red) signal, originating from the epithelial cells, was visible. Starting at a depth of 42 μm, SHG (green) signal accompanied TPAF which indicated the existence of fibrous structures. The SHG showed thick bundle-like fibers, while the TPAF showed thin and long fiber structures. The orientation of these signals was different, suggesting that they might be originating from different fiber structures. As imaging depth increased, the SHG-generating structures became denser, covering the whole field of view (FOV). Beyond 120 μm, the contrast decayed substantially. Fig. 2Overlaid TPAF (red) and SHG (green) images of fresh superior porcine vocal fold. TPAF signals from epithelial cells are observed until a depth of 36 μm, and then TPAF and SHG signals from different fiber structures are detected up to 120 μm depth, beyond which the imaging contrast decays substantially. We increased the average imaging power gradually from 0.9 mW at the surface to 6 mW at 120 μm depth. The scale bar represents 100 μm.  Figure 3 shows representative images of porcine inferior vocal folds. Here, the TPAF and SHG signals overlaid better than that was seen for the superior vocal folds, suggesting that they were originating from similar fibers. Since SHG signal mainly originates from collagen, these SHG-positive fibers in the inferior vocal folds were mostly collagen with less elastin content as opposed to superior vocal folds. Fig. 3Overlaid TPAF (red) and SHG (green) images of fresh inferior porcine vocal fold. The overlaid signals appear in yellow. Both TPAF and SHG signals show similar fiber structures that can be detected up to 144 μm, beyond which the imaging contrast decays substantially. We increased the average imaging power gradually from 0.9 mW at the surface to 8.2 mW at the maximum imaging depth. The scale bar represents 100 μm.  To identify the type of fibers in the vocal folds more deterministically, we used stains selective for collagen and elastin fibers. Specifically, we used a combined Masson-Trichrome/Verhoeff method that stains collagen fibers green and elastin fibers black.43 Thin smooth elastin fibers (black) and wavy collagen bundles (green) were visible in the superior vocal fold [Fig. 4(a)], while mostly collagen and sparsely distributed elastin fibers were seen in the inferior vocal fold [Fig. 4(b)], confirming our observations from nonlinear imaging. Fig. 4Histology images of porcine vocal folds and hamster cheek pouches. (a) Superior and (b) inferior vocal folds at 70 μm depth with combined Masson-Trichrome (shows blue for collagen fibers) and Verhoeff (shows black for elastin fibers) stains. (c) Control and (d) scarred cheek pouches at 70 μm depth with Masson-Trichrome stain. Scaling bar represents 100 μm.  We next studied the morphology differences between control and scarred hamster cheek pouches. Similar to the porcine vocal folds, the cheek pouch consists of a thin squamous epithelium with a thickness varying between 35 and 45 μm, a thin LP of loose connective tissue, and an underlying striated muscle. As would be expected with previously frozen tissue samples, where the main autofluorescence sources such as NADH, NADPH, and flavins would be substantially degraded, TPAF signal could not be observed in the epithelium. Unlike the porcine vocal folds, we did not observe any TPAF signal below the epithelium in the region where a substantial SHG signal was present. Figures 5 and 6 show SHG images of control and scarred hamster cheek pouches, respectively. The SHG signal in both samples started to appear at a depth of 36 μm, first increasing and then decreasing in intensity along the tissue depth. This SHG signal most probably originates from collagen fibers, delineating the interface between the epithelium and LP. At a depth of 60 μm, the SHG signal covered almost the whole FOV, where we chose to perform our ablations. Collagen fibers seemed to be randomly organized in the healthy control samples and more aligned and denser in the scarred samples, which is in agreement with another study that compared healthy and scarred rabbit vocal folds.47 Histology analysis of the Masson-Trichrome–stained hamster cheek pouches further confirmed these observations and provided insight on the pathology of the scarring. As compared with control [Fig. 4(c)], scarred tissue showed regular and dense patterns of collagen fibers [Fig. 4(d)]. Fig. 5Representative SHG images of control hamster cheek pouch samples. Starting at 36 μm depth, SHG signals shows randomly aligned collagen fibers with increasing, decreasing, and again increasing densities. We increased the average imaging power gradually from 0.8 mW at the surface to 9.6 mW at 174 μm. The scale bar represents 100 μm.  3.2.Ablation StudiesThe primary goal of this work was to identify laser parameters for the successful ablation of subepithelial voids in vocal folds and how these parameters vary when ablating scar tissue. For each tissue sample, we investigated ablation threshold fluences (pulse energy per area of the focused laser spot), maximum ablation depth, and initial bubble size and lifetime. 3.2.1.Ablation versus pulse energyWe previously showed that ultrashort pulses with submicrojoule energies can create voids below the epithelium layer using 0.75 NA, air objective.14 Here, we studied how the size of these voids varies with the pulse energy and how scarring affects the ablation properties. First, we verified how well nonlinear images correlated with the extent of the ablated voids by comparing them with histology images of H&E-stained tissue. Figure 7 presents this comparison for two different pulse energies including a near-threshold energy. Overall, there was a good correlation between the TPAF and the histology images in terms of the extent and morphology of voids for each pulse energy. The void ablated with the near-threshold energy of 250 nJ appeared incomplete, and the one ablated with the higher energy of 750 nJ was more complete and uniform. Consistent with our previous study,14 histology images showed slightly smaller voids mainly in their heights because of three potential reasons: (1) contraction during the histology preparation, (2) focal-point shift in the TPAF images due to the deflection of the beam at the tissue-void interface, as a result of the index of refraction mismatch between tissue and gas, and (3) shrinkage of voids during the period between TPAF imaging and tissue fixation. The heights of the voids were 40% to 50% smaller in the histology images, as a result of the reasons mentioned above. Fig. 7Comparison of cross-sectional TPAF images with histological analysis of voids in an inferior porcine vocal fold. The voids were ablated using (a) 250 nJ and (b) 750 nJ pulse energies at a depth of 90 μm beneath the tissue surface. Pre-ablation TPAF, post-ablation TPAF, and H&E-stained histology images are presented in the first, second, and third rows, respectively. Arrows in the TPAF images indicate the plane targeted for ablation. Arrows in the histology images indicate the location of the identified voids, corresponding well with the TPAF images. All scale bars are 100 μm.  We then studied ablation properties of healthy and scarred tissue samples. Figure 8 illustrates representative TPAF images of porcine superior and inferior vocal folds 1 min after ablation with different incident pulse energies. The ablation depth was 90 μm, where collagen fibers covered the whole FOV, and the plane of focus was completely below the epithelium within the SLP. We chose the ablation size () smaller than the FOV for imaging () to visualize the entire region of interest before and after ablation. The black areas with no signal presumably represent voids that are filled up with a temporary bubble containing gaseous products of the vaporized ablated tissue. At low-pulse energies from 250 up to 500 nJ, the ablation was partial and could not cover the whole targeted area, and the bubbles appeared small and scattered. Pulse energies of 750 nJ and above provided a more uniform and complete ablation. Inferior porcine vocal folds repeatedly required slightly less energy to obtain complete ablation. Fig. 8The effect of incident laser pulse energy on the subsurface ablation properties of porcine vocal folds. The TPAF images show the characteristics of subepithelial voids (bubbles) 1 min after ablation with different pulse energies (as measured at the surface) in superior (a) and inferior (b) vocal folds at the ablation depth of 90 μm. Scale bar indicates 100 μm. 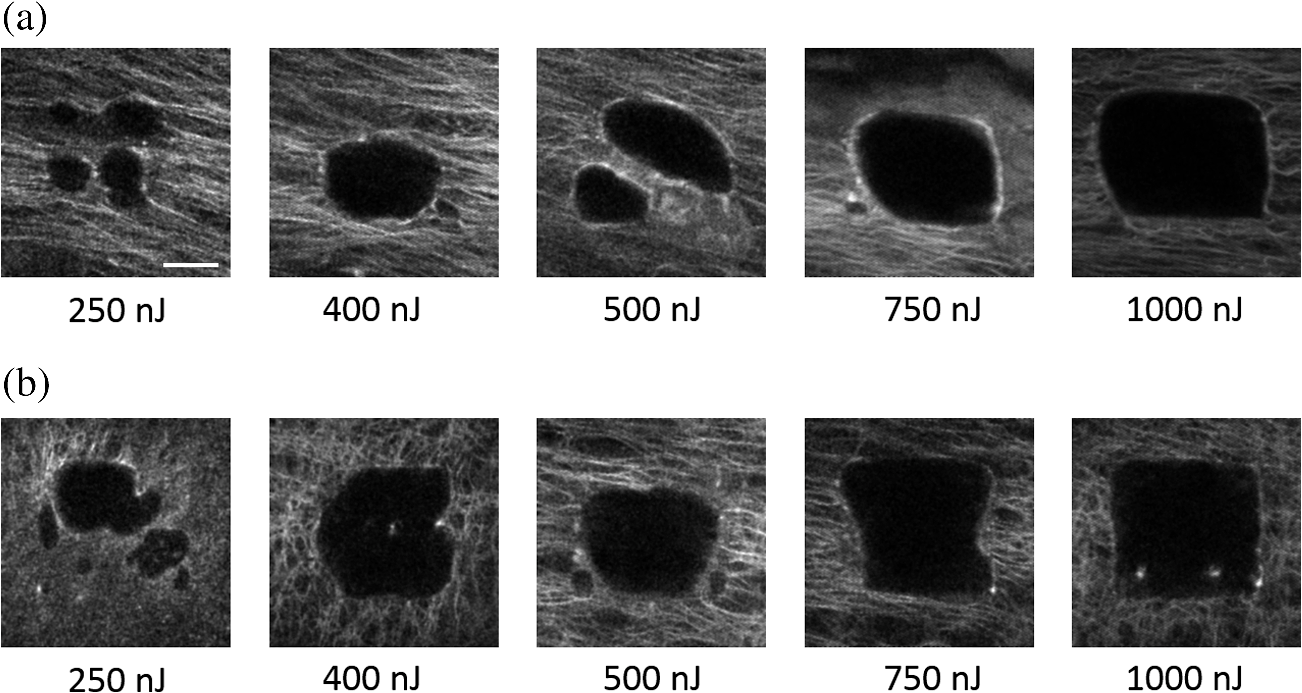 Figure 9 shows representative SHG images of control and scarred hamster cheek pouch samples 1 min after ablation, performed at a depth of 60 μm, where the SHG signal covered most of the FOV. While laser pulse energies of 150 nJ were just enough to initiate partially ablated spots in the control samples, they resulted in more uniformly ablated regions in scarred tissue. Scarred tissue repeatedly required less energy to obtain complete ablation. Fig. 9The effect of incident laser pulse energy on the subsurface ablation properties of hamster cheek pouches. SHG signal images of subepithelial voids (bubbles) for different incident energies 1 min after ablation in control (a) and scarred (b) hamster cheek pouches at the ablation depth of 60 μm. Scale bar indicates 100 μm.  3.2.2.Sample-to-sample repeatability of tissue ablationTo understand how the ablation characteristics of a specific tissue type vary from sample-to-sample, we studied five sample sets of fresh porcine vocal folds (five samples for superior and five samples for inferior) and three sample sets of hamster cheek pouches (three samples for control and three samples for scarred) at three different locations per pulse energy per sample. We measured the initial area of the bubble at the targeted plane immediately after ablation for each incident pulse energy varying between 50 and 1500 nJ. Figure 10 represents the plots of these measurements as normalized to the size of the targeted ablation area of . A unit area is considered to indicate a complete ablation. As a general trend, the size of the bubbles gradually increased with the laser pulse energy and covered the whole targeted ablation area at higher energies. Fig. 10Normalized area of the initial bubbles in the ablated voids at different incident pulse energies 1 min after ablation. Each data point represents an average of (a) 15 measurements in five fresh porcine vocal folds and (b) nine measurements in three hamster cheek pouches. The error bars represent the standard deviation of the mean of the samples.  Figure 10(a) indicates that inferior vocal folds generally required less energy than the superior to create the same size of bubbles. The area of the initial bubble matched the targeted area as the incident pulse energy approached to 1.0 and 1.5 μJ in the inferior and superior vocal folds, respectively, and exceeded the targeted area beyond those energy levels. The difference in the initial bubble area was also distinctly close to the threshold energy. For example, ablation at 250 nJ resulted in minimally observable bubbles in the superior folds and in slightly larger bubbles, covering more than 40% of the targeted area, in the inferior. The ratios of the pulse energies for complete (100% of the area) and partial (40% of the area) ablations were approximately 4 for both types of vocal folds. Figure 10(b) compares the bubble area results for healthy and scarred hamster cheek pouch samples. As shown in the previous section, the minimum energy required for ablation in this tissue was lower than for porcine vocal folds. Interestingly, however, the scarred tissue required less energy than the healthy tissue to initiate ablation at 60 μm depth. Close to threshold, where 40% of the area is ablated, ablation initiated in the scarred tissue with incident energies as low as 50 nJ, at which no bubble appeared in the healthy tissue. The initial bubble area approached the targeted area between 600 and 700 nJ pulse energy, while it was consistently larger in scarred samples for the same energy levels. The standard deviation of each data presented in Figure 10 shows noteworthy differences in the areas of the initial bubbles. Nonetheless, we could extract general trends of each tissue type, as the error bars of each tissue type did not significantly overlap with its counterpart (inferior versus superior and control versus scarred). To summarize, these results indicated that it was easier to ablate scar tissue than healthy tissue, and it was easier to ablate inferior vocal fold than the superior vocal fold. In the next section, we will discuss the hypotheses explaining these differences in ablation thresholds. 3.2.3.Ablation threshold and tissue scattering propertiesThe differences in the incident energy thresholds for different tissue types might be a result of one or both of the following factors: (1) the scattering length of the tissue that determines the portion of the incident energy reaching the focal volume and (2) the sensitivity of the specific tissue to ablation, which we refer to as tissue-specific ablation threshold—TSAT fluence (). Independent measurement of these two parameters is not straightforward, as they depend on each other. While it is easy to measure the incident pulse energy at the surface that is required to initiate ablation at a given depth, the calculation of the energy reaching the actual ablation depth requires knowledge of the extinction properties of the tissue. Furthermore, the extinction properties might vary with depth as the light passes through different layers, e.g., from the epithelium into the LP. We therefore developed a method to measure ablation threshold fluence and extinction properties of tissue simultaneously in a single set of experiments. In our approach, we assumed that scattering dominated the extinction properties of tissue in the NIR wavelengths and is different in the epithelium and LP but constant within each layer. This assumption is valid, since the absorption coefficients are expected to be 3 orders of magnitude smaller than the scattering coefficients as observed in skin epidermal measurements.48,49 We also assumed that the TSAT was independent of depth within the LP, and thus should remain constant in the targeted regions of subepithelial ablations. Finally, we assumed that Beer’s law could be used to estimate the attenuation of light reaching the focal volume, since the nonlinear ultrafast ablation processes are mostly governed by the ballistic photons reaching the focal plane. In the light of these assumptions, we measured the minimum incident energy required to initiate ablation at three ablation depths, , and used the Beer’s law to describe the exponential beam attenuation with depth for each case: Here, the pulse energy reaching the focal plane at the ablation depth decays exponentially with the effective scattering length, : We could then estimate the three unknown parameters: TSAT fluence at the focal plane, , epithelium scattering length, , and LP scattering length, by solving Eq. (1) at three depths. The radius of the laser beam at the focal plane was , and the local epithelium thickness, , was measured via the nonlinear images for each ablation data point. To find the three unknowns in our experiments, we performed ablations at three different depths (72, 90, and 108 μm for porcine vocal folds and 60, 78, and 96 μm for hamster cheek pouches). At each depth, we measured the local and found , which is defined as the energy required to create an initial bubble covering 40% of the targeted area. For each tissue type, we used two samples, and for each depth, we collected data at three different locations to obtain an average value. The results are tabulated in Table 1. Table 1Summary of tissue optical and mechanical properties and ablation thresholds. Epithelium thickness (zep), scattering lengths of epithelium (ℓs,ep) and superficial lamina propria (SLP) (ℓs,LP), the resultant effective scattering length at the ablation depth (ℓs,eff), and tissue-specific ablation threshold—TSAT fluence (Fth) for each tissue type for 776 nm light and 1/e2 focused beam spot diameter of 1.4 μm. The ablation depth for vocal folds was 90 μm and for cheek pouches was 60 μm. The last four columns summarize the observed trends for the content of elastin and collagen fibers of each tissue type with their interpreted stiffness and tensile strength.
These data shed light on the ablation threshold results observed in the previous section. We found that cheek pouches to be more scattering than porcine vocal folds ( versus 33 μm), but they had lower ablation threshold fluence than the porcine vocal folds, an average of for cheek pouches versus for vocal folds. While the scattering lengths were different, the normalized depths presented in Figs. 8–10 were nearly constant ( and 2.7 for cheek pouches and vocal folds, respectively) considering the different ablation depths. We could therefore conclude that the difference in the ablation threshold fluences was the main factor for the lower incident energies, , required to ablate hamster cheek pouches (50 to 150 nJ) as compared with those required for porcine vocal folds (250 to 500 nJ) to initiate ablation. The data in Table 1 also assist in interpreting the lower incident energies required for scarred cheek pouches. In comparing normal and scarred hamster cheek pouch mucosae, surprisingly we found that the scarred samples showed similar scattering properties as normal tissue. Thus, the main reason for lower incident ablation energy threshold in scarred mucosa observed in the previous section could also be related to the TSAT fluence that was about 30% lower than that for normal tissue. Considering the ablation and scattering properties measured in this set of experiments, we plotted the maximum ablation depths that are achievable for a given incident pulse energy for each tissue type in Fig. 11. For the maximum pulse energy of 1.5 μJ available in our system, the maximum ablation depth is approximately in cheek pouches and in vocal folds for creating partial ablation (where initial bubbles cover 40% of the targeted area). Since the ablation threshold is higher for a more complete ablation, the maximum ablation depth will further decrease. For example, for the ablation of 60% to 80% of the target area, maximum ablation depth may be roughly for cheek pouches and for vocal folds, as shown in dashed lines in Fig. 11. In principle, one could ablate deeper with the availability of larger pulse energies. However, as the pulse energy increases, other nonlinear phenomena, such as self-focusing, might initiate and cause out-of-focus damage in the form of filamentations.50 We can estimate that self-focusing in scarred cheek pouches might occur when ablating at depths of to with pulse energies using 3-ps NIR laser pulses. Fig. 11Minimum pulse energy at the surface to initiate ablation at different depths, and the resultant maximum ablation depth dependence on pulse energy. Three experimental data points for each tissue type and the resultant fits according to Eq. (1) considering the calculated ablation and tissue properties are tabulated in Table 1. Solid lines represent estimates for the ablation of 40% of the targeted area, and dashed lines represent estimates for a more complete ablation of 60% to 80%. Vertical black-dashed line indicates the maximum pulse energy of 1.5 μJ that can be delivered to tissue surface in our setup.  This ablation depth limitation might be overcame by introducing novel techniques, such as temporal focusing, to reduce the out-of-focus peak intensities.51,52 In simultaneous spatial and temporal focusing, a dispersive element, such as a grating, is used to spatially separate the spectral components of the ultrafast laser pulse.53 The resulting pulse is temporally as well as spatially dispersed, resulting in a dramatically reduced peak intensity. Focusing by the objective lens serves to spatially confine the spectrally dispersed beam back to a diffraction-limited spot, and thus recombining the spectral pulse components and restoring the ultrafast pulse duration at the focus. The reduced peak power of the pulse during propagation reduces undesirable nonlinear effects, such as self-focusing and filamentation, thereby improving the maximum ablation depth and axial confinement. 3.2.4.Bubble dynamics in ablated voidsIn our previous studies, we have found that the initial bubbles formed right after ablation, shrank to a thin layer within 45 min. Figure 12 shows representative time-lapse images of the side view of such a bubble in porcine vocal fold, where the tissue was illuminated from the left side. The images show a gradually shrinking bubble, as the vaporized tissue diffused out. As the bubble shrinks, it leaves behind a thin layer of ablated void, which is indicated as a thin layer of dark region in the last nonlinear image. Fig. 12Time-lapse side view TPAF images of a bubble in a subepithelial void that was created with 750 nJ pulse energy in inferior vocal fold. Multiple arrows on the left side show the direction of the laser beam. The arrow on top shows the axial location of the targeted ablation plane. Scale bar indicates 100 μm.  These bubbles could also be detected with the naked eye after the ablation and used as indicators of successful void creation and presumably for guiding the injection needle. We therefore studied the lifetime of these bubbles for a range of energies from which bubbles covering more than 80% of the targeted area can be created and how they vary between two representative samples. Specifically, we followed volumes of bubbles in two sets of samples for each tissue type, whose initial bubble areas were presented in Fig. 10. Figure 13 illustrates the dynamics of bubble volumes with time. We measured the bubble volume by counting the number of dark pixels in three-dimensional nonlinear images. To correct for the artifact of tissue/gas index of refraction mismatch at the boundaries of the void, the axial dimension of the bubble was downsized by a factor of 1.2, assuming that the bubble had an index of refraction similar to that of air. We note that this correction simply reverses the original focal shift correction made for the air lens when focused within the tissue. Fig. 13Bubble lifetimes for different pulse energies for two different samples for each tissue. (a, b) Superior and inferior porcine vocal folds. (c, d) Control and scarred hamster cheek pouches. Solid lines represent sample 1, and dashed lines represent sample 2.  The bubble lifetimes were generally consistent within a sample, but varied between the two samples. For example, in the first porcine samples, the bubble lifetimes in both superior and inferior vocal folds were between 80 and 100 min. In the second sample, their lifetime dropped to 30 and 40 min, highlighting sample-to-sample variability. In a given sample, the bubble lifetime did not change significantly with incident pulse energy, even if their initial volume did. In the hamster cheek pouches, the lifetime of bubbles in both control and scarred tissues were shorter than porcine samples, while the biggest drop was observed for the scarred tissue. Although the initial volumes of bubbles were, in general, larger in scarred cheek pouches than in the control, they lasted a shorter time on the average. As will be discussed in detail in Sec. 4, shorter lifetime of bubbles can likely be attributed to higher compression imposed by the dense and stiffened mechanical structure of scarred tissue. Overall bubble lifetime did not change within a sample significantly with the incident pulse energy but showed sample-to-sample variability. While the bubbles had the shortest lifetime (10 to 20 min) for scarred tissue, they might still provide enough time for verifying the creation of voids and guiding the injection of biomaterials. 4.Discussion and ConclusionsThe primary goal of this work was to study laser ablation parameters for creation of subepithelial voids in vocal folds and how these parameters varied in scar tissue using animal models. We specifically investigated the differences in tissue architecture and scattering properties, and their relation to ablation thresholds and bubble lifetime. By using nonlinear imaging, we analyzed tissue architecture and bubble dynamics. By developing a new method, we measured the ablation threshold below tissue surface, while simultaneously extracting the extinction properties of different tissue layers. In this section, we will discuss how the mechanical properties as interpreted from the nonlinear images could be related to the observed differences in the ablation characteristics and bubble lifetime. 4.1.Mechanical Properties of TissueNonlinear images provided valuable information on the architecture of LP in different tissues, shedding light on their stiffness and elasticity properties. We observed a predominance of collagen fibers (TPAF + SHG) in the inferior porcine vocal folds, while the density of elastin (TPAF) and collagen fibers (SHG) appeared roughly equal in the superior folds. On the other hand, the hamster cheek pouch samples showed only SHG signal below the epithelium, indicating a collagenous ECM, which increases in density with scarring. The collagen content of tissue defines its mechanical stiffness, which is directly proportional to the shear elastic modulus. In general, the elastic modulus of collagen is a couple of orders of magnitude greater than that of elastin.54 In addition, a threefold increase in the shear elastic modulus has been found for scarred samples compared with normal ones.55 Therefore, hamster cheek pouches having mostly collagen and no elastin are expected to be stiffer than the vocal folds, and scarring of cheek pouches is expected to increase in stiffness further due to their increased collagen density. In addition to being stiffer, collagen fibers also possess a higher tensile strength than elastin and can theoretically withstand much higher stresses in comparison with elastin. However, the ECM that is composed of both collagen and elastin, referred as a “two-phase” material, can provide even higher overall tensile strength than that of collagen alone. Elastin in two-phase material can distribute the stressing forces uniformly, and thus transfer stresses at flaws to other parts of the system. The uniform distribution of stresses across the system prevents the extension of structural defects and permits the tensile strength of the collagen to approach the theoretical value.54 In an opposite trend to the stiffness, this analysis points out that cheek pouches potentially possess a lower tensile strength compared with vocal folds. The ability of a collagen matrix to withstand high-stress levels is related to its concentration as well as fibril diameter.56 While a clear correlation between the tensile strength and collagen concentration has been shown,54 scarring is not simply an increase in collagen content, but it is a wound-healing process. In the process of wound healing, although collagen content increases, the new fibrils, filling in defects, are not as thick as those in normal tissue. Morphologically, the diameters of collagen in a scarred tissue have been observed to be less than that in normal tissue.57 Furthermore, the collagen matrix in the scarred area is poorly reconstituted in dense parallel fibers, unlike the mechanically efficient basket-weave meshwork of collagen in healthy tissue.58 Therefore, the tensile strength of the scar tissue only reaches 70% to 80% of that of a normal skin and is not fully restored.57 These mechanical properties of biological tissues are of great importance, as that could potentially determine the dynamics of the ablation process and bubble lifetime.19,59 To guide our discussion below, we summarized the observed trends for the content of elastin and collagen fibers of each tissue type with their interpreted stiffness and tensile strength in Table 1. 4.2.Effect of Mechanical Properties of Tissue on Bubble DynamicsWhen the ablation occurs within a confined volume below the surface, as in our experiments, the gaseous ablated tissue is confined within a bubble. These bubbles can initially expand slightly beyond the scanned area laterally (in the current study ) and up to 100 μm axially. As the gas slowly diffuses out, the initial bubble shrinks and eventually becomes a thin permanent void. The dynamics of bubble formation depend on the stiffness of media in which bubbles are generated. Recent vocal fold studies55,60,61 report a higher stiffness of scarred tissues because of their higher shear elastic modulus and dynamic viscosity. A force balance at the bubble wall reveals that the stiffness of the surrounding tissue aids surface tension in resisting and thus dissipating energy for bubble growth during bubble expansion, and thereby reducing maximum bubble radius. On the other hand, during bubble collapse, tissue stiffness aids the bubbles to shrink faster. Since the scarred tissues are expected to be stiffer, as discussed above, higher tension on the slowly shrinking bubble will help it to collapse faster than the less stiff normal tissue. In conclusion, shorter bubble lifetimes of scarred tissue observed in our experiments can be associated with their increased stiffness. 4.3.Effect of Mechanical Properties and Impurities on Ablation ThresholdThe ablation threshold results revealed, on average, a 3.5 times smaller threshold fluence for cheek pouches () than vocal folds (). Interestingly, the scarred cheek pouches showed a further 30% lower ablation threshold fluence () than the healthy cheek pouches (). The reduced ablation thresholds for scar tissue may be useful if this selectivity can be exploited in clinical applications. As discussed in Sec. 1, TSAT can be influenced by tissue mechanical properties, the amount of initial seed electrons due to impurities, and linear absorption. We first consider the effect of the mechanical properties of different tissues in terms of their stiffness and tensile strength by referring to the summary in Table 1. The optical breakdown can create shock waves and when the strength of the pressure across the shock wave exceeds the tensile strength of the tissue, it may cause further damage by a tearing/rapturing mechanism. Therefore, tissue with a higher tensile strength is expected to have a higher ablation threshold. The results clearly indicate a direct correlation between the tensile strength of tissue and the ablation threshold. The higher the content of elastin in the collagen/elastin system, the higher the tensile strength, and thus the ablation threshold. The observations of lower damage fluence for scarred cheek pouches with respect to control tissue are also in accordance with their lower tensile strengths, as a result of the wound healing process discussed above. To understand the effect of the initial seed electrons, we have simulated the free electron generation in water for varying initial free electron densities. Considering both multiphoton and cascade ionizations19,20,22 and assuming that the optical breakdown occurs when a critical electron density of is reached, we could estimate the threshold intensity for a 3-ps laser pulse. At the minimum possible electron density of that corresponds to the existence of a single electron in the focal volume, we found that the threshold for optical breakdown remained similar to the threshold in the absence of seed electrons. In the presence of a larger number of seed electrons (10 electrons per volume—), there was only a slight decrease (10%) in the threshold. It is possible that the scarring creates additional free electrons, possibly leading to the slight threshold reduction discussed above. However, it is not clear how much the scarring might change the number of seed electrons, and whether or not it leads to any possible linear absorption. Therefore, we conclude that the main mechanism for the differences in the TSAT fluences might be related to the mechanical properties of tissue, mainly to its tensile strength. In conclusion, ablation with moderate repetition rate () ultrashort laser pulses of 3 ps, resulted in precise and repeatable cutting of tissue and was confined within the focal volume with no collateral damage observable in the histology images. The existence of long-lasting bubbles should provide ample time for monitoring the completeness of ablation and guiding the surgeon better to the injection site, as verified in our recent studies.62 We have successfully demonstrated localization of a polyethylene glycol-based biomaterial inside the ablated subepithelial voids in a scarred hamster cheek pouch. Our attempts of injecting without previously created subepithelial voids resulted in backflow of the biomaterial along the point of injection. In contrast, the presence of subepithelial voids created at 90 μm below the tissue surface provided the space for the biomaterial that greatly reduced backflow at the injection site and resulted in a lasting localization of the injected material. The ablation characterization efforts presented in this article will guide the development of an ultrafast laser-assisted method to reduce injection pressures in the scarred vocal folds while improving localization of injected biomaterials. We are currently developing a new generation endoscope suitable for in vivo micro-laryngoscopic testing in large animal models. AcknowledgmentsGrants from the National Science Foundation (IDR: CBET-1014953 and Career Award: CBET-0846868) supported this work. We thank Raydiance, Inc. for use of their Discovery fiber laser, Dr. David Kleinfeld and his research group for the use of MPScan, as well as Dr. R. Rox Anderson, Dr. Christopher Hoy, Dr. Nicholas Durr, Dr. Richard Harrison, Dr. Aaron Friedman, Myoungkyu Lee, Navid Ghorashian, and Ki Hyun Kim for consultation. ReferencesS. Hirano,
“Current treatment of vocal fold scarring,”
Curr. Opin. Otolaryngol. Head Neck Surg., 13
(3), 143
–147
(2005). http://dx.doi.org/10.1097/01.moo.0000162261.49739.b7 1068-9508 Google Scholar
L. O. RamigK. Verdolini,
“Treatment efficacy: voice disorders,”
J. Speech Lang. Hear. Res., 41
(1), S101
–S116
(1998). 1092-4388 Google Scholar
M. S. Benningeret al.,
“Vocal fold scarring: current concepts and management,”
Otolaryngol. Head Neck Surg., 115
(5), 474
–482
(1996). http://dx.doi.org/10.1016/S0194-5998(96)70087-6 0194-5998 Google Scholar
P. Wooet al.,
“Diagnosis and treatment of persistent dysphonia after laryngeal surgery—a retrospective analysis of 62 patients,”
Laryngoscope, 104
(9), 1084
–1091
(1994). http://dx.doi.org/10.1288/00005537-199409000-00007 LARYA8 0023-852X Google Scholar
S. M. Zeitelset al.,
“Foresight in laryngology and laryngeal surgery: a 2020 vision,”
Ann. Otol. Rhinol. Laryngol. Suppl., 198
(9), 2
–16
(2007). AORHA2 0003-4894 Google Scholar
S. M. ZeitelsG. B. Healy,
“Laryngology and phonosurgery,”
N. Engl. J. Med., 349
(9), 882
–892
(2003). http://dx.doi.org/10.1056/NEJMra035148 NEJMAG 0028-4793 Google Scholar
M. S. Hahnet al.,
“Collagen composite hydrogels for vocal fold lamina propria restoration,”
Biomaterials, 27
(7), 1104
–1109
(2006). http://dx.doi.org/10.1016/j.biomaterials.2005.07.022 BIMADU 0142-9612 Google Scholar
X. Q. Jiaet al.,
“Hyaluronic acid-based microgels and microgel networks for vocal fold regeneration,”
Biomacromolecules, 7
(12), 3336
–3344
(2006). http://dx.doi.org/10.1021/bm0604956 BOMAF6 1525-7797 Google Scholar
R. S. BartlettS. L. ThibeaultG. D. Prestwich,
“Therapeutic potential of gel-based injectables for vocal fold regeneration,”
Biomed. Mater., 7
(2), 024103
(2012). http://dx.doi.org/10.1088/1748-6041/7/2/024103 1748-6041 Google Scholar
M. Hirano,
“Morphological structure of the vocal cord as a vibrator and its variations,”
Folia Phoniatr. Logo., 26
(2), 89
–94
(1974). http://dx.doi.org/10.1159/000263771 FPLOEP 1021-7762 Google Scholar
J. M. Pradeset al.,
“Lamina propria of the human vocal fold: histomorphometric study of collagen fibers,”
Surg. Radiol. Anat., 32
(4), 377
–382
(2010). http://dx.doi.org/10.1007/s00276-009-0577-9 0930-1038 Google Scholar
T. H. Hammondet al.,
“The intermediate layer: a morphologic study of the elastin and hyaluronic acid constituents of normal human vocal folds,”
J. Voice, 11
(1), 59
–66
(1997). http://dx.doi.org/10.1016/S0892-1997(97)80024-0 JOVOEA 0892-1997 Google Scholar
J. A. Burnset al.,
“Real-time tracking of vocal fold injections with optical coherence tomography,”
Laryngoscope, 119
(11), 2182
–2186
(2009). http://dx.doi.org/10.1002/lary.v119:11 LARYA8 0023-852X Google Scholar
C. L. Hoyet al.,
“Towards endoscopic ultrafast laser microsurgery of vocal folds,”
J. Biomed. Opt., 17
(3), 038002
(2012). http://dx.doi.org/10.1117/1.JBO.17.3.038002 JBOPFO 1083-3668 Google Scholar
A. Vogelet al.,
“Mechanisms of femtosecond laser nanosurgery of cells and tissues,”
Appl. Phys. B Lasers Opt., 81
(8), 1015
–1047
(2005). http://dx.doi.org/10.1007/s00340-005-2036-6 APBOEM 0946-2171 Google Scholar
A. P. Joglekaret al.,
“Optics at critical intensity: applications to nanomorphing,”
Proc. Natl. Acad. Sci. U. S. A., 101
(16), 5856
–5861
(2004). http://dx.doi.org/10.1073/pnas.0307470101 PNASA6 0027-8424 Google Scholar
F. BourgeoisA. Ben-Yakar,
“Femtosecond laser nanoaxotomy properties and their effect on axonal recovery in C-elegans,”
Opt. Express, 15
(14), 8521
–8531
(2007). http://dx.doi.org/10.1364/OE.15.008521 OPEXFF 1094-4087 Google Scholar
A. Ben-YakarF. Bourgeois,
“Ultrafast laser nanosurgery in microfluidics for genome-wide screenings,”
Curr. Opin. Biotechnol., 20
(1), 100
–105
(2009). http://dx.doi.org/10.1016/j.copbio.2009.01.008 CUOBE3 0958-1669 Google Scholar
A. VogelV. Venugopalan,
“Mechanisms of pulsed laser ablation of biological tissues (vol 103, pg 577, 2003),”
Chem. Rev., 103
(5), 2079
–2079
(2003). http://dx.doi.org/10.1021/cr030683b CHREAY 0009-2665 Google Scholar
A. Vogelet al.,
“Energy balance of optical breakdown in water at nanosecond to femtosecond time scales,”
Appl. Phys. B Lasers Opt., 68
(2), 271
–280
(1999). http://dx.doi.org/10.1007/s003400050617 APBOEM 0946-2171 Google Scholar
A. Vogelet al.,
“Plasma formation in water by picosecond and nanosecond Nd:YAC laser pulses. 1. Optical breakdown at threshold and superthreshold irradiance,”
IEEE J. Sel. Top. Quant. Electron., 2
(4), 847
–860
(1996). http://dx.doi.org/10.1109/2944.577307 IJSQEN 1077-260X Google Scholar
J. NoackA. Vogel,
“Laser-induced plasma formation in water at nanosecond to femtosecond time scales: calculation of thresholds, absorption coefficients, and energy density,”
IEEE J. Quant. Electron., 35
(8), 1156
–1167
(1999). http://dx.doi.org/10.1109/3.777215 IEJQA7 0018-9197 Google Scholar
A. A. Oraevskyet al.,
“Plasma mediated ablation of biological tissues with nanosecond-to-femtosecond laser pulses: relative role of linear and nonlinear absorption,”
IEEE J. Sel. Top. Quant. Electron., 2
(4), 801
–809
(1996). http://dx.doi.org/10.1109/2944.577302 IJSQEN 1077-260X Google Scholar
H. Wiswehet al.,
“Optical coherence tomography monitoring of vocal fold femtosecond laser microsurgery,”
Proc. SPIE, 6632 63207
(2007). http://dx.doi.org/10.1117/12.728139 PSISDG 0277-786X Google Scholar
W. R. ZipfelR. M. WilliamsW. W. Webb,
“Nonlinear magic: multiphoton microscopy in the biosciences,”
Nat. Biotechnol., 21
(11), 1368
–1376
(2003). http://dx.doi.org/10.1038/nbt899 NABIF9 1087-0156 Google Scholar
P. J. Campagnolaet al.,
“Three-dimensional high-resolution second-harmonic generation imaging of endogenous structural proteins in biological tissues,”
Biophys. J., 82
(1), 493
–508
(2002). http://dx.doi.org/10.1016/S0006-3495(02)75414-3 BIOJAU 0006-3495 Google Scholar
W. R. Zipfelet al.,
“Live tissue intrinsic emission microscopy using multiphoton-excited native fluorescence and second harmonic generation,”
Proc. Natl. Acad. Sci. U. S. A., 100
(12), 7075
–7080
(2003). http://dx.doi.org/10.1073/pnas.0832308100 PNASA6 0027-8424 Google Scholar
C. L. Hoyet al.,
“Miniaturized probe for femtosecond laser microsurgery and two-photon imaging,”
Opt. Express, 16
(13), 9996
–10005
(2008). http://dx.doi.org/10.1364/OE.16.009996 OPEXFF 1094-4087 Google Scholar
C. L. Hoyet al.,
“Optical design and imaging performance testing of a 9.6-mm diameter femtosecond laser microsurgery probe,”
Opt. Express, 19
(11), 10536
–10552
(2011). http://dx.doi.org/10.1364/OE.19.010536 OPEXFF 1094-4087 Google Scholar
C. Y. DongK. KoenigP. So,
“Characterizing point spread functions of two-photon fluorescence microscopy in turbid medium,”
J. Biomed. Opt., 8
(3), 450
–459
(2003). http://dx.doi.org/10.1117/1.1578644 JBOPFO 1083-3668 Google Scholar
A. K. Dunnet al.,
“Influence of optical properties on two-photon fluorescence imaging in turbid samples,”
Appl. Opt., 39
(7), 1194
–1201
(2000). http://dx.doi.org/10.1364/AO.39.001194 APOPAI 0003-6935 Google Scholar
N. J. Durret al.,
“Maximum imaging depth of two-photon autofluorescence microscopy in epithelial tissues,”
J. Biomed. Opt., 16
(2), 026008
(2011). http://dx.doi.org/10.1117/1.3548646 JBOPFO 1083-3668 Google Scholar
M. S. Hahnet al.,
“Quantitative and comparative studies of the vocal fold extracellular matrix II: collagen,”
Ann. Otol. Rhinol. Laryngol., 115
(3), 225
–232
(2006). AORHA2 0003-4894 Google Scholar
M. S. Hahnet al.,
“Midmembranous vocal fold lamina propria proteoglycans across selected species,”
Ann. Otol. Rhinol. Laryngol., 114
(6), 451
–462
(2005). AORHA2 0003-4894 Google Scholar
M. S. Hahnet al.,
“Quantitative and comparative studies of the vocal fold extracellular matrix. I: elastic fibers and hyaluronic acid,”
Ann. Otol. Rhinol. Laryngol., 115
(2), 156
–164
(2006). AORHA2 0003-4894 Google Scholar
F. H. WhiteK. GohariC. J. Smith,
“Histological and ultrastructural morphology of 7,12 dimethylbenz(alpha)-anthracene carcinogenesis in hamster-cheek pouch epithelium,”
Diagn. Histopathol., 4
(4), 307
–333
(1981). DIHIDH 0272-7749 Google Scholar
J. Adamset al.,
“Acid/pepsin promotion of carcinogenesis in the hamster cheek pouch,”
Arch. Otolaryngol. Head Neck Surg., 126
(3), 405
–409
(2000). http://dx.doi.org/10.1001/archotol.126.3.405 AONSEJ 0886-4470 Google Scholar
E. Valraktariset al.,
“The hamster model of sequential oral oncogenesis,”
Oral Oncol., 44
(4), 315
–324
(2008). http://dx.doi.org/10.1016/j.oraloncology.2007.08.015 EJCCER 1368-8375 Google Scholar
J. S. Kingsburyet al.,
“Photodynamic therapy for premalignant lesions in DMBA-treated hamsters: a preliminary study,”
J. Oral Maxillofac. Surg., 55
(4), 376
–381
(1997). http://dx.doi.org/10.1016/S0278-2391(97)90130-0 JOMSDA 0278-2391 Google Scholar
M. Driveret al.,
“Laser-assisted low-dose retinoic acid in oral cancer chemoprevention,”
Laryngoscope, 115
(2), 283
–286
(2005). http://dx.doi.org/10.1097/01.mlg.0000154734.54152.9a LARYA8 0023-852X Google Scholar
J. D. Meieret al.,
“Treatment with 1-alpha,25-dihydroxyvitamin D3 (vitamin D3) to inhibit carcinogenesis in the hamster buccal pouch model,”
Arch. Otolaryngol. Head Neck Surg., 133
(11), 1149
–1152
(2007). http://dx.doi.org/10.1001/archotol.133.11.1149 AONSEJ 0886-4470 Google Scholar
F. AlipouraS. Jaiswal,
“Phonatory characteristics of excised pig, sheep, and cow larynges,”
J. Acoust. Soc. Am., 123
(6), 4572
–4581
(2008). http://dx.doi.org/10.1121/1.2908289 JASMAN 0001-4966 Google Scholar
W. Garvey,
“Modified elastic tissue—Masson Trichrome stain,”
Stain Technol., 59
(4), 213
–216
(1984). STTEAW 0038-9153 Google Scholar
A. ZoumiA. YehB. J. Tromberg,
“Imaging cells and extracellular matrix in vivo by using second-harmonic generation and two-photon excited fluorescence,”
Proc. Natl. Acad. Sci. U. S. A., 99
(17), 11014
–11019
(2002). http://dx.doi.org/10.1073/pnas.172368799 PNASA6 0027-8424 Google Scholar
M. J. Koehleret al.,
“In vivo assessment of human skin aging by multiphoton laser scanning tomography,”
Opt. Lett., 31
(19), 2879
–2881
(2006). http://dx.doi.org/10.1364/OL.31.002879 OPLEDP 0146-9592 Google Scholar
J. X. Chenet al.,
“Spectroscopic characterization and microscopic imaging of extracted and in situ cutaneous collagen and elastic tissue components under two-photon excitation,”
Skin Res. Technol., 15
(4), 418
–426
(2009). http://dx.doi.org/10.1111/srt.2009.15.issue-4 0909-752X Google Scholar
B. Rousseauet al.,
“Characterization of chronic vocal fold scarring in a rabbit model,”
J. Voice, 18
(1), 116
–124
(2004). http://dx.doi.org/10.1016/j.jvoice.2003.06.001 JOVOEA 0892-1997 Google Scholar
A. N. Bashkatovet al.,
“Optical properties of human skin, subcutaneous and mucous tissues in the wavelength range from 400 to 2000 nm,”
J. Phys. D Appl. Phys., 38
(15), 2543
–2555
(2005). http://dx.doi.org/10.1088/0022-3727/38/15/004 JPAPBE 0022-3727 Google Scholar
R. M. P. Doornboset al.,
“The determination of in vivo human tissue optical properties and absolute chromophore concentrations using spatially resolved steady-state diffuse reflectance spectroscopy,”
Phys. Med. Biol., 44
(4), 967
–981
(1999). http://dx.doi.org/10.1088/0031-9155/44/4/012 PHMBA7 0031-9155 Google Scholar
N. Shen,
“Photodisruption in biological tissues using femtosecond laser pulses,”
125 Harvard University,
(2003). Google Scholar
E. TalD. OronY. Silberberg,
“Improved depth resolution in video-rate line-scanning multiphoton microscopy using temporal focusing,”
Opt. Lett., 30
(13), 1686
–1688
(2005). http://dx.doi.org/10.1364/OL.30.001686 OPLEDP 0146-9592 Google Scholar
G. H. Zhuet al.,
“Simultaneous spatial and temporal focusing of femtosecond pulses,”
Opt. Express, 13
(6), 2153
–2159
(2005). http://dx.doi.org/10.1364/OPEX.13.002153 OPEXFF 1094-4087 Google Scholar
D. N. Viteket al.,
“Temporally focused femtosecond laser pulses for low numerical aperture micromachining through optically transparent materials,”
Opt. Express, 18
(17), 18086
–18094
(2010). http://dx.doi.org/10.1364/OE.18.018086 OPEXFF 1094-4087 Google Scholar
H. WolinskyS. Glagov,
“Structural basis for the static mechanical properties of the aortic media,”
Circ. Res., 14 400
–413
(1964). http://dx.doi.org/10.1161/01.RES.14.5.400 CIRUAL 0009-7330 Google Scholar
S. L. Thibeaultet al.,
“Histologic and rheologic characterization of vocal fold scarring,”
J. Voice, 16
(1), 96
–104
(2002). http://dx.doi.org/10.1016/S0892-1997(02)00078-4 JOVOEA 0892-1997 Google Scholar
B. A. Roederet al.,
“Tensile mechanical properties of three-dimensional type I collagen extracellular matrices with varied microstructure,”
J. Biomech. Eng., 124
(2), 214
–222
(2002). http://dx.doi.org/10.1115/1.1449904 JBENDY 0148-0731 Google Scholar
C. J. Doillonet al.,
“Collagen fiber formation in repair tissue: development of strength and toughness,”
Coll. Relat. Res., 5
(6), 481
–492
(1985). http://dx.doi.org/10.1016/S0174-173X(85)80002-9 CREXDV 0174-173X Google Scholar
P. Martin,
“Wound healing—aiming for perfect skin regeneration,”
Science, 276
(5309), 75
–81
(1997). http://dx.doi.org/10.1126/science.276.5309.75 SCIEAS 0036-8075 Google Scholar
J. T. WalshT. F. Deutsch,
“Pulsed -laser ablation of tissue—effect of mechanical-properties,”
IEEE Trans. Biomed. Eng., 36
(12), 1195
–1201
(1989). http://dx.doi.org/10.1109/10.42114 IEBEAX 0018-9294 Google Scholar
S. S. Karajanagiet al.,
“Assessment of canine vocal fold function after injection of a new biomaterial designed to treat phonatory mucosal scarring,”
Ann. Otol. Rhinol. Laryngol., 120
(3), 175
–184
(2011). AORHA2 0003-4894 Google Scholar
G. Woodson,
“Developing a porcine model for study of vocal fold scar,”
J. Voice, 26
(6), 706
–710
(2012). http://dx.doi.org/10.1016/j.jvoice.2012.03.003 JOVOEA 0892-1997 Google Scholar
C. L. Hoyet al.,
“Clinical ultrafast laser surgery: recent advances and future directions,”
J. Sel. Top. Quant. Electron., 20
(2),
(2014). IJSQEN 1077-260X Google Scholar
|