
|
|
1.IntroductionAugmentation of rehabilitation with concurrent cortical stimulation is a valuable approach for facilitating plasticity in the injured human brain to improve physical performance. This method may be especially beneficial to patients following stroke, as persistant deficits in the affected limb lessen the quality of life.1 Stimulation of the cortex with transcranial magnetic stimulation (TMS), transcranial direct current stimulation (tDCS), and epidural cortical stimulation, results in beneficial neuroplasticity by modulating the excitability of the underlying neural circuitry. Contingent on the cortical location, stimulation can lead to improvements in speech,2 motor control,3–9 pain,10 depression,11 neglect,12 and the reduction of sensory deficit13,14 in patients with various brain disorders. Recently, tDCS has attracted increased interest due to its sustained effects, which last up to a week15 and have beneficial therapeutic outcomes for stroke patients.3,7,9–12 TDCS is a noninvasive cortical stimulation technique which modulates the cortical activity with intensities below the motor threshold.16 Depending on the current polarity, tDCS can either excite or suppress the underlying cortical regions17,18 similar to TMS, though with less topographical specificity than TMS.19 However, advantages of using tDCS over TMS include the ability to stimulate during a motor task even if it involves head or torso movements, low cost, and excellent tolerability. Previous studies20,21 show that tDCS stimulation during an activity modulates the neural circuitry specific to that task, which potentially gives tDCS the ability to have task-specific effects and thus direct neuroplasticity in the desired direction of a physical therapy regimen. tDCS applied bi-hemispherically, such that one hemisphere is suppressed (cathode) and the other hemisphere is excited (anode) concurrently,22 can simultaneously suppress the unaffected (i.e., healthy) hemisphere and excite the affected (i.e., injured) hemisphere of stroke patients to improve motor performance by normalizing laterality of cortical activity.23 Furthermore, bi-hemispheric tDCS applied on healthy adults resulted in a larger increase in motor improvement compared to when the same hemisphere underwent only unilateral anodal tDCS.24 However, to our knowledge, studies have only applied bi-hemispheric tDCS in one current direction, and have not yet compared the cortical or performance effects of bi-hemispheric tDCS when the anode is placed over the hemisphere ipsilateral to the affected limb. In order to better understand the effects of tDCS on the plasticity of the human cortex, neuroimaging techniques have been recently combined with this stimulation method. Functional magnetic resonance imaging (fMRI) after tDCS showed neuroplastic resting-state connectivity changes in the sensorimotor cortical regions.25–28 Additionally, changes in resting-state cortical regional cerebral blood flow were measured after tDCS by positron emission tomography,28 but only a few studies have explored the effects of tDCS during cortical activation.28–31 One study used fMRI to detect changes in cortical activation hemodynamics in the supplementary motor area (SMA) during anodal tDCS while the subjects performed a finger tapping task,30 but electric current flow confounds concurrent fMRI eco-planar imaging during tDCS.32 Therefore, a technique that is independent of magnetic field measurements is desirable, particularly as continual noninvasive neuroimaging of tDCS-induced plasticity could yield great potential for improving the understanding of functional plasticity and for guiding therapeutic applications. One such portable and low-cost neuroimaging modality is functional near-infrared spectroscopy (fNIRS), previously used to study brain function in healthy subjects33–39 and individuals affected by a wide range of central nervous system pathologies such as stroke, depression, cerebral palsy, and Alzheimer’s disease.40–44 Though this optical technology is limited to cortical imaging at a modest spatial resolution, it can potentially offer high activation-related signal detection sensitivity, high-temporal resolution, and relative robustness to motion artifacts.45–48 fNIRS detects changes in light absorption and scattering in tissue caused by fluctuations in oxy-hemoglobin (HbO) and deoxyhemoglobin (Hb) concentrations secondary to neuronal activity, known as neurovascular coupling.49,50 It has also been shown that fNIRS is able to detect event-related optical signals, which occur within hundreds of milliseconds and correlate with evoked potentials measured by simultaneous electroencephalography (EEG),51,52 are much faster than the seconds resolution of fMRI.53,54 Recently, fNIRS detected changes in resting state HbO after anodal tDCS was applied to the prefrontal cortex,55 though no fNIRS studies to date have explored the effects of tDCS on functional activation patterns in the sensorimotor cortex, which is the focus of this work. In this study, the hemodynamics in sensorimotor cortical regions were measured using fNIRS before, during, and after bi-hemispheric tDCS was applied to the sensorimotor cortex of eight healthy adults. The use of fNIRS enabled quantification of changes in both resting-state connectivity and functional activity of cortical regions activated during a wrist flexion task, during and after tDCS. The isometric wrist flexion task was performed while subjects held a lever outfitted with sensors to measure the torque, allowing quantification of the speed, and accuracy of task performance in relation to cortical activity. Moreover, during this event-related protocol, changes in the activity of the forearm and upper arm muscles, measured by surface electromyography (sEMG) concurrent with fNIRS, yielded complementary information on how the activation of specific muscles related to changes in cortical activation patterns elicited by wrist flexion. The results of this work indicate how the novel combined use of tDCS, fNIRS, sEMG, and task performance measurements can offer insights into how cortical plasticity influences task performance during and after intervention with tDCS. These methods could be used in future studies to guide the patient-specific rehabilitation of hemiparetic patients during tDCS-enhanced physical therapy. 2.Materials and Methods2.1.SubjectsNine right-handed subjects were included in this study. Subject handedness was determined by the Edinburgh Handedness Inventory.56 All subjects were healthy and did not have a history of neurological disorders other than headaches. A side effect that occurs during the ramp up and down of current for tDCS in a small percentage of human subjects is the visual perception of flashing lights.57 One subject did not return due to flashing lights seen in the first tDCS session during the ramp up of current and this subject’s data was not included in the analysis. Data analysis was performed on the remaining eight subjects (two female and six male; years old). The studies were performed under the approval of the University of Texas at Arlington Institutional Review Board protocol (IRB No. 2012-0356). 2.2.Imaging with fNIRS and tDCS SetupA continuous wave fNIRS brain imager (CW-6, Techen Inc., Milford, MA) was used to map the HbO changes induced by sensorimotor cortex activity before, during, and after bi-hemispheric tDCS. The fNIRS source-detector geometry is shown in Fig. 1(a). Sixteen detectors [Fig. 1(a), light blue X’s] were placed over each hemisphere to cover a relatively large area of the sensorimotor cortex. The rows of sources [Fig. 1(a), dark blue circles] and detectors were centered around the Cz position of the EEG International system58 and attached onto the subjects’ heads by perforated Velcro straps. Sixteen laser sources emitted at 690 nm and 16 at 830 nm, such that each optical fiber bundle delivered light of both wavelengths at each source location simultaneously. Each source bundle had up to six detectors within a 3-cm distance and each detector received signals from up to three source bundles. Additionally, eight short (1.5 cm) source detector separations measured the hemodynamic fluctuations in the scalp to adaptively filter the global background hemodynamics unrelated to the activation-related hemodynamic response (details in Sec. 2.5 below). As a result, there were 84 possible source-detector channel combinations for each wavelength. All source-detector pairs simultaneously monitored activation in cortical areas within the probes’ field of view (), as the CW-6 system enables all laser sources to be on at the same time with distinct modulation frequencies (6.4 to 12.6 kHz, with an increment of 200 Hz). Back-reflected light was sampled at a rate of 25 Hz. Fig. 1(a) This image shows the fNIRS sources (dark blue filled circles), detectors (light blue filled X’s), and the tDCS electrodes overlaid (dashed squares) on a model brain. The ellipses identify different sensorimotor cortical regions on both the ipsilateral or left (L) and contralateral or right (R) hemispheres over which fNIRS and tDCS take place, such as the supplementary motor area (SMA), premotor cortex (PMC), primary motor cortex (M1), primary sensory cortex (S1), and posterior parietal cortex (PPC). To confirm the approximate locations of these cortical areas without performing fMRI, fNIRS image group analysis was performed for the eight subjects undergoing sensory stimulation of the left hand (b), and performing left hand finger tapping (c), and left hand sequential tapping (d). Here and throughout the paper, right hemisphere is displayed on the right, left hemisphere on the left as if looking down at the head.  The approximate anterior-posterior functional-anatomical location of the premotor cortex (PMC), SMA, primary motor (M1), and primary sensory (S1) cortical regions in each subject was determined by comparing previously reported MRI and fMRI studies activation locations35,59–61 with fNIRS results from the eight subjects in this study obtained during left hand sensory stimulation, finger tapping, and sequential finger tapping protocols (Sec. 2.4). These protocols were the same as those used in a previous fNIRS study.62 These measurements were performed once on a separate fNIRS session. Additionally, the EEG International system58 Cz, C3, and C4 anatomical measurements made at each fNIRS session were sufficient for locating the major sensorimotor cortex areas for each subject in subsequent tDCS sessions. The error in the probe and electrode placement was estimated by the variation of the measured Cz, C3, and C4 positions at the three fNIRS measurement sessions which did not exceed . In comparison to vibrotactile stimulation of individual fingers, which results in unilateral activation of the contralateral (right) hemisphere,34,59 sensory stimulation of multiple fingers resulted in bilateral S1 activity [Fig. 1(b)] as was found in a previous study.60 Also, in agreement with prior studies, finger tapping elicited activation in the contralateral (right) hemisphere PMC, M1, and S1 cortical regions [Fig. 1(c)],35 and sequential finger tapping activated the contralateral hemisphere M1 and S1, and bilateral PMC cortical regions [Fig. 1(d)].61 After the placement of fNIRS optodes was completed, tDCS current was applied by a battery-driven electrical stimulator (Phoresor II, IOMED Inc., Salt Lake City, UT) connected by a pair of saline-soaked gauze covered gel electrodes (; IOMED Inc., Salt Lake City, Utah) centered over the C3 and C4 positions according to the EEG International system [dashed boxes in Fig. 1]58 that cover the bilateral M1.63 In order to accommodate the placement of fNIRS sources and detectors within the area covered by the tDCS electrodes, two 0.5-cm diameter holes (standard hole punch size) were made on opposing sides of each electrode so that the optical fiber bundles could fit through them. 2.3.sEMG and Torque Measurement SetupIsometric contractions of the forearm and upper arm muscles were measured by sEMG (Brain Vision LLC, Morrisville, NC). After abrading and cleaning the skin, a ground electrode was positioned on the left lateral epicondyle and bipolar surface electrodes with a center-to-center inter-electrode distance of 4 cm on both arms of the subjects over the wrist flexor (WF, flexor carpi radialis muscle), wrist extensor (WE, extensor carpi radialis muscle), biceps brachii, and triceps brachii muscles of both arms, measuring the muscle activity at a sampling rate of 500 Hz (Fig. 2). A custom hand device (JR3 Inc., 35-E15A, Woodland, CA) measured the isometric moments exerted by test subjects on a static Delrin® handle (Fig. 2).64 Forces and moments exerted during fNIRS were monitored in real time, continuous in nature, and scaled linearly with exertion level. The torque measurements were first low-pass filtered at 50 Hz before being sampled at 1000 Hz. Six padded adjustable bumpers stabilized the forearm during testing, adjusted to accommodate forearms, and guaranteed consistent positioning of the forearm. The hand device, connected to both the protocol display laptop and sEMG box, received the stimulus time points from the laptop, and sent a trigger (T in Fig. 2) to the sEMG box allowing the hand device and sEMG signals to be measured on a common time base. Fig. 2This figure is a cartoon representation of the overall instrumentation setup. The protocol display showed the presentation the subjects were to follow and recorded the torque measurements from the hand device. A trigger (T) was sent from the hand device to the sEMG box which identified the beginning of the task stimulus separately in both data sets. There are eight sEMG measurements detecting the muscle activity of both arms (dashed lines from arms to sEMG box). Additionally, the box over the person’s head represents the placement of optical fiber bundles and tDCS electrodes described in Sec. 2.2. Like the force and sEMG measurements, the channel fNIRS data were recorded on a separate laptop. 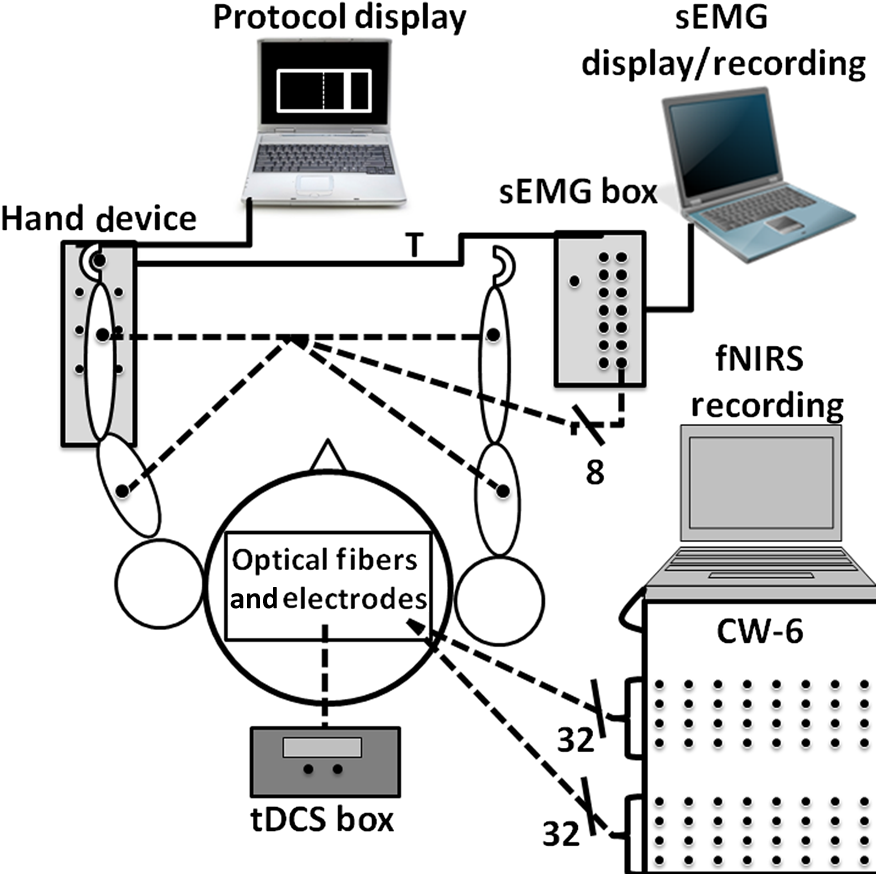 2.4.ProtocolEach subject was comfortably seated up-right after instrumentation setup. During the entire experimental session, the room was quiet and subjects were asked to avoid extra movements. Before measurements, each subject performed isometric wrist flexion task with the maximum effort using their nondominant (left for all subjects) hand three times. The nondominant arm is used in this study since a prior tDCS study found no significant changes in hand performance in the dominant hand, but significant improvement in the nondominant hand after anodal tDCS.65 The torque measurements were normalized to the subject’s mean maximum isometric wrist flexion contraction force, and expressed as a percentage of maximum torque to standardize strength and function effort across subjects. The computer interface guiding subjects (Fig. 2) were user-friendly, consisting of a target that was centered at 50% of the subject’s maximum torque, with a target width of 2.5% of the maximum torque, and a cursor that responded to isometric wrist torques. Previous use of this hand device found that the 2.5% target width produced detectable changes in subject performance during tDCS.64 The goal of the subject was to move the cursor into the target and hold it there for 1 s. The protocol presentation on the computer interface started with 10 s of rest, followed by nine sets of the isometric wrist flexion task, and ended with 10 s of rest. The nine sets of the isometric wrist flexion task were set at 50% of the maximum torque. The inter-stimulus interval varied randomly between 16 and 40 s, allowing enough rest time for cortical hemodynamics to return to baseline. In total, the protocol presentation for each condition lasted 5 min and 8 s. For each visit, the measurements were split into three separate blocks: before, during, and after tDCS (black boxes in Fig. 3). Within each block, there were two separate conditions. The first condition within each block was a rest condition (green boxes in Fig. 4), where each subject sat still throughout the presentation while tracking the visual target. The second condition of each block had the subject perform a set of isometric wrist flexion tasks (red boxes in Fig. 4). In the second block, tDCS (constant current of 2 mA, 15 min) current was ramped up and down gradually over 30 s to minimize sensory and visual effects at the beginning and end of the stimulation. In the rest condition measurement during tDCS (second block, first measurement), current was not applied until after 2 min into the presentation. This permitted us to measure the changes in the hemodynamics, in real time and to our knowledge for the first time, during the ramp-up phase of tDCS. In between the second and third blocks of measurements, subjects rested for 25 min to avoid fatigue and study the aftereffects of tDCS on cortical hemodynamics. After every block of measurements, subjects were asked about their pain on a scale between 0 and 10, and about their fatigue, perceived task effort, and perceived task complexity66 on a Likert-type scale of 1 to 767,68 using visual analog scales. In between measurement blocks, the scores in pain, fatigue, perceived effort, and complexity did not significantly increase (). Thus any cortical hemodynamic changes were mainly due to either the applied tDCS or the isometric wrist flexion task, and not due to pain, fatigue, or task difficulty. Subjects performed the sessions of anode to ipsilateral (left) M1 and cathode to contralateral (right) M1 (presumed inhibitory montage), and cathode to ipsilateral (left) M1 and anode to contralateral (right) M1 (presumed excitatory montage), at least 1 week apart in random order. The polarity of the stimulation was not known to the subjects; however, the investigator was not blinded to the assignment. The minimum 1-week interval permitted enough time between tDCS visits for the hemodynamics to return to their original baseline.69 Fig. 3The protocol timeline: green boxes indicate rest periods, red boxes indicate wrist-flexion task periods, and the black boxes indicate the time periods before, during, and after tDCS, respectively.  Fig. 4(a) The reaction time, indicated by an arrow, is calculated by the time difference between the stimulus presentation (green lines) and the intercept of the linear regression (red line) of the RMS signal (black line) and the mean rest condition RMS signal (blue line) from the left WF muscle. (b) This figure presents the torque data for a single block during a 50% of the maximum torque. The cursor displacement as torque was applied during the task is represented by the yellow line as it was aimed into the target which was centered at 50% of the maximum torque (dashed white line) with a width of 2.5% of the maximum torque (two top solid white lines). The data used for the analysis in this study were above a baseline cut-off represented by the bottom, solid white line. Additionally, the peaks and dips are shown by red circles and green diamonds respectively, as these were used to calculate the error variance metric. Moreover, the initial speed () was calculated between the baseline cut-off and the first peak () as indicated by the two white dashes.  2.5.fNIRS Signal Filtering and Image AnalysisIn addition to detecting evoked hemodynamic changes, fNIRS is sensitive to cerebral hemodynamic fluctuations of systemic origin caused by cardiac pulsation, respiration, and Mayer waves.36,70 This study used a combination of band-pass filtering, adaptive filtering, and component analysis to filter the fNIRS signals as we have previously done.71 Because Hb dynamics are highly correlated with those of HbO34 but with lower amplitudes and are susceptible to cross-talk from HbO72 and interference from physiological artifacts, we have focused on the analysis of HbO dynamics only. After each resting measurement, the changes in HbO for the succeeding activation measurements were determined in reference to a baseline value which was taken to be the average from the last minute of the preceding resting-state measurement. In the case of the activation measurements during tDCS, the last minute of the resting-state measurement was steady at a new baseline level. Thus, HbO changes due to isometric wrist flexion task during and after tDCS were in reference to the new baseline levels instead of the levels found before tDCS. Reconstruction and visualization of fNIRS activation images resulting from the acquired reflectance data were performed by the open-source HomER software implemented in MATLAB73 by the use of the Tikhonov perturbation solution to the photon diffusion equation, which employ a regularized Moore–Penrose inversion scheme.74,75 The reconstructed, two-dimensional images () for every 0.04-s time interval represented maps of changes in HbO on the cortical surface, within the detector’s field of view (Fig. 1). Regions of activation were determined by a general linear model and the -test similar to previous fNIRS studies.62,76,77 With the application of Bonferroni’s correction for multiple comparisons,78 a pixel with was considered to have significant cortical activity relative to background fluctuations to create HbO activation images from the calculated activation amplitudes for each pixel. Afterward, pixel locations significantly active before, during, or after tDCS were used to compute a synchronization likelihood (SL) metric for the resting-state connectivity analysis,79 previously used in EEG and fMRI resting-state connectivity analysis,29,80,81 but to our knowledge not used for fNIRS. In order to show the connectivity between cortical areas, pixels were grouped into their respective cortical regions as identified by fNIRS functional mapping with the sensory, finger tapping, or sequential tapping tasks (Fig. 1). The group averaged time series for each cortical region determined connectivity between sensorimotor cortical areas. Having number of cortical regions where , the SL metric was first computed by converting each cortical region’s baseline time series into a matrix in which the columns were the time delayed time series obtained using time delay embedding,79 where is the length of each time series, is the time lag, is the embedding dimension, and represented the starting sample point of the series where as shown below SL is a symmetric measure of the strength of synchronization between the baseline time series of two cortical regions. Comparing two different cortical region’s matrices and , the SL is the conditional likelihood that the distance between and is smaller than a cut-off distance , given that the distance between and is smaller than a cut-off distance . In practice, the cut-off distances are chosen such that the likelihood of random vectors being close is fixed at , which is assumed to be invariable for and . In this study, , , and were set at 0.05 as was done in previous studies.29,80,81 In Eq. (2), the SL is calculated by averaging over all time points and time delayed vectors in each matrix where the operator represents the Euclidean distance between the vectors, is the number of vectors, is the Theiler correction for autocorrelation,79 and is the Heaviside function: if and if . From Eq. (2), it can be seen that in the case of complete synchronization , for complete independence , and for intermediate levels of synchronization . Cortical regions were considered functionally connected if , as was done in previous studies29,80,81 In comparison to the normalized cross-correlation connectivity analysis that requires multiple seeds to compare the connectivity of multiple cortical regions, the SL metric is able to calculate connectivity between multiple regions without the need of a seed. Importantly, normalized cross-correlations connectivity maps usually present the entire range of correlation values.82 However, the connectivity maps using the SL metric only include those connections with a correlation coefficient above 0.8.29,80,81 Therefore in maps of the SL metric weaker inter-hemispheric connections are not displayed, in contrast to what is shown in studies using the normalized cross-correlation metric. 2.6.sEMG Signal AnalysisThe analysis in this study focused on the blocks when the subjects were performing the wrist-flexion task of the left arm (Fig. 3). Mirror movements were not observed in the right arm, and proximal muscle activation was minimal in the biceps and triceps muscles of the target left arm during the wrist flexion task. SEMG signals were band-pass filtered between 20 and 200 Hz, full-wave rectified and low-pass filtered at 6 Hz giving a linear envelope of the muscle activity. Using cross-correlation analysis, insignificant () cross-talk83 was found between sEMG signals at different muscle groups. The area under each curve (AUC) was used as a metric to compare the muscle activity before, during, and after tDCS. Additionally, the root mean square (RMS), using a 20 ms moving window of the full-wave rectified left WF sEMG signal, was used to calculate the reaction time. The reaction time was obtained by calculating the difference between the stimulus presentation time and the intersection of the time varying mean value of the resting RMS and the linear regression of the RMS signal indicated by an arrow in Fig. 4(a).83 The time interval between the stimulus and the time of the first peak in the torque data (defined in Sec. 2.7.1) was used for the linear regression as it was the first muscle contraction after the stimulus point before any relaxation. This method of calculating the reaction time is robust to changes in noise between conditions, as increased noise could make the reaction time look spuriously delayed.83 2.7.Torque Task Performance MetricsWe identified task performance metrics (initial speed and accuracy, as defined below) from the torque data collected by the hand device before, during, and after tDCS. The mean () and standard deviation () of the baseline signal were calculated from the initial 10 s of rest at the beginning of the protocol. For the quantification of subject performance metrics, cursor displacement data were only included if the magnitudes of these displacements were three standard deviations above the mean value of baseline fluctuations. The baseline fluctuations occurred during the rest periods as identified by the torque and sEMG data. 2.7.1.Initial speedTo show differences in the speed in which each subject moved the cursor when applying their initial torque on the hand device, the initial speed of the cursor motion was calculated for each task block as the average slope of cursor displacement [ in Fig. 4(b)] between the time the cursor was first above baseline fluctuations [bottom solid white line in Fig. 4(b)] and the first peak [ in Fig. 4(b)]. Peaks in the torque data were determined by the “findpeaks” function available in the Signal Processing Toolbox of MATLAB R2012a. The initial speed was defined by Eq. (3) where is the initial speed, is the value of the first peak that was above the baseline, is the time at which the torque reached 10% of the displacement between the baseline threshold and [bottom white dash in Fig. 4(b)], and is the time at which the torque reached 90% of the displacement between the baseline threshold and [top white dash in Fig. 4(b)] 2.7.2.AccuracyIn addition to initial speed, the stability needed to bring the cursor into the narrow target window and keep it there for 1 s was also measured by an error variance metric. The error variance was calculated as the standard deviation of all the peaks [red circles in Fig. 4(b)] and dips [green diamonds in Fig. 4(b)] above the baseline fluctuations [bottom solid white line in Fig. 4(b)], as indicated by the white double arrow in Fig. 4(b). An increase in accuracy was identified by a decrease in the error variance metric. 2.8.Statistical AnalysisA two-way repeated measures analysis of variance test was performed followed by the Tukey post-hoc multiple comparison test, using Prism 6 (GraphPad Software Inc., La Jolla, CA) to see if there was a significant difference () in the mean AUC and reaction time of the sEMG data, and the torque performance metrics. This analysis was performed separately for each tDCS current polarity. The null hypothesis was defined as a zero change in muscle activity before, during, and after tDCS. The Brown-Forsythe and Bartlett’s tests were also used to see when the variances between groups were found to be significantly different (). Statistical power () was also determined for each statistical test in order to show the subject pool size was adequate for the findings in this study. 3.Results and Discussion3.1.tDCS Effects on Changes in HbO in the Rest ConditionAs the signal in fNIRS active condition is computed as an activation-related change relative to the preceding rest condition as baseline, it was important to first explore the changes in hemodynamics in the rest condition during and after tDCS. Figure 5(a) presents time plots for a representative single subject (subject 5) that demonstrate the initial rapid increase and subsequent new plateau in HbO change after the start of tDCS. The HbO concentration simultaneously increased to a new plateau within of tDCS application in all cortical areas involved, and persisted 25 to 42 min after the end of tDCS. As indicated in Fig. 5(b), the new plateau was found to be significantly larger than the pre-tDCS baseline HbO change (, ) during and after tDCS across all subjects. Baseline HbO changes presented in Fig. 5(b) were independent of the hemisphere where the anode was placed (). For a similar tDCS protocol, a previous study found that the hemodynamics returned to their original level a week after tDCS application.15 To optimize our protocol, the active wrist flexion task did not begin until 3 min after the start of tDCS to minimize large hemodynamic changes induced by the ramp up of current from corrupting the activation-related hemodynamics. Fig. 5(a) This figure presents HbO concentration changes during the rest condition before, during, and after tDCS for a single subject (subject 5) at M1 under the anode. After each resting-state condition, measurements were taken during the isometric wrist flexion task (active) task. The times at which these measurements were taken compared to the onset of tDCS are indicated above their respective resting-state measurements. (b) Additionally, the group average change in the baseline at M1 under the anode, inclusive of both hemispheres, is presented as a bar graph. The asterisk represents a significant () change when compared to before tDCS.  3.2.tDCS Induced Changes in Cortical Activity During an Active Isometric TaskA group analysis of the resting-state connectivity and activation patterns during the active task for all eight subjects was performed and results from before, during, and after tDCS were compared to one another (Fig. 6). Before tDCS, cortical regions were functionally connected intra-hemispherically, including the SMA that was associated with M1 and S1 during the resting state [Fig. 6(a)]. Wrist flexion induced bilateral activation in the SMA and the PMC [Fig. 6(d)], in addition to contralateral (right) M1/S1 activation. These pre-tDCS results were similar to ones previously reported in an fMRI study of subjects performing a similar task.84 During tDCS [Figs. 6(b) and 6(h)], bi-hemispheric stimulation unmasked a direct functional connection between the two hemispheres at the expense of intra-hemispheric connections, for both current polarities, that were not detected prior to stimulation [Figs. 6(a) and 6(g)]. The increase in direct bilateral connectivity was also reflected in the corresponding activation images as bilateral activation of M1 and S1 during the wrist flexion task [Figs. 6(e) and 6(k)]. The increased resting-state variability during tDCS, which caused larger noise fluctuations in the reconstructed images, may have reduced the statistical significance of the group analysis, but in all cases, there was considerably less hemodynamic activation in the vicinity of the cathode compared to the anode. Fig. 6Group analysis of the eight subjects for both the resting-state connectivity and activation images before, during, and after the application of tDCS. The top six (a)–(f) and bottom six (g)–(l) panels are separated by current polarity. The solid red lines connect the cortical areas which were functionally connected, the red dashed squares represent the location of the anode, the black dashed squares represent the cathode, and the semitransparent black ellipses identify the sensorimotor cortical regions previously defined in Fig. 1(a).  Interestingly, the resting-state connectivity and activation patterns once again changed after the rest period following tDCS. Remarkably, the modulated cortical connections differed depending on the applied current polarity. After the cathode was on the hemisphere ipsilateral (left) to wrist flexion [Fig. 6(c)], the connections in that hemisphere decreased, leaving only connections to SMA, while the connections in the hemisphere contralateral (right) to wrist flexion returned to pre-tDCS baseline. The decreased connectivity on the ipsilateral (left) side was coupled with a loss of bilateral activation seen before tDCS. In contrast, the return to normal connectivity in the opposite hemisphere was accompanied with an increased hemispheric activation [Fig. 6(f)]. When the cathode was on the right hemisphere contralateral to wrist flexion, the inter-hemispheric connections persisted 30 min after tDCS [Fig. 6(i)], while bilaterally the SMA was notably disconnected. As expected, this inter-hemispheric connectivity correlated with the bilateral M1 activity, with stronger activation intensity on the stimulated ipsilateral (left) side compared to pre-tDCS values [Fig. 6(l)]. Inter-hemispheric connections are possibly the reason why the ipsilateral (left) hemisphere was easily recruited to compensate for the suppressed contralateral (right) hemisphere. Therefore, these measurements show that tDCS can transiently affect the laterality of sensorimotor regions participating in the control of arm use, even in healthy subjects. The observed dependence of activation on stimulation polarity is in line with the previous bi-hemispheric tDCS study which demonstrated, using TMS, an increase in cortical excitability on the anodal stimulation side and a decrease in the cathodal stimulation side.22 3.3.tDCS Effects on Muscle Activity and Reaction TimeThe application of tDCS also affected muscle activity and reaction time during the wrist flexion task. Bi-hemispheric tDCS with the anode over the contralateral (right) M1 (Fig. 7, left column) only increased the AUC significantly (, ) in both left WF [Figs. 7(a) and 7(c)] and WE [Figs. 7(b) and 7(d)] after the rest period following tDCS. The sensorimotor cortical regions responsible for the left WF and WE muscle groups were likely simultaneously stimulated by the large tDCS electrodes, resulting in increased muscle activity of both agonist/antagonist muscles. Four of the eight subjects presented a significant increase in the left WF activity during tDCS, however, this did not show significance in the group analysis. The reaction time for the flexion task significantly (, ) increased for the entire group during tDCS, but not after the rest period [Fig. 7(e)] during the time of greatest muscle recruitment. Fig. 7The analysis of muscle activity measured by sEMG before, during, and after tDCS for both current polarities. The average time series linear envelope of the sEMG from the left (a) WE and (b) WF for the eight subjects, the statistical analysis of AUC for the left (c) WE and (d) WF, the statistical analysis of the reaction time from the left WF (e) is presented when the anode (red dashed square) was located over the right hemisphere and the cathode (black dashed square) over the left hemisphere. The same is also presented when the electrode positions were switched for the (f) WE and (g) WF average time-series envelope, AUC statistical analysis for the left (h) WE and (i) WF, and the reaction time for the left (j) WF. The asterisk identifies statistical significance ().  In contrast, when placing the cathode over the right hemisphere contralateral to wrist flexion (Fig. 7, right column), only the left WF significantly (, ) increased in activity after the post-tDCS rest period [Figs. 7(f) and 7(h)]. There was no effect on the WE and the reaction time did not significantly change during or after tDCS [Fig. 7(j)]. These results suggest that tDCS not only directs cortical plasticity, but can also affect which of the muscle groups being used have increased activation in a manner dependent on current polarity. Importantly, the biceps were also active during the isometric wrist flexion task; yet, tDCS only significantly affected the left WF and WE muscle groups (data not shown). Additionally, previous studies85,86 suggest that lasting improvements in reaction time may require applying tDCS to planning centers of the brain such as the prefrontal or PMC.85,86 3.4.tDCS Effects on Torque Task PerformanceChanges in the speed of reaching the first peak during wrist flexion are shown as a function of WF and WE muscle activations for the two different bi-hemispheric tDCS current polarities in Fig. 8. Anodal placement over the right hemisphere that was contralateral to wrist flexion [Figs. 8(a) and 8(b)], increased WF activity during tDCS, increasing the initial speed to reach the first peak compared to pre-tDCS values. The increases in WF activation and speed during tDCS were not significant in the group analysis, but increased significantly in the same four subjects mentioned in Sec. 3.3. For the four subjects with increased WF activity, the speed with which the first peak was reached was higher by . The increase in WF and WE activities following tDCS [Figs. 7(c) and 7(d)] decreased the speed to first peak during wrist flexion with statistical significance (, ). Four of the eight subjects presented a significant improvement in accuracy after tDCS. However, this did not show significance in the group analysis. This observed decrease from the initial speed pre-tDCS may result from the fact that WF and WE are antagonistic muscles, pulling against each other and therefore slowing each other, which ultimately may increase motor control leading to better accuracy at the price of decreased speed. Fig. 8Scatter plots for a representative subject’s (subject 3) initial speed in reaching the first peak before (black dots), during (red dots), after (blue dots) tDCS, with correspondingly color coded standard deviations from nine trials, versus the integrated muscle activity (AUC) for the left WE and WF. The polarity of tDCS during these measurements is shown at the top of each figure column. The effect of placing the anode (red dashed square) over the nondominant (right) hemisphere on initial speed is compared to the AUC of the left (a) WE and (b) WF. The same is represented for the left (c) WE and (d) WF when the tDCS electrode placement is switched. Color coded arrows show the direction of statistically significant changes from before-to-during tDCS (black to red) and from during-to-after tDCS (red to blue). Horizontal arrows show the direction of changes in muscle activity and vertical arrows show the direction of changes in task performance speed.  The cathode over the hemisphere contralateral to wrist flexion that increased WF activity after tDCS [Fig. 7(h)] also significantly increased (, ) the speed of wrist flexion [Figs. 8(c) and 8(d)], which was an effect not found during tDCS. Yet, in this case, the WE did not increase in activity after the contralateral hemisphere was suppressed. The unchanged WE activity resulted in a reduced antagonist effect to the excited WF, which in turn resulted in an increased initial speed and no significant change in accuracy. Two previous studies also presented tDCS-induced changes in hand task performance in healthy controls.24,65 In one study, the time it took to perform multiple tasks decreased after uni-hemispheric anodal stimulation,65 while the sequential finger tapping rate increased after uni-hemispheric and bi-hemispheric tDCS.24 In these studies, it was concluded that tDCS may have a stronger effect on speed than on the accuracy, which is similar to what was found in this study. Importantly, unlike previous studies, this work demonstrates how the link between cortical activation and muscle activity can explain observed changes in task performance. Table 1 contains a summary of the cortical activity, muscle activity, and task performance changes as a function of tDCS current polarity. Table 1A summary of the cortical activity, muscle activity, and task performance results of the active condition compared to the rest condition. The asterisks indicate those sEMG and torque performance metrics that were found to be significant over the entire group. Those metrics without an asterisk were found significant for at least four of the eight subjects but were not significant in the group analysis.
4.ConclusionsThis study compared altered hemodynamic patterns in the sensorimotor cortex in response to two possible bi-hemispheric tDCS polarities, and related these changes to concurrently observed muscle group activity and task performance during a wrist flexion task. fNIRS enabled mapping of the resting-state connectivity during tDCS, using an SL metric, which has not been previously studied with this imaging modality. Changes in resting-state connectivity were task- and polarization-specific, and persisted for over 40 min after the end of the stimulation. These results show the effectiveness of bi-hemispheric tDCS to alter inter-hemispheric balance and the laterality of cortical activity, which in turn affects muscle activity, speed, and reaction time in a manner dependant on current polarity. The combination of tDCS, fNIRS, and sEMG with the task performance measurements can become a much-needed multiparametric tool for exploring how cortical plasticity changes muscle control, particularly, during rehabilitative physical therapy interventions. The presented methods could be used in future clinical studies to tailor the stimulation parameters for tDCS-enhanced physical therapy on an individual, per patient basis, which will be significantly beneficial for patients with complex neurological disorders such as stroke or traumatic brain injury. AcknowledgmentsSupport for this work was provided in part by the National Institute of Biomedical Imaging and Bioengineering (NIBIB), Grant No. 1R01EB013313-01 and by the Eunice Kennedy Shriver National Institute of Child Health and Human Development K23 grant, Grant No. 5K23HD050267. ReferencesK. Oneset al.,
“Quality of life for patients poststroke and the factors affecting it,”
J. Stroke Cerebrovasc. Dis., 14
(6), 261
–266
(2005). http://dx.doi.org/10.1016/j.jstrokecerebrovasdis.2005.07.003 1052-3057 Google Scholar
V. Myliuset al.,
“Stroke rehabilitation using noninvasive cortical stimulation: aphasia,”
Expert Rev. Neurother., 12
(8), 973
–982
(2012). http://dx.doi.org/10.1586/ern.12.76 ERNXAR 1473-7175 Google Scholar
D. J. Edwardset al.,
“Raised corticomotor excitability of M1 forearm area following anodal tDCS is sustained during robotic wrist therapy in chronic stroke,”
Restor. Neurol. Neurosci., 27
(3), 199
–207
(2009). RNNEEL 0922-6028 Google Scholar
F. Hummelet al.,
“Effects of non-invasive cortical stimulation on skilled motor function in chronic stroke,”
Brain, 128
(3), 490
–499
(2005). http://dx.doi.org/10.1093/brain/awh369 BRAIAK 0006-8950 Google Scholar
F. HummelL. G. Cohen,
“Improvement of motor function with noninvasive cortical stimulation in a patient with chronic stroke,”
Neurorehabil. Neural Repair, 19
(1), 14
–19
(2005). http://dx.doi.org/10.1177/1545968304272698 1545-9683 Google Scholar
F. C. Hummelet al.,
“Effects of brain polarization on reaction times and pinch force in chronic stroke,”
BMC Neurosci., 7
(73),
(2006). http://dx.doi.org/10.1186/1471-2202-7-73 BNMEA6 1471-2202 Google Scholar
R. Lindenberget al.,
“Bihemispheric brain stimulation facilitates motor recovery in chronic stroke patients,”
Neurology, 75
(24), 2176
–2184
(2010). http://dx.doi.org/10.1212/WNL.0b013e318202013a NEURAI 0028-3878 Google Scholar
J. Tretriluxanaet al.,
“Low frequency repetitive transcranial magnetic stimulation to the non-lesioned hemisphere improves paretic arm reach-to-grasp performance after chronic stroke,”
Disability Rehabil. Assistive Technol., 8
(2), 121
–124
(2012). 1748-3107 Google Scholar
M. Zimermanet al.,
“Modulation of training by single-session transcranial direct current stimulation to the intact motor cortex enhances motor skill acquisition of the paretic hand,”
Stroke, 43
(8), 2185
–2191
(2012). http://dx.doi.org/10.1161/STROKEAHA.111.645382 SJCCA7 0039-2499 Google Scholar
P. S. BoggioS. ZaghiF. Fregni,
“Modulation of emotions associated with images of human pain using anodal transcranial direct current stimulation (tDCS),”
Neuropsychologia, 47
(1), 212
–217
(2009). http://dx.doi.org/10.1016/j.neuropsychologia.2008.07.022 NUPSA6 0028-3932 Google Scholar
D. M. Blumbergeret al.,
“A randomized double-blind sham-controlled study of transcranial direct current stimulation for treatment-resistant major depression,”
Front. Psychiatry, 3
(74),
(2012). http://dx.doi.org/10.3389/fpsyt.2012.00074 1664-0640 Google Scholar
M. H. Koet al.,
“Improvement of visual scanning after DC brain polarization of parietal cortex in stroke patients with spatial neglect,”
Neurosci. Lett., 448
(2), 171
–174
(2008). http://dx.doi.org/10.1016/j.neulet.2008.10.050 NELED5 0304-3940 Google Scholar
P. Ragertet al.,
“Improvement of spatial tactile acuity by transcranial direct current stimulation,”
Clin. Neurophysiol., 119
(4), 805
–811
(2008). http://dx.doi.org/10.1016/j.clinph.2007.12.001 CNEUFU 1388-2457 Google Scholar
S. SongM. SandriniL. G. Cohen,
“Modifying somatosensory processing with non-invasive brain stimulation,”
Restor. Neurol. Neurosci., 29
(6), 427
–437
(2011). RNNEEL 0922-6028 Google Scholar
L. J. BindmanO. C. LippoldJ. W. Redfearn,
“Long-lasting changes in the level of the electrical activity of the cerebral cortex produced bypolarizing currents,”
Nature, 196 584
–585
(1962). http://dx.doi.org/10.1038/196584a0 NATUASNATUAS 0028-0836 Google Scholar
M. A. Nitscheet al.,
“Modulating parameters of excitability during and after transcranial direct current stimulation of the human motor cortex,”
J. Physiol., 568
(1), 291
–303
(2005). http://dx.doi.org/10.1113/jphysiol.2005.092429 JPHYA7 0022-3751 Google Scholar
M. A. NitscheW. Paulus,
“Excitability changes induced in the human motor cortex by weak transcranial direct current stimulation,”
J. Physiol., 527
(3), 633
–639
(2000). http://dx.doi.org/10.1111/tjp.2000.527.issue-3 JPHYA7 0022-3751 Google Scholar
A. Prioriet al.,
“Polarization of the human motor cortex through the scalp,”
Neuroreport, 9
(10), 2257
–2260
(1998). http://dx.doi.org/10.1097/00001756-199807130-00020 NERPEZ 0959-4965 Google Scholar
A. V. Peterchevet al.,
“Fundamentals of transcranial electric and magnetic stimulation dose: definition, selection, and reporting practices,”
Brain Stimul., 5
(4), 435
–453
(2012). http://dx.doi.org/10.1016/j.brs.2011.10.001 1935-861X Google Scholar
A. Antalet al.,
“Cathodal stimulation of human MT+ leads to elevated fMRI signal: a tDCS-fMRI study,”
Restor. Neurol. Neurosci., 30
(3), 255
–263
(2012). RNNEEL 0922-6028 Google Scholar
N. Langet al.,
“How does transcranial DC stimulation of the primary motor cortex alter regional neuronal activity in the human brain?,”
Eur. J. Neurosci., 22
(2), 495
–504
(2005). http://dx.doi.org/10.1111/(ISSN)1460-9568 EJONEI 0953-816X Google Scholar
L. Mordillo-Mateoset al.,
“Effects of simultaneous bilateral tDCS of the human motor cortex,”
Brain Stimul., 5
(3), 214
–222
(2012). http://dx.doi.org/10.1016/j.brs.2011.05.001 1935-861X Google Scholar
J. A. WilliamsA. Pascual-LeoneF. Fregni,
“Interhemispheric modulation induced by cortical stimulation and motor training,”
Phys. Therapy, 90
(3), 398
–410
(2010). http://dx.doi.org/10.2522/ptj.20090075 0031-9023 Google Scholar
B. W. VinesC. CerrutiG. Schlaug,
“Dual-hemisphere tDCS facilitates greater improvements for healthy subjects’ non-dominant hand compared to uni-hemisphere stimulation,”
BMC Neurosci., 9
(103),
(2008). http://dx.doi.org/10.1186/1471-2202-9-103 BNMEA6 1471-2202 Google Scholar
D. Keeseret al.,
“Prefrontal transcranial direct current stimulation changes connectivity of resting-state networks during fMRI,”
J. Neurosci., 31
(43), 15284
–15293
(2011). http://dx.doi.org/10.1523/JNEUROSCI.0542-11.2011 JNRSDS 0270-6474 Google Scholar
C. Pena-Gomezet al.,
“Modulation of large-scale brain networks by transcranial direct current stimulation evidenced by resting-state functional MRI,”
Brain Stimul., 5
(3), 252
–263
(2012). http://dx.doi.org/10.1016/j.brs.2011.08.006 1935-861X Google Scholar
R. PolaniaM. A. NitscheW. Paulus,
“Modulating functional connectivity patterns and topological functional organization of the human brain with transcranial direct current stimulation,”
Human Brain Mapping, 32
(8), 1236
–1249
(2011). http://dx.doi.org/10.1002/hbm.21104 HBRME7 1065-9471 Google Scholar
R. PolaniaW. PaulusM. A. Nitsche,
“Reorganizing the intrinsic functional architecture of the human primary motor cortex during rest with non-invasive cortical stimulation,”
PLoS One, 7
(1), e30971
(2012). http://dx.doi.org/10.1371/journal.pone.0030971 1932-6203 Google Scholar
C. Paquetteet al.,
“Bilateral transcranial direct current stimulation modulates activation-induced regional blood flow changes during voluntary movement,”
J. Cereb. Blood Flow Metab., 31
(10), 2086
–2095
(2011). http://dx.doi.org/10.1038/jcbfm.2011.72 JCBMDN 0271-678X Google Scholar
A. Antalet al.,
“Transcranial direct current stimulation over the primary motor cortex during fMRI,”
Neuroimage, 55
(2), 590
–596
(2011). http://dx.doi.org/10.1016/j.neuroimage.2010.11.085 NEIMEF 1053-8119 Google Scholar
R. Hollandet al.,
“Speech facilitation by left inferior frontal cortex stimulation,”
Curr. Biol., 21
(16), 1403
–1407
(2011). http://dx.doi.org/10.1016/j.cub.2011.07.021 CUBLE2 0960-9822 Google Scholar
Y. H. KwonS. H. Jang,
“The enhanced cortical activation induced by transcranial direct current stimulation during hand movements,”
Neurosci. Lett., 492
(2), 105
–108
(2011). http://dx.doi.org/10.1016/j.neulet.2011.01.066 NELED5 0304-3940 Google Scholar
A. Antalet al.,
“Imaging artifacts induced by electrical stimulation during conventional fMRI of the brain,”
Neuroimage,
(2012). NEIMEF 1053-8119 Google Scholar
M. A. Franceschiniet al.,
“Diffuse optical imaging of the whole head,”
J. Biomed. Opt., 11
(5), 054007
(2006). http://dx.doi.org/10.1117/1.2363365 JBOPFO 1083-3668 Google Scholar
T. J. Huppertet al.,
“A temporal comparison of BOLD, ASL, and NIRS hemodynamic responses to motor stimuli in adult humans,”
Neuroimage, 29
(2), 368
–382
(2006). http://dx.doi.org/10.1016/j.neuroimage.2005.08.065 NEIMEF 1053-8119 Google Scholar
S. P. Kochet al.,
“High-resolution optical functional mapping of the human somatosensory cortex,”
Front. Neuroenerg., 2
(12),
(2010). http://dx.doi.org/10.3389/fnene.2010.00012 Google Scholar
S. C. Bunceet al.,
“Function near-infrared spectroscopy,”
IEEE Eng. Med. Biol. Mag., 25
(4), 54
–61
(2006). http://dx.doi.org/10.1109/MEMB.2006.1657788 IEMBDE 0739-5175 Google Scholar
L. HolperM. BiallasM. Wolf,
“Task complexity relates to activation of cortical motor areas during uni- and bimanual performance: a functional NIRS study,”
Neuroimage, 46
(4), 1105
–1113
(2009). http://dx.doi.org/10.1016/j.neuroimage.2009.03.027 NEIMEF 1053-8119 Google Scholar
G. Morrenet al.,
“Detection of fast neural signals in the motor cortex from function near infrared spectroscopy measurements using independent component analysis,”
Med. Biol. Eng. Comput., 42 92
–99
(2004). http://dx.doi.org/10.1007/BF02351016 MBECDY 0140-0118 Google Scholar
G. Strangmanet al.,
“A quantitative comparison of simultaneous BOLD fMRI and NIRS recordings during functional brain activation,”
Neuroimage, 17
(2), 719
–731
(2002). http://dx.doi.org/10.1006/nimg.2002.1227 NEIMEF 1053-8119 Google Scholar
V. Toronovet al.,
“Near-infrared study of fluctuations in cerebral hemodynamics during rest and motor stimulation: temporal analysis and spatial mapping,”
Med. Phys., 27
(4), 801
–815
(2000). http://dx.doi.org/10.1118/1.598943 MPHYA6 0094-2405 Google Scholar
K. G. C. Terborget al.,
“Noninvasive assessment of cerebral perfusion and oxygenation in acute ischemic stroke by near-infrared spectroscopy,”
Eur. Neurol., 62
(6), 338
–342
(2009). http://dx.doi.org/10.1159/000239794 EUNEAP 0014-3022 Google Scholar
T. Sutoet al.,
“Multichannel near-infrared spectroscopy in depression and schizophrenia: cognitive brain activation study,”
Biol. Psychiatry, 55
(5), 501
–511
(2004). http://dx.doi.org/10.1016/j.biopsych.2003.09.008 BIPCBF 0006-3223 Google Scholar
B. Khanet al.,
“Identification of abnormal motor cortex activation patterns in children with cerebral palsy by functional near-infrared spectroscopy,”
J. Biomed. Opt., 15
(3), 036008
(2010). http://dx.doi.org/10.1117/1.3432746 JBOPFO 1083-3668 Google Scholar
F. Tianet al.,
“Quantification of functional near infrared spectroscopy to assess cortical reorganization in children with cerebral palsy,”
Opt. Express, 18
(25), 25973
–25986
(2010). http://dx.doi.org/10.1364/OE.18.025973 OPEXFF 1094-4087 Google Scholar
D. H. Burnset al.,
“Near-infrared spectroscopy of blood plasma for diagnosis of sporadic Alzheimer’s disease,”
J. Alzheimers Dis., 17
(2), 391
–397
(2009). http://dx.doi.org/10.3233/JAD-2009-1053 JADIF9 1387-2877 Google Scholar
A. GibsonH. Dehghani,
“Diffuse optical imaging,”
Philos. Trans. R. Soc. A, 367
(1900), 3055
–3072
(2009). http://dx.doi.org/10.1098/rsta.2009.0080 PTRMAD 1364-503X Google Scholar
A. D. M. IzzetogluS. BunceB. Onaral,
“Motion artifact cancellation in NIR spectroscopy using wiener filtering,”
IEEE Trans. Med. Imaging, 52
(5), 934
–938
(2005). http://dx.doi.org/10.1109/TBME.2005.845243 ITMID4 0278-0062 Google Scholar
Q. ZhangX. YanG. E. Strangman,
“Development of motion resistant instrumentation for ambulatory near-infrared spectroscopy,”
J. Biomed. Opt., 16
(8), 087008
(2011). http://dx.doi.org/10.1117/1.3615248 JBOPFO 1083-3668 Google Scholar
H. W. Schytzet al.,
“Intact neurovascular coupling during executive function in migraine without aura: interictal near-infrared spectroscopy study,”
Cephalalgia, 30
(4), 457
–466
(2010). CEPHDF 0333-1024 Google Scholar
A. Villringer,
“Understanding functional neuroimaging methods based on neurovascular coupling,”
Adv. Exp. Med. Biol., 413 177
–193
(1997). http://dx.doi.org/10.1007/978-1-4899-0056-2 AEMBAP 0065-2598 Google Scholar
M. Kubotaet al.,
“Fast (100–175 ms) components elicited bilaterally by language production as measured by three-wavelength optical imaging,”
Brain Res., 1226 124
–133
(2008). http://dx.doi.org/10.1016/j.brainres.2008.05.079 BRREAP 1385-299X Google Scholar
A. V. Medvedevet al.,
“Seeing” electroencephalogram through the skull: imaging prefrontal cortex with fast optical signal,”
J. Biomed. Opt., 15
(6), 061702
(2010). http://dx.doi.org/10.1117/1.3505007 JBOPFO 1083-3668 Google Scholar
X. Baiet al.,
“Three-dimensional source imaging from simultaneously recorded ERP and BOLD-fMRI,”
IEEE Trans. Neural Syst. Rehabil. Eng., 17
(2), 101
–106
(2009). http://dx.doi.org/10.1109/TNSRE.2009.2015196 1534-4320 Google Scholar
B. DilharreguyR. A. JonesC. T. Moonen,
“Influence of fMRI data sampling on the temporal characterization of the hemodynamic response,”
Neuroimage, 19
(4), 1820
–1828
(2003). http://dx.doi.org/10.1016/S1053-8119(03)00289-1 NEIMEF 1053-8119 Google Scholar
A. C. Merzagoraet al.,
“Prefrontal hemodynamic changes produced by anodal direct current stimulation,”
Neuroimage, 49
(3), 2304
–2310
(2010). http://dx.doi.org/10.1016/j.neuroimage.2009.10.044 NEIMEF 1053-8119 Google Scholar
R. C. Oldfield,
“The assessment and analysis of handedness: the Edinburgh inventory,”
Neuropsychologia, 9
(1), 97
–113
(1971). http://dx.doi.org/10.1016/0028-3932(71)90067-4 NUPSA6 0028-3932 Google Scholar
C. Poreiszet al.,
“Safety aspects of transcranial direct current stimulation concerning healthy subjects and patients,”
Brain Res. Bull., 72
(4–6), 208
–214
(2007). http://dx.doi.org/10.1016/j.brainresbull.2007.01.004 BRBUDU 0361-9230 Google Scholar
G. H. Klemet al.,
“The ten-twenty electrode system of the International Federation. The International Federation of Clinical Neurophysiology,”
Electroencephalogr. Clin. Neurophysiol. Suppl., 52 3
–6
(1999). EECSB3 0424-8155 Google Scholar
P. A. Gelnaret al.,
“A comparative fMRI study of cortical representations for thermal painful, vibrotactile, and motor performance tasks,”
Neuroimage, 10
(4), 460
–482
(1999). http://dx.doi.org/10.1006/nimg.1999.0482 NEIMEF 1053-8119 Google Scholar
T. HanssonT. Brismar,
“Tactile stimulation of the hand causes bilateral cortical activation: a functional magnetic resonance study in humans,”
Neurosci. Lett., 271
(1), 29
–32
(1999). http://dx.doi.org/10.1016/S0304-3940(99)00508-X NELED5 0304-3940 Google Scholar
M. Lepageet al.,
“Frontal cortex and the programming of repetitive tapping movements in man: lesion effects and functional neuroimaging,”
Brain Res. Cogn. Brain Res., 8
(1), 17
–25
(1999). http://dx.doi.org/10.1016/S0926-6410(98)00055-X CBRREZ 0926-6410 Google Scholar
B. KhanP. ChandG. Alexandrakis,
“Spatiotemporal relations of primary sensorimotor and secondary motor activation patterns mapped by NIR imaging,”
Biomed. Opt. Express, 2
(12), 3367
–3386
(2011). http://dx.doi.org/10.1364/BOE.2.003367 BOEICL 2156-7085 Google Scholar
P. PraamstraR. Oostenveld,
“Attention and movement-related motor cortex activation: a high-density EEG study of spatial stimulus-response compatibility,”
Brain Res. Cogn. Brain Res., 16
(3), 309
–322
(2003). http://dx.doi.org/10.1016/S0926-6410(02)00286-0 CBRREZ 0926-6410 Google Scholar
J. Hidleret al.,
“MR compatible force sensing system for real-time monitoring of wrist moments during fMRI testing,”
J. Neurosci. Methods, 155
(2), 300
–307
(2006). http://dx.doi.org/10.1016/j.jneumeth.2006.01.016 JNMEDT 0165-0270 Google Scholar
P. S. Boggioet al.,
“Enhancement of non-dominant hand motor function by anodal transcranial direct current stimulation,”
Neurosci. Lett., 404
(1–2), 232
–236
(2006). http://dx.doi.org/10.1016/j.neulet.2006.05.051 NELED5 0304-3940 Google Scholar
D. Steele-Johnsonet al.,
“Achievement goals and task demand effects on motivation, affect, and performance,”
J. Appl. Psychol., 85
(5), 724
–738
(2000). http://dx.doi.org/10.1037/0021-9010.85.5.724 JAPGBP 0021-9010 Google Scholar
M. F. FolsteinR. Luria,
“Reliability, validity, and clinical application of the visual analogue mood scale,”
Psychol. Med., 3
(4), 479
–486
(1973). http://dx.doi.org/10.1017/S0033291700054283 PSMDCO 0033-2917 Google Scholar
A. Floelet al.,
“Influence of somatosensory input on motor function in patients with chronic stroke,”
Ann. Neurol., 56
(2), 206
–212
(2004). http://dx.doi.org/10.1002/(ISSN)1531-8249 ANNED3 0364-5134 Google Scholar
M. A. NitscheW. Paulus,
“Transcranial direct current stimulation—update 2011,”
Restor. Neurol. Neurosci., 29
(6), 463
–492
(2011). RNNEEL 0922-6028 Google Scholar
C. Julien,
“The enigma of Mayer waves: facts and models,”
Cardiovasc. Res., 70
(1), 12
–21
(2006). http://dx.doi.org/10.1016/j.cardiores.2005.11.008 CVREAU 0008-6363 Google Scholar
B. Khanet al.,
“Functional near infrared brain imaging with a brush-fiber optode to improve optical contact on subjects with dense hair,”
Proc. SPIE, 7883 78834V
(2011). http://dx.doi.org/10.1117/12.873839 PSISDG 0277-786X Google Scholar
G. StrangmanM. A. FranceschiniD. A. Boas,
“Factors affecting the accuracy of near-infrared spectroscopy concentration calculations for focal changes in oxygenation parameters,”
Neuroimage, 18
(4), 865
–879
(2003). http://dx.doi.org/10.1016/S1053-8119(03)00021-1 NEIMEF 1053-8119 Google Scholar
T. J. Huppertet al.,
“HomER: a review of time-series analysis methods for near-infrared spectroscopy of the brain,”
Appl. Opt., 48
(10), D280
–D298
(2009). http://dx.doi.org/10.1364/AO.48.00D280 APOPAI 0003-6935 Google Scholar
B. Brooksbyet al.,
“Spectral priors improve near-infrared diffuse tomography more than spatial priors,”
Opt. Lett., 30
(15), 1968
–1970
(2005). http://dx.doi.org/10.1364/OL.30.001968 OPLEDP 0146-9592 Google Scholar
A. Liet al.,
“Reconstructing chromosphere concentration images directly by continuous-wave diffuse optical tomography,”
Opt. Lett., 29
(3), 256
–258
(2004). http://dx.doi.org/10.1364/OL.29.000256 OPLEDP 0146-9592 Google Scholar
C. F. BeckmannM. JenkinsonS. M. Smith,
“General multilevel linear modeling for group analysis in FMRI,”
Neuroimage, 20
(2), 1052
–1063
(2003). http://dx.doi.org/10.1016/S1053-8119(03)00435-X NEIMEF 1053-8119 Google Scholar
A. F. AbdelnourT. Huppert,
“Real-time imaging of human brain function by near-infrared spectroscopy using an adaptive general linear model,”
Neuroimage, 46
(1), 133
–143
(2009). http://dx.doi.org/10.1016/j.neuroimage.2009.01.033 NEIMEF 1053-8119 Google Scholar
A. K. SinghI. Dan,
“Exploring the false discovery rate in multichannel NIRS,”
Neuroimage, 33
(2), 542
–549
(2006). http://dx.doi.org/10.1016/j.neuroimage.2006.06.047 NEIMEF 1053-8119 Google Scholar
C. J. Stamet al.,
“Small-world networks and functional connectivity in Alzheimer’s disease,”
Cereb. Cortex, 17
(1), 92
–99
(2007). http://dx.doi.org/10.1093/cercor/bhj127 53OPAV 1047-3211 Google Scholar
E. J. Sanz-Arigitaet al.,
“Loss of ‘small-world’ networks in Alzheimer’s disease: graph analysis of FMRI resting-state functional connectivity,”
PLoS One, 5
(11), e13788
(2010). http://dx.doi.org/10.1371/journal.pone.0013788 1932-6203 Google Scholar
R. C. MesquitaM. A. FraceschiniD. A. Boas,
“Resting state functional connectivity of the whole head with near-infrared spectroscopy,”
Biomed. Opt. Express, 1
(1), 324
–336
(2010). http://dx.doi.org/10.1364/BOE.1.000324 BOEICL 2156-7085 Google Scholar
C. J. D. Luca,
“The use of surface electromygraphy in biomechanics,”
J. Appl. Biomech., 13
(2), 135
–163
(1997). JABOEG 1065-8483 Google Scholar
A. J. SuminskiJ. L. ZimbelmanR. A. Scheidt,
“Design and validation of a MR-compatible pneumatic manipulandum,”
J. Neurosci. Methods, 163
(2), 255
–266
(2007). http://dx.doi.org/10.1016/j.jneumeth.2007.03.014 JNMEDT 0165-0270 Google Scholar
J. Leiteet al.,
“Task-specific effects of tDCS-induced cortical excitability changes on cognitive and motor sequence set shifting performance,”
PLoS One, 6
(9), e24140
(2011). http://dx.doi.org/10.1371/journal.pone.0024140 1932-6203 Google Scholar
Y. SuzukiE. Naito,
“Neuro-modulation in dorsal premotor cortex facilitates human multi-task ability,”
J. of Behav. Brain Sci., 2
(3), 372
–379
(2012). http://dx.doi.org/10.4236/jbbs.2012.23042 JBBSAV 2160-5866 Google Scholar
|


