
|
|
1.IntroductionPhotodynamic therapy (PDT) is a superordinate concept for treatments based on the photosensitized generation of singlet oxygen.1,2 Singlet oxygen () is molecular oxygen in its lowest excited electronic state. It is highly reactive and thus one of the reactive oxygen species. Several cutaneous diseases, e.g., psoriasis and basal/squamous cell carcinoma, can be treated effectively with PDT. For PDT, a photosensitizing drug is administered to a patient, followed by localized light exposure in the visible range. This therapy is quite selective since the photosensitizer (PS) and the low-energy light are not toxic by themselves. The toxic effect is present only where PS accumulation and light exposure occur simultaneously. Neighboring, healthy tissue that is not illuminated or where PS does not accumulate is therefore not affected. Due to energy transfer from the excited PS to molecular oxygen, is generated, which is considered the key mediator of the photodynamic effect.1,3 The reactivity of causes, for example, in a malignant tissue, damage of the cancer cells.4,5 The localization of PSs and their ability to generate are thus features critically important for PDT applications. Using time-resolved detection, kinetics (e.g., rise and decay times) can be monitored. The kinetics is determined by availability, PS properties, and quenching. Quenching may either be physical quenching, such as by water, or chemical quenching, which results in the consumption of oxygen in a chemical reaction. This limits the lifetime of and thus limits the region relevant for interaction with to a microenvironment around the PS accumulation sites—in biological environments, typically in the order of 100 nm or less.6 By evaluation of the kinetics, valuable information can be gained about the interaction of with the environment and the microstructure of the sample.7,8 Fitting theoretical models to the data allow determining the geometry of a heterogeneous microenvironment of the PS.9 The availability of in vivo assays is of great interest, as these measurements will help to further enlighten the modes of action and can be employed during therapy to optimize parameters such as light dosage by monitoring quenching efficiencies and saturation in situ.10,11 The detection of , however, remains a challenging task. Singlet oxygen detection, even in vitro, often relies on indirect—mostly chemical—methods. This, however, has a limited reliability in complex systems such as cells or tissue, primarily due to different localization properties of reporter molecules and PSs. Using reporter molecules in skin in vivo is difficult or impossible.12 Furthermore, a major limitation of such indirect methods is the inability to resolve kinetics. Thus, only a little information about the interaction with the environment can be gained due to the fact that only the information about the total amount of that has reacted with the reporter compound is detected. Direct detection is superior to indirect methods in general, especially avoiding the problem of different localizations of and a reporter compound. The method is based on the detection of the luminescence at .4,6 Despite the low quantum yield of in biological environments,6 luminescence-based measurements of this low-intensity emission are pursued intensely. Studies of photosensitized generated in vitro were conducted in the early 1990s, evaluating the steady-state spectra in the near-infrared (NIR).13,14 However, the steady-state investigations also lack the ability to resolve kinetics. Thus, the interaction with the environment, which is crucial for in vivo investigations, cannot be investigated. Properties, such as quenching, saturation, or the geometry of the system, cannot be determined.9,15 In complex systems, even the total luminescence intensity is unreliable for several reasons. On one hand, the signal-to-noise ratio (SNR) may be reduced by a possible NIR luminescence from another source or naturally occurring , which contributes to a background signal. On the other hand, the heterogeneity of the system itself can cause misleading results of the total luminescence intensity because the radiative rate constant of the luminescence may not be equal for every part of the system. For membrane systems, it was found to be much higher in the membranous compartment compared to the surrounding environment.9 In contrast to steady-state investigations, time-resolved luminescence detection yields broad information about the interaction with the local environment of the PS. Recently, the detection of luminescence kinetics in vitro, from cells in suspension, has become possible.7,16–20 Time-resolved luminescence measurements in vivo are still very difficult and require refinement to provide a diagnostic tool for use in clinical protocols or research.12 Lee et al. measured the decay time-resolved after excitation of a PS with a microsecond light pulse on PS in solution as well as tumor-laden rats. This very short rise time of the luminescence signal usually cannot be resolved.21 In some systems, such as cells, the short luminescence rise time is determined by the decay time.9,10 Using laser excitation in the nanosecond regime, direct and time-resolved measurements of in vivo on rats, photosensitized by systemic drug administration, have been reported.18 Yet the low SNR limited the ability to evaluate the kinetics. Direct, time-resolved measurements of in skin generated by ultraviolet A irradiation of endogenous PSs yielded a weak and complex signal where semiquantified decay time components were attributed: a decay time , and a decay time of 8 μs, fitted to the luminescence signal in the time region from 2 to 16 μs as well as a long-lived decay time .17 Since it is of great importance to assess the PDT efficiency spatially resolved, imaging techniques of luminescence with a resolution on the order of millimeters have been applied in vivo, using scanning techniques18,22,23 or a camera.21 Even though the scanning methods in principle allow resolving kinetics, no vital results were gained. Low SNR or the exclusion of the first 2 μs after the laser pulse hindered the determination of accurate kinetics. Without kinetics, no direct information about the interaction of the with its microenvironment is gained. These restrictions also apply to Ref. 24. A fiber was used for excitation as well as luminescence collection; however, kinetics were only reported without spatial resolution and no parameters were determined from the kinetics. Furthermore, especially in vivo, photosensitized generated may not be the only source of NIR luminescence;24 thus a kinetics analysis is expedient or even mandatory concerning the reliability of results. The amount of is considered the crucial factor for the PDT effect. First studies have already shown a positive correlation between luminescence and tumor regression in rats24 and the post-PDT edema and erythema response of in vivo human skin.25 However, a detailed insight into the kinetics and signal distribution in skin could not be obtained with the setups used therein. Up to now, state-of-the-art detection of in vivo is not yet an exact measure to optimize PDT treatment plans. In a theoretical approach, simulations were conducted for the specific case of aminolevulinic acid treatment to enhance the PDT irradiation parameters without using luminescence dosimetry.26 The simulations were conducted for the case of normal skin. Thus, a drawback of this theoretical approach is the limitation to that specific system. The clinical application of that model is questionable because skin with cutaneous diseases (e.g., psoriasis, cell carcinoma) shows properties strongly different from normal skin. Thus, luminescence dosimetry still is a favorable method for the assessment of PDT in general or the optimization of individual PDT treatment plans in particular. The combination of spatial resolution and time-resolved detection may improve the correlation of luminescence and the effect of PDT as surface inhomogeneity has not been taken into account in previous studies. The topical application of a PS in crème is a clinical procedure for photodynamic treatment of various skin diseases.27 Ex vivo pig ear skin is considered a very good model for in vivo human skin;28,29 thus results from this study can qualitatively apply to in situ experiments even though quantitative differences may be expected. In skin penetration experiments, Schaefer and Lademann investigated the critical role of the microarchitectures of the skin, e.g., hair follicles, microlesions, or sweat glands, for the diffusion of active compounds into the stratum corneum.30,31 Instead of presuming the skin as a dense homogeneous lipid layer, the spatial characteristics of the skin have to be taken into account for a reliable research in the field of dermatological applications. Especially in the case of photodynamic treatment of skin diseases, which is usually accompanied by changes in the barrier function of the epidermis, spatially resolved detection methods will be indispensable to investigate the suitability of a PS or the mode of action of therapy. Recently, we reported an experimental setup for time-resolved luminescence detection with very high sensitivity.7 Using low illumination doses at PDT-relevant light intensities, luminescence has been detected in ex vivo pig ear skin. This allows distinguishing PS with different localizations as well as tracking the change of and PS triplet decay times as a function of light exposure in tissue.8 Here, we present a fiber-based measurement combining spatially and time-resolved luminescence detection. Besides the fact that the fiber-based approach allows easy handling, the method allows a precise investigation of the photosensitized generation of and its interaction with the skin—especially with respect to the architecture of the skin and the microenvironment of the PS. We show that this allows distinguishing between PS that may be in residual crème in the follicular orifice due to the application procedure and PS that has penetrated into the skin. This method will thus allow precise investigations of PS formulations as well as detailed penetration studies of healthy and abnormal skin. 2.Materials and Methods2.1.Sample PreparationPig ear skin samples from animals sacrificed the previous day were obtained from the Dermatological Clinic of the Charité, Berlin, Germany. The ears were washed and the hair was removed using a razorblade or scalpel. Samples from the ear were cut out. On these skin samples, the PS was applied topically in a vanishing crème at an amount of to and slightly massaged for . After 60 min, the samples were washed with water to remove residual (not absorbed) crème from the skin surface. As PS pheophorbide-a (pheo), obtained from spirulina Arthrospira platensis, is used. Physiogel® hypoallergen vanishing crème was obtained from Stiefel Laboratorium GmbH, Germany. Pheophorbide-a was suspended in Physiogel® (0.1% by weight) to yield a molar concentration of . 2.2.Luminescence Detection SetupSinglet oxygen luminescence was detected using photon counting as described in Ref. 7. The excitation source comprises a frequency-doubled diode pumped laser and a customized dye laser. For all spatially resolved measurements, the excitation was done at 666 nm, in the lowest-energy absorption band of pheo. The light intensity for excitation was maintained at 11 mW for the setup as in Fig. 1(a) and at 2 mW for the setup as in Fig. 1(b), measured with a LabMax/J 10MT- 10 kHz (Coherent, Germany). The repetition rate was 12.2 kHz and the pulse length 10 ns. Fig. 1(a) Schematic of the luminescence acquisition setup and the geometry of the flat fiber-tip. (b) Schematic of the optics used for high-resolution scanning. 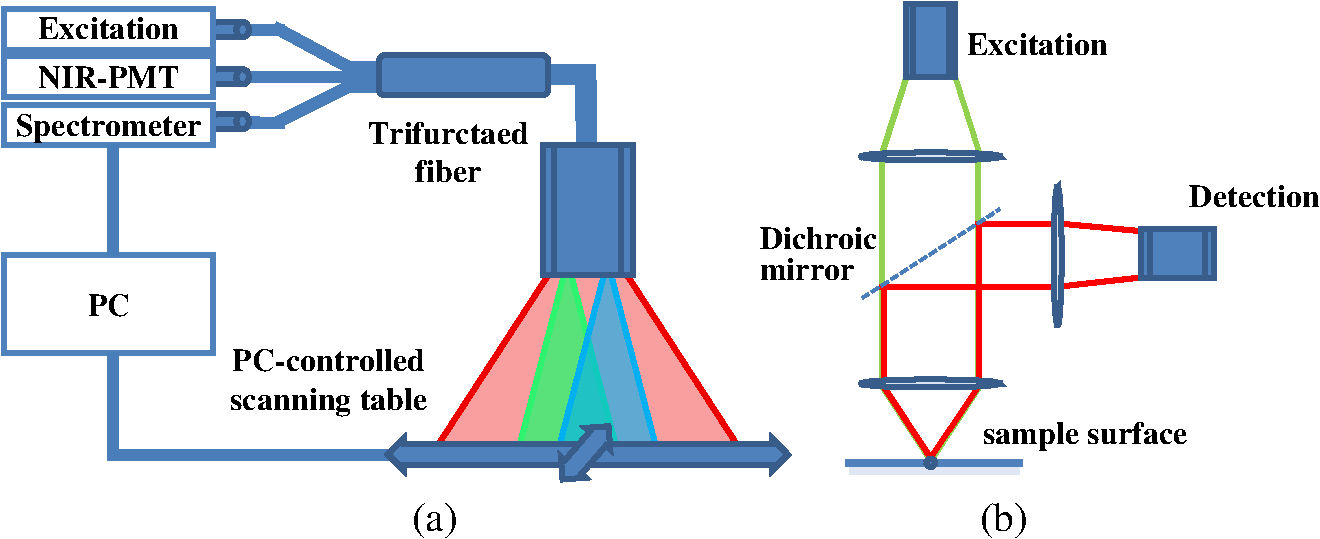 The NIR luminescence was detected with a photomultiplier, H-10330-45 (Hamamatsu Photonics, Germany), sensitive from 950 to 1400 nm with a nominal quantum efficiency of 2% at 1270 nm. An lens transfers collimated light onto the effective area of the anode (1.6 mm diameter). The rise time of 900 ps and the transit time spread of 300 ps may be neglected in the luminescence decay time domain. The NIR luminescence is discriminated using an interference filter with a central wavelength at 1270 nm. emission is verified by comparing to measurements with filters at 1200 and 1300 nm. The high sensitivity of the setup allows the determination of rise and decay times with an accuracy and reproducibility of 0.1 μs in many biological samples.7 Larger error margins are given for absolute values due to sample variance. For the measurements reported here, the luminescence was detected through an optical fiber. Two approaches were made. One comprises a tri-furcated fiber, with a flat fiber-tip [Fig. 1(a)]. The other comprises the fiber for detection perpendicular to the excitation; excitation and detection are focused on the sample and separated by a dichroic mirror. The flat fiber-tip comprises separate fibers for excitation and detection of fluorescence and luminescence, each connected to one leg of the tri-furcated fiber. The fibers of all three legs are arranged side by side in the fiber-tip. The flat design without further optics results in a tip that is easy to handle. The signal maximum is found at a short distance of a few millimeters above the sample surface. This can be expected for this probe geometry and scattering samples such as skin as described in Ref. 32. The signals obtained with this setup result from averaging over a certain area of the sample, but offer only low spatial resolution. The PS fluorescence was detected using a fiber spectrometer, C10083CA (Hamamatsu). The excitation light was discriminated using a cut-on filter with 550 nm cut-on wavelength for measurements with 532 nm excitation wavelength and one with 700 nm cut-on wavelength for measurements with 666 nm excitation wavelength. The second setup, as in Fig. 1(b), comprises a single core fiber for the detection; excitation light is delivered perpendicular to the detection. A dichroic mirror separates the wavelengths. The lenses allow focusing the laser spot on the sample; the spot is as narrow as 0.2 mm in diameter. Thus, higher resolution scanning is possible with a resolution limit determined by the laser spot and the scattering properties of the investigated sample. 2.3.Singlet Oxygen KineticsThe time-dependency, , of the amount of PS-generated in a homogeneous environment is simplified as described by Eq. (1): On the microsecond time scale, the PS molecules can be assumed to reach the triplet state instantaneously following a nanosecond laser pulse excitation. The fitting constant C accounts for the number of initially excited PS molecules, while and represent the and PS triplet state decay times, respectively. The sign of the pre-exponential factor can change depending on the relative values of the two decay times; a signal rise is determined mainly by the faster process and the decay by the slower one. Hence, the firm assignment of PS triplet and decay times to the fitting parameters of the luminescence signal requires additional experiments.10 In vitro the PS triplet lifetime can be determined directly by flash photolysis33 or indirectly by the addition of quenchers in variable concentrations followed by the monitoring of the changes in decay time. Since these methods cannot be applied here, the samples were exposed to pure atmosphere and the change in kinetics under readmission of was evaluated. Considering the high quantum yields, the PS triplet decay time is mainly determined by the efficiency of the energy transfer to . Thus, reducing the concentration leads to an increased PS triplet decay time while the decay time remains constant, allowing a quantitative differentiation between the two processes and assigning of and to the fitted parameters.34 For skin samples, as investigated previously, the shorter time reflects the triplet decay, while the longer time can be attributed to decay.8 It should be noted that Eq. (1) is strictly applicable only for homogenous environments. However, the model is widely accepted and used here for a first evaluation of the data. Due to the signal artifact from the skin samples at times shortly after the laser pulse, the first 1.6 μs were excluded from the fitting procedure. 3.Results and Discussion3.1.Fiber Influence on Detection of Singlet Oxygen Luminescence KineticsIt is known that some common glass types may exhibit luminescence in the NIR, e.g., when glass cuvettes are used. Since the glass emission causes artifacts in time-resolved luminescence measurements, we evaluate the influence of the light transmission through the optical fiber to exclude the possibility of signal distortion by the influence of the fiber optics. For this experiment, the setup as in Fig. 1(a) is used; the fiber length is 2 m. To investigate the influence of the fiber on the luminescence kinetics, we use the PS in solution—pheo in ethanol. The kinetics of this system are described by Eq. (1) exactly. The solution of pheo was put in a cuvette and measured directly with the setup described previously.7 We compare that measurement with the measurements using the fiber. Therefore, the fiber-tip was dipped in the cuvette to obtain the luminescence signal via the fiber. For the determination of errors, 100 identical measurements were performed, fitted, and the standard deviation of the parameters was determined. The -test, respectively, the reduced value, is used to quantify the goodness-of-fit. The luminescence signals obtained from measurements of pheo in ethanol in a cuvette without using the optical fiber can be fitted with a reduced value of 1.00, proving a perfect congruence of theory and experiment. The measurements shown in Fig. 2 were fitted with (cuvette) and (fiber) triplet decay time and (cuvette) and (fiber) for the decay time. The reduced value obtained for the measurement using the fiber is 0.99, also proving a very good correlation of theory and experimental result. Considering the fitted parameters and the errors, a possible influence of the fiber on the kinetics of the luminescence signal is below the measurement error. Fig. 2Singlet oxygen luminescence signal photosensitized generated by pheophorbide-a in ethanol. Dark blue dots: measurement in cuvette without optical fiber; light red squares: measurement through the optical fiber with the setup as shown in Fig. 1(a). Solid black line: two exponential fit of the data. The fitted parameters are (cuvette) and (fiber) triplet decay time and (cuvette) and (fiber). The reduced values are 1.00 (cuvette) and 0.99 (fiber).  3.2.Singlet Oxygen Luminescence Detection in SkinSamples of pig ear skin were investigated using the setup as in Fig. 1(a). The sample of pig ear skin was prepared as shown in Fig. 3(a): the upper half of the sample was prepared with PS-crème according to the procedure described in Sec. 2.1; the lower half was delimited using a fixed tooth pick to prevent massaging the PS-crème in the part without PS and thus avoid the penetration of the PS in the skin. The investigated area on the sample was marked with black dots to allow a correlation of the photo and the luminescence measurement. The fiber-tip was fixed above the sample at the distance of the signal maximum. The sample was moved pixel by pixel to scan the area. The fluorescence spectrum was integrated for 100 ms per pixel and the luminescence for 10 s. Fig. 3(a) Photo of the sample; the black dots mark an area of by . (b) Fluorescence spectrum of pheophorbide-a in ethanol. (c) Normalized pheophorbide-a fluorescence intensity at 720 nm in skin on the area between the black dots in (a). Excitation was at 666 nm, with 11 mW and 100 ms integration time per pixel. (d) Typical skin fluorescence spectra acquired with 532-nm excitation at a location with pheophorbide-a (black curve) and a location without (red curve). For the better display of the fluorescence spectra in (b) and (d), 532 nm was chosen as excitation wavelength and a 550-nm long-pass filter was used for discrimination of the excitation light. The scanning was done using excitation light at 666 nm, as this is the relevant excitation wavelength for this photosensitizer in, e.g., photodynamic therapy applications. 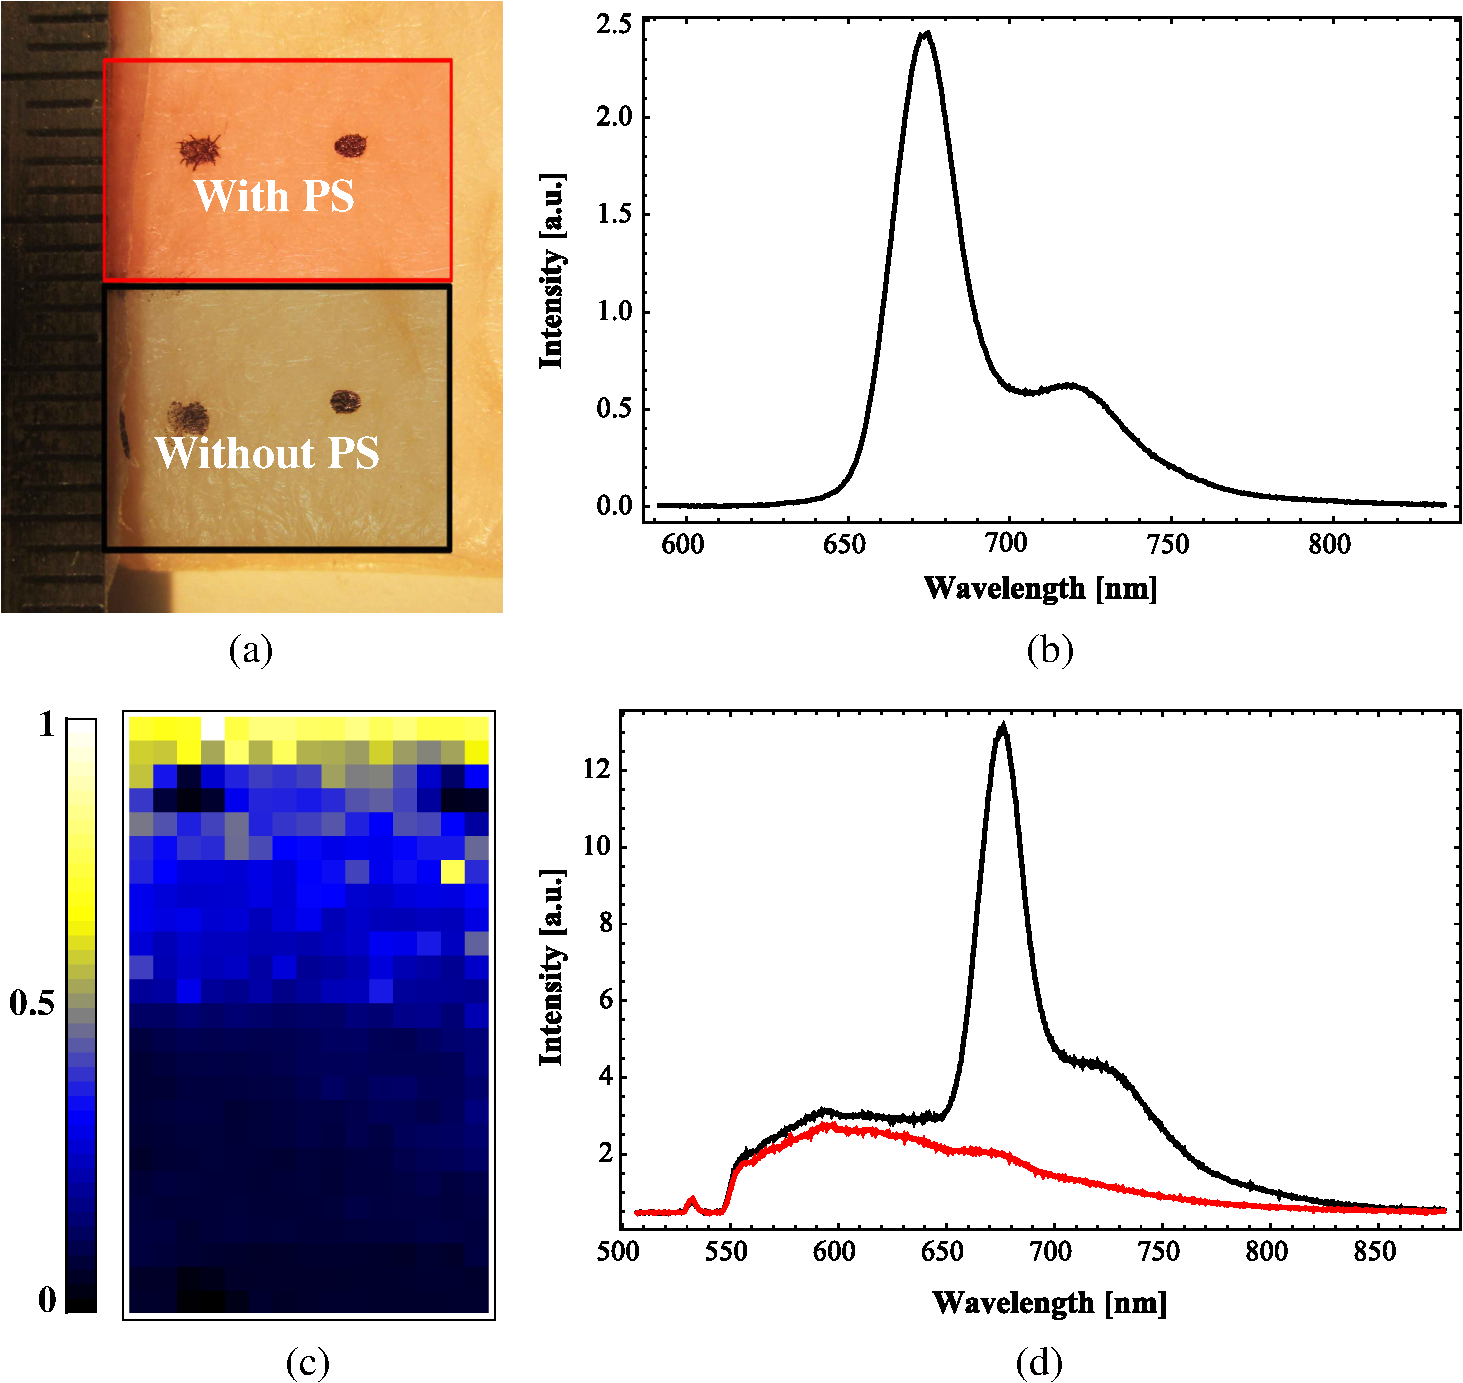 The characteristic fluorescence spectrum of pheo in solution is shown in Fig. 3(b). This can be clearly identified in the skin sample, on the area that was treated with pheo in crème [Fig. 3(c) and spectra in Fig. 3(d)]. For better display of the fluorescence spectra in Figs. 3(b) and 3(d), 532 nm was chosen as the excitation wavelength and a 550-nm long-pass filter was used for discrimination of the excitation light. The skin itself shows everywhere some broad background luminescence, which does not hinder the identification of the pheo fluorescence. In Fig. 3(c), the fluorescence intensity map of the sample is displayed. The 720-nm emission of pheo is quantified by integrating the fluorescence spectrum from 710 to 730 nm. The effect of background luminescence of the skin was neglected. The black dots used for position marking appear nonfluorescent. The fluorescence intensity map shows that the pheo emission can be clearly attributed only to half of the sample that was prepared with PS-crème, while the untreated area does not fluoresce beyond the background fluorescence. Figure 4(a) shows the luminescence intensity distribution across the sample, which is congruent with the PS fluorescence intensity distribution of the sample shown in Fig. 3(c). The luminescence was acquired time-resolved for every pixel. Figure 4(b) shows the luminescence kinetics for a , which is a detail of Fig. 4(a). The central pixel is fitted [Fig. 4(c)] with the biexponential model [Eq. (1)], yielding a rise time of and a decay time of . Despite differences in the measurement techniques, the results obtained via scanning match our previously published kinetics where a rise time changing from to and a decay time changing from to with illumination of at 666 nm was found.8 It should be noted that those kinetics were obtained by averaging over large and not precisely controlled areas but offered the ability to resolve the change of kinetics with illumination. Currently, the scanning procedure does not allow precise tracking of the change of the kinetics with illumination, because during scanning, it cannot be avoided that the whole sample is illuminated, mainly due to scattering of the sample itself. This illumination may cause changes of the kinetics already before a certain pixel is measured. Fig. 4Time-resolved singlet oxygen luminescence signals from pig ear skin, acquired through a fiber, with 11 mW excitation power at 666 nm and 10 s integration time per pixel. (a) Normalized singlet oxygen luminescence intensity on the area between the black dots in Fig. 3(a). (b) Grid of the singlet oxygen luminescence kinetics of the area marked in (a). Axes and scales were omitted for presentation (each axis shows 35 μs full-scale, the axis 400 counts full-scale). (c) Singlet oxygen luminescence kinetics of the central pixel in (b), fitted according to the biexponential model. The signal rise time is 0.4 μs, and the decay time is 13.6 μs.  3.3.Spatially Resolved Singlet Oxygen Kinetics in SkinA sample of pig ear skin prepared with pheo as described in Sec. 2.1 was scanned at high resolution using the focusing setup as in Fig. 1(b). A scanned area of by 4 mm is shown in Fig. 5. The intensity distribution [Fig. 5(a)] clearly shows several distinct maxima of the luminescence intensity. A correlation with a photo [Figs. 5(b) and 5(c)] of the scanned area suggests that the luminescence intensity maxima correlate with the macrostructure of the skin. Likely, the topography of the skin allows a higher accumulation of PS at certain locations. Structures like hair follicles and furrows seem to pose accumulation sites for the PS and show higher luminescence intensity. Fig. 5(a) Normalized singlet oxygen luminescence intensity map. The size of the scanned area is . (b) Photo of the scanned area. The black dots on the photo are markings to correlate the scanning area with the location on the photo. (c) Overlay of (a) and (b).  Even though it could be assumed that the follicular orifice poses a location for the accumulation of the PS-crème, the luminescence kinetics allows negating this assumption. The luminescence kinetics differ from the kinetics that would be expected for the PS in the crème. The luminescence kinetics in the skin sample show a maximum of the decay time of 19 μs at the presumed location of follicles. Previously reported kinetics of luminescence in crème yield decay times of .35 Taking into account the short diffusion range in the order of 100 nm, this leads to the conclusion that is interacting with the skin. A significant accumulation of the PS-crème within the comparably large follicular orifice would show a much longer decay time—similar to crème. Cryo-biopsies of pig ear skin samples prepared with pheo support this hypothesis. The samples show an accumulation of pheo in the hair follicle as well as in the stratum corneum [Fig. 6(b)]. Fig. 6(a) Singlet oxygen decay times in microsecond of the scanned area in Fig. 5. (b) Fluorescence microscopy image of a cryo-biopsy of pig ear skin prepared with pheophorbide-a in crème. The fluorescence of pheophorbide-a is shown in red and originates from within the stratum corneum as well as the hair follicle. 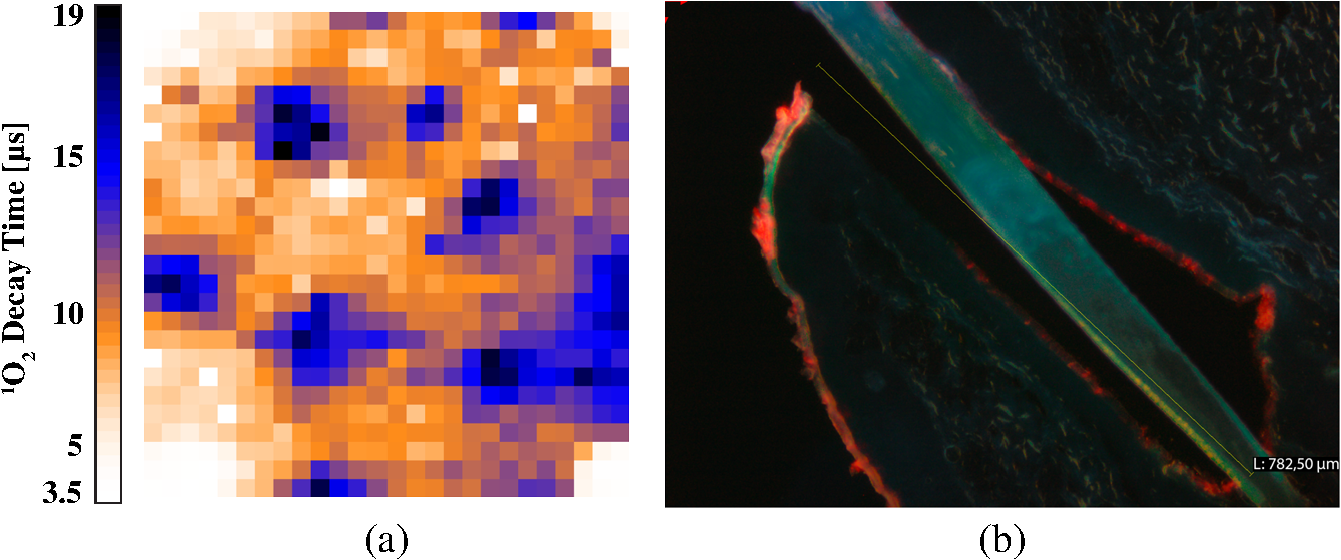 Present results still do not allow to clearly differentiate whether the higher luminescence at the hair follicles is merely an effect of the much higher surface area due to the geometry of the hair follicle or whether the hair follicle provides a preferred accumulation site for pheo due to different cell populations within the hair follicle.36 A quantitative analysis of the luminescence intensity, which could help elucidate this effect, is technically difficult due to the scattering processes within the skin. As well, a correlation with the increased surface area at the hair follicle will be practically impossible since the geometry of the specific hair follicle is not known. 4.Conclusions and ProspectsWe showed that luminescence can be detected time-resolved through fiber optics without causing signal distortion. A convenient fiber-tip setup as well as a setup for high-resolution scanning was employed. Both setups are suitable for time-resolved detection in skin, even in situ. At the same time, the PS fluorescence can be monitored in parallel. This is the first study revealing a correlation of luminescence kinetics, PS fluorescence, and the microstructure of the skin, on the scale of the size of hair follicles. Using high-resolution scanning, a correlation between the macroscopic skin structure and the intensity was found. Structures like hair follicles coincide with the maxima of luminescence intensity. Evaluation of the decay times suggests that the obtained signal results from the interaction of the dye with the skin and is not an artifact of the preparation procedure. The development of a procedure for two-dimensional tracking of the development of the luminescence rise and decay times with illumination will be a future step to plot a more complete picture of the interaction with very complex systems such as tissue. This will help to study the penetration patterns of PS in healthy skin as well as in cancerous tissue. During PDT, an in situ monitoring of the PDT efficacy and parameters such as the oxygen saturation in the microenvironment of the PS becomes possible. AcknowledgmentsThe authors would like to thank the Dermatological Clinic, Charité Berlin, for supplying pig ear samples. ReferencesB. Röder,
“Photodynamic therapy,”
Encyclopedia Analytical Chemistry, 302
–320 John Wiley & Sons Ltd., Chichester
(2000). Google Scholar
Z. Huang,
“A review of progress in clinical photodynamic therapy,”
Technol. Cancer Res. Treat., 4
(3), 283
–293
(2005). TCRTBS 1533-0346 Google Scholar
M. J. Niedreet al.,
“In vitro tests of the validity of singlet oxygen luminescence measurements as a dose metric in photodynamic therapy,”
Cancer Res., 63
(22), 7986
–7994
(2003). CNREA8 0008-5472 Google Scholar
M. C. DeRosaR. J. Crutchley,
“Photosensitized single oxygen and its applications,”
Coord. Chem. Rev., 233–234 351
–371
(2002). http://dx.doi.org/10.1016/S0010-8545(02)00034-6 CCHRAM 0010-8545 Google Scholar
J. C. KennedyR. H. PottierD. C. Pross,
“Photodynamic therapy with endogenous protoporphyrin IX: basic principles and present clinical experience,”
J. Photochem. Photobiol. B, 6
(1–2), 143
–148
(1990). http://dx.doi.org/10.1016/1011-1344(90)85083-9 JPPBEG 1011-1344 Google Scholar
C. SchweitzerR. Schmidt,
“Physical mechanisms of generation and deactivation of singlet oxygen,”
Chem. Rev., 103
(5), 1685
–1757
(2003). http://dx.doi.org/10.1021/cr010371d CHREAY 0009-2665 Google Scholar
J. SchlothauerS. HackbarthB. Röder,
“A new benchmark for time-resolved detection of singlet oxygen luminescence—revealing the evolution of lifetime in living cells with low dose illumination,”
Laser Phys. Lett., 6
(3), 216
–221
(2009). http://dx.doi.org/10.1002/lapl.v6:3 1612-2011 Google Scholar
J. C. Schlothaueret al.,
“Time-resolved singlet oxygen luminescence detection under photodynamic therapy relevant conditions: comparison of ex vivo application of two photosensitizer formulations,”
J. Biomed. Opt., 17
(11), 115005
(2012). http://dx.doi.org/10.1117/1.JBO.17.11.115005 JBOPFO 1083-3668 Google Scholar
S. Hackbarthet al.,
“New insights to primary photodynamic effects—singlet oxygen kinetics in living cells,”
J. Photochem. Photobiol. B, 98
(3), 173
–179
(2010). http://dx.doi.org/10.1016/j.jphotobiol.2009.11.013 JPPBEG 1011-1344 Google Scholar
J. R. Kanofsky,
“Measurement of singlet-oxygen in vivo: progress and pitfalls,”
Photochem. Photobiol., 87
(1), 14
–17
(2011). http://dx.doi.org/10.1111/php.2010.87.issue-1 PHCBAP 0031-8655 Google Scholar
J. P. Celliet al.,
“Imaging and photodynamic therapy: mechanisms, monitoring, and optimization,”
Chem. Rev., 110
(5), 2795
–2838
(2010). http://dx.doi.org/10.1021/cr900300p CHREAY 0009-2665 Google Scholar
W. Baumleret al.,
“UVA and endogenous photosensitizers—the detection of singlet oxygen by its luminescence,”
Photochem. Photobiol. Sci., 11
(1), 107
–117
(2011). http://dx.doi.org/10.1039/c1pp05142c PPSHCB 1474-905X Google Scholar
A. A. Krasnovskyet al.,
“Photophysical studies of pheophorbide-a and pheophytin-a phosphorescence and photo-sensitized singlet oxygen luminescence,”
J. Photochem. Photobiol. B, 5
(2), 245
–254
(1990). http://dx.doi.org/10.1016/1011-1344(90)80009-M JPPBEG 1011-1344 Google Scholar
B. Roederet al.,
“Photophysical properties and photodynamic activity in vivo of some tetrapyrroles,”
Biophys. Chem., 35
(2–3), 303
–312
(1990). http://dx.doi.org/10.1016/0301-4622(90)80017-2 BICIAZ 0301-4622 Google Scholar
B. Röderet al.,
“Photophysical properties of pheophorbide a in solution and in model membrane systems,”
J. Porphyr. Phthalocyanines, 4
(1), 37
–44
(2000). http://dx.doi.org/10.1002/(SICI)1099-1409(200001/02)4:<;37::AID-JPP183>;3.0.CO;2-O JPPHFZ 1088-4246 Google Scholar
A. Preusset al.,
“Photosensitizer loaded HSA nanoparticles II: in vitro investigations,”
Int. J. Pharm., 404
(1–2), 308
–316
(2011). http://dx.doi.org/10.1016/j.ijpharm.2010.11.023 IJPHDE 0378-5173 Google Scholar
J. Baieret al.,
“Direct detection of singlet oxygen generated by UVA irradiation in human cells and skin,”
J. Investig. Dermatol., 127
(6), 1498
–1506
(2007). http://dx.doi.org/10.1038/sj.jid.5700741 JIDEAE 0022-202X Google Scholar
M. NiedreM. S. PattersonB. C. Wilson,
“Direct near-infrared luminescence detection of singlet oxygen generated by photodynamic therapy in cells in vitro and tissues in vivo,”
Photochem. Photobiol., 75
(4), 382
–391
(2002). http://dx.doi.org/10.1562/0031-8655(2002)0750382DNILDO2.0.CO2 PHCBAP 0031-8655 Google Scholar
E. F. da Silvaet al.,
“Irradiation- and sensitizer-dependent changes in the lifetime of intracellular singlet oxygen produced in a photosensitized process,”
J. Phys. Chem. B, 116
(1), 445
–461
(2012). http://dx.doi.org/10.1021/jp206739y JPCBFK 1520-6106 Google Scholar
A. Jimenez-Banzoet al.,
“Kinetics of singlet oxygen photosensitization in human skin fibroblasts,”
Free Radical Biol. Med., 44
(11), 1926
–1934
(2008). http://dx.doi.org/10.1016/j.freeradbiomed.2008.02.011 FRBMEH 0891-5849 Google Scholar
S. Leeet al.,
“A singlet oxygen monitor as an in vivo photodynamic therapy dosimeter,”
Proc. SPIE, 7380 738046
(2009). http://dx.doi.org/10.1117/12.823030 PSISDG 0277-786X Google Scholar
M. J. Niedreet al.,
“Singlet oxygen luminescence as an in vivo photodynamic therapy dose metric: validation in normal mouse skin with topical amino-levulinic acid,”
Br. J. Cancer, 92
(2), 298
–304
(2005). BJCAAI 0007-0920 Google Scholar
M. J. Niedreet al.,
“Imaging of photodynamically generated singlet oxygen luminescence in vivo,”
Photochem. Photobiol., 81
(4), 941
–943
(2005). http://dx.doi.org/10.1562/2005-03-15-TSN-462R.1 PHCBAP 0031-8655 Google Scholar
S. Leeet al.,
“Pulsed diode laser-based singlet oxygen monitor for photodynamic therapy: in vivo studies of tumor-laden rats,”
J. Biomed. Opt., 13
(6), 064035
(2008). http://dx.doi.org/10.1117/1.3042265 JBOPFO 1083-3668 Google Scholar
H. J. Laubachet al.,
“In-vivo singlet oxygen dosimetry of clinical 5-aminolevulinic acid photodynamic therapy,”
J. Biomed. Opt., 13
(5), 050504
(2008). http://dx.doi.org/10.1117/1.2981813 JBOPFO 1083-3668 Google Scholar
B. LiuT. J. FarrellM. S. Patterson,
“A dynamic model for ALA-PDT of skin: simulation of temporal and spatial distributions of ground-state oxygen, photosensitizer and singlet oxygen,”
Phys. Med. Biol., 55
(19), 5913
–5932
(2010). http://dx.doi.org/10.1088/0031-9155/55/19/019 PHMBA7 0031-9155 Google Scholar
J. N. Silvaet al.,
“Photodynamic therapies: principles and present medical applications,”
Biomed. Mater. Eng., 16
(Suppl 4), 147
–154
(2006). Google Scholar
C. Herkenneet al.,
“Pig ear skin ex vivo as a model for in vivo dermatopharmacokinetic studies in man,”
Pharm. Res., 23
(8), 1850
–1856
(2006). http://dx.doi.org/10.1007/s11095-006-9011-8 PHREEB 0724-8741 Google Scholar
U. Jacobiet al.,
“Porcine ear skin: an in vitro model for human skin,”
Skin Res. Technol., 13
(1), 19
–24
(2007). http://dx.doi.org/10.1111/srt.2007.13.issue-1 0909-752X Google Scholar
H. SchaeferJ. Lademann,
“The role of follicular penetration. A differential view,”
Skin Pharmacol. Appl. Skin Physiol., 14
(Suppl 1), 23
–27
(2001). http://dx.doi.org/10.1159/000056386 SPAPFF 1422-2868 Google Scholar
J. Lademannet al.,
“Investigation of follicular penetration of topically applied substances,”
Skin Pharmacol. Appl. Skin Physiol., 14
(Suppl 1), 17
–22
(2001). http://dx.doi.org/10.1159/000056385 SPAPFF 1422-2868 Google Scholar
T. Papaioannouet al.,
“Performance evaluation of fiber optic probes for tissue lifetime fluorescence spectroscopy,”
Proc. SPIE, 4958 43
–50
(2003). http://dx.doi.org/10.1117/12.476141 PSISDG 0277-786X Google Scholar
A. Paulet al.,
“Comparative study on the photosensitization of jurkat cells in vitro by pheophorbide-a and a pheophorbide-a diaminobutane poly-propylene-imine dendrimer complex,”
Laser Phys., 13
(1), 22
–29
(2003). LAPHEJ 1054-660X Google Scholar
J. Baieret al.,
“Theoretical and experimental analysis of the luminescence signal of singlet oxygen for different photosensitizers,”
J. Photochem. Photobiol. B, 87
(3), 163
–173
(2007). http://dx.doi.org/10.1016/j.jphotobiol.2007.02.006 JPPBEG 1011-1344 Google Scholar
J. Schlothaueret al.,
“In vivo detection of time-resolved singlet oxygen luminescence under PDT relevant conditions,”
Proc. SPIE, 7551 755106
(2010). http://dx.doi.org/10.1117/12.839851 PSISDG 0277-786X Google Scholar
A. Vogtet al.,
“Follicular targeting—a promising tool in selective dermatotherapy,”
J. Investig. Dermatol., 10
(3), 252
–255
(2005). http://dx.doi.org/10.1111/jds.2005.10.issue-3 JIDEAE 0022-202X Google Scholar
|


