
|
|
1.IntroductionNowadays, analytical devices have shown minimization and integration trends. Different from routine analytical methods represented by tube and microtiter plate, the micrometer-scale total analysis systems () or so called lab-chip devices, which integrate novel sensing units and offer significant advantages, such as miniaturization, saving of analyte samples, low power consumption, on-site testing, and rapidity of assay, have attracted more and more interest.1 In this work, the authors present a spectral surface plasmon resonance (SPR) sensor based biochip device. Spectral SPR sensors have become widely utilized analytical tools in biomedical research due to high performance and easy applications by using commercial spectrometer instruments.2 For multianalyte detection and parallel reference assay capabilities, sensor systems are usually designed as multichannel structures. Multichannel scan mechanisms, which employ wavelength-division multiplexing,3 multiple fiber receptors,4 and mechanical movement of optics,5 have been reported. However, these methods lead to complicated structures, more components, larger device sizes, and even induce positional regression uncertainty errors, and thus impair the convenience in on-site biomedical measurements.6 In order to alleviate these drawbacks, we designed a simple and compact multichannel SPR biochip. By using a completely nonmovement scan mechanism, three parallel channels can be scanned in time-division approach. Specially, we proposed that by exclusively using one channel to detect air, the device can provide the baseline updating capability to suppress detection errors arising from the light source instability. The device performances in biomedical sensing were demonstrated by a representative detection of human immunoglobulin G (hIgG). The results illustrated that with the baseline updating, the device provides an ideal resolution on target analyte concentration. 2.Materials and Methods2.1.DeviceThe device under the Kretschmann configuration is shown in Fig. 1. The metal film (5 nm Cr and 45 nm Au) is deposited on the BK7 glass () substrate, and three parallel channels are divided on it. Above the substrate is a FK5 glass () input optical path. In order to achieve multichannel scan without optics movements, a rectangular matching liquid chamber (10-mm length, 0.5-mm width, and 1-mm height) was designed on the FK5 optical path, as shown in Figs. 1(a) and 1(b). By changing the refractive index (RI) value of matching liquid in chamber, the incident beam can be led into different SPR channels. In our device, an AC voltage controlled piezoelectric micropump [Fig. 1(c)] was used to drive matching liquids accurately.7,8 Control voltages with different frequencies can drive different matching liquids into the chamber. Fig. 1Structure of device. (a) Side view of device and optical paths. (b) Vertical view of device and distribution of matching liquids. (c) Photograph of the device. (d) Scan states (purple: matching liquid is , scanning channel 1; green: matching liquid is , scanning channel 2; red: matching liquid is , scanning channel 3). 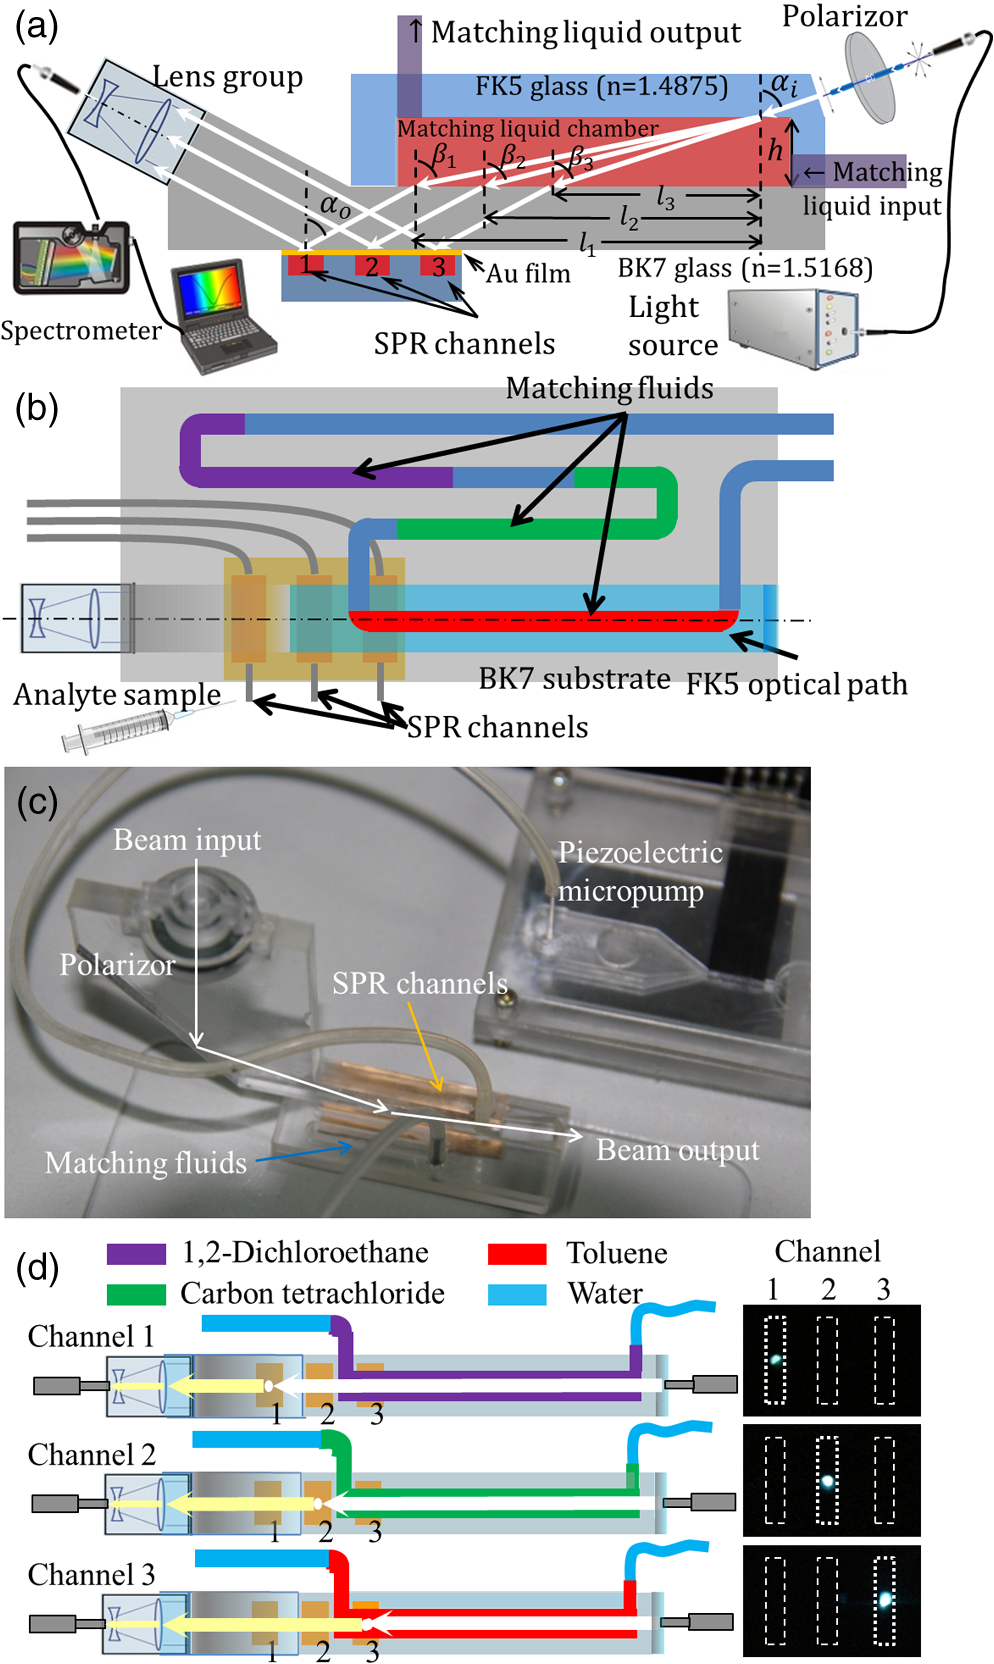 Based on previous work,8 we know that if the beam inputs with a special angle , after two refractions (enters the matching liquid from FK5 glass and leaves the matching liquid to BK7 glass), the incident SPR angle can be adjusted to an appropriate value :9 Matching liquids with different RI values provide same [assume RI value is large enough to avoid the total reflection (TR)], but different horizontal shifts : where is the RI value of matching liquids and is the height of matching liquid chamber. By timely changing matching liquids, the beam can be correspondingly deflected with different . In this work, three colorless and transparent organic solvents are used as matching liquids: 1, 2-dichloroethane (), carbon tetrachloride (), and toluene (), water segments exist between organic matching liquids to prevent volatilizing and mutual mixing. Corresponding values are , , and , respectively. The spans around 1 mm between each other are sufficient to arrange three parallel SPR channels. The photographs taken from the back side of the substrate [Fig. 1(d)] confirmed that the beam can be led to correct SPR channels.2.2.Sensitive FilmFor hIgG detections, we built a hIgG-sensitive film on the Au surface.10 The Au film was in turn immersed in a 20-mM 11-mercaptoundecanoic acid (MUA, J&K Chemical, Beijing, China) methanolic solution (5 h), an equal volume mixture of 20-mM 1-ethyl-3-[3-dimethylaminopropyl] carbodiimide hydrochloride (EDC, Alfa Aesar, Ward Hill, Massachusetts) and 50-mM -hydroxysuccinimide (NHS, Alfa Aesar, Ward Hill, Massachusetts) aqueous solutions (5 h), a streptavidin (Sigma Aldrich, St. Louis, Missouri) phosphate buffered saline (PBS) solution (1 h), and a goat anti-hIgG (Sigma Aldrich, St. Louis, Missouri) PBS solution (2 h). Then, a bovine serum albumin (BSA, Sigma Aldrich, St. Louis, Missouri) PBS solution was used to block the excess reactive groups (30 min). All operations above were operated at room temperature. 3.ExperimentsIn this work, we used light source DH-2000-BAL, optical fiber P50-2-UV-VIS, and spectrometer Maya-2000 Pro (Ocean Optics products, Dunedin, Florida) to detect reflective intensity distribution on the spectrum from 550 to 1050 nm. The spectrometer grating is HC-1, the slit width is 250 μm, and the integration time is 20 ms. Our device detects hIgG affinity by localizing the resonance wavelength of spectrogram SPR-dip, which equals the ratio between the attenuated total reflection (ATR) spectrum of hIgG solution and the incident beam spectrum (baseline).2 Because of the incident spectrum measurement needs an additional photodetector; we chose the ATR spectrum of air (air baseline) approximately instead of the baseline. Our reason is that the resonance wavelength of air is , in the resonance wavelength band of aqueous solutions () is very close to the TR spectrum. Then, the SPR-dip with a typical shape can be fitted by the Lorentzian equation to calculate the accurate resonance wavelength:11 where relates to the depth, to the asymmetry, to the position, and to the width of the SPR-dip.When a single channel is used to detect liquid samples, the air baseline only can be obtained before experiments; once liquid is in channel, it cannot be acquired any more. Consider that the air baseline inevitably drifts along with time, thus the liquid sample’s ATR spectrum also unpredictably drifts; the prestored air baseline without timely refreshment may lead to the SPR-dip distortions. In order to get rid of drift influences, we used an independent channel to supply a timely refreshed air baseline.12 In hIgG detections, we functionalized channel 1 with sensitive film to detect surface-specific affinity of hIgG, channel 2 (naked Au film) was full of air to provide baselines, and channel 3 (naked Au film) was used to detect nonspecific affinity responses. The hIgG PBS solutions at low concentrations of 5, 10, 50, were detected, respectively. The scan sequence among three channels is: and circulate so on. Every spectrum collected from channel 2 provides the air baseline for the last channel scanned before channel 2. The time interval between every two neighboring scans is 15 s. In every minute, both channels 1 and 3 are scanned once, and channel 2 provides two updated baselines for each of them. 4.Results and DiscussionFirst, we observed the air baseline drifts from channel 2. In Fig. 2, three curves are acquired by comparing three air baselines (, 10 min, 60 min) with the prestored air baseline. The amplitude averages of spectra are 0.9998, 0.9851, and 0.9769. Noise standard deviations are 0.0046, 0.0050, and 0.0062. If the air baseline does not drift, spectra should keep flat and constant amplitudes at 100% (black dotted line in Fig. 2). However, they show inconsistent fluctuations at different wavelengths. Hence, we learned that the drift leads to continuously increasing errors and impairs the localizing accuracy of resonance wavelength. In addition, we also found that the drift is not rapid; the air spectrum at shows high similarity to the prestored air baseline. Therefore, we confirmed that the air baseline updating with 15-s delay still can improve the drift influences. The hIgG responses with and without baseline updating are shown in Fig. 3, respectively. When the baselines were not timely updated, the SPR responses [upper subpanels in Fig. 3(a)–3(d)] show severe noises both in the specific channels (red curves) and the nonspecific channels (blue curves). If hIgG concentration is very low [Figs. 3(a) and 3(b)], the specific responses can hardly be identified. Particularly, the noisy responses from channel 1 and channel 3 show periodical vibrations and highly correlative waveforms. Based on these phenomena, we considered that the noises may stem from the light source instability and they could be suppressed by timely updating baseline. The SPR responses with updated baselines are shown in the lower subpanels in Figs. 3(a)–3(d)]. It is easy to learn that response performances have been significantly improved. Fig. 3SPR responses at different human immunoglobulin G (hIgG) concentrations. (a) . (b) . (c) . (d) . In every plot, the upper subpanel is response without baseline updating, the lower subpanels is response with baseline updating. In every subpanel, the red-dot curve is the specific response from channel 1, the blue-diamond curve is the nonspecific response from channel 3. 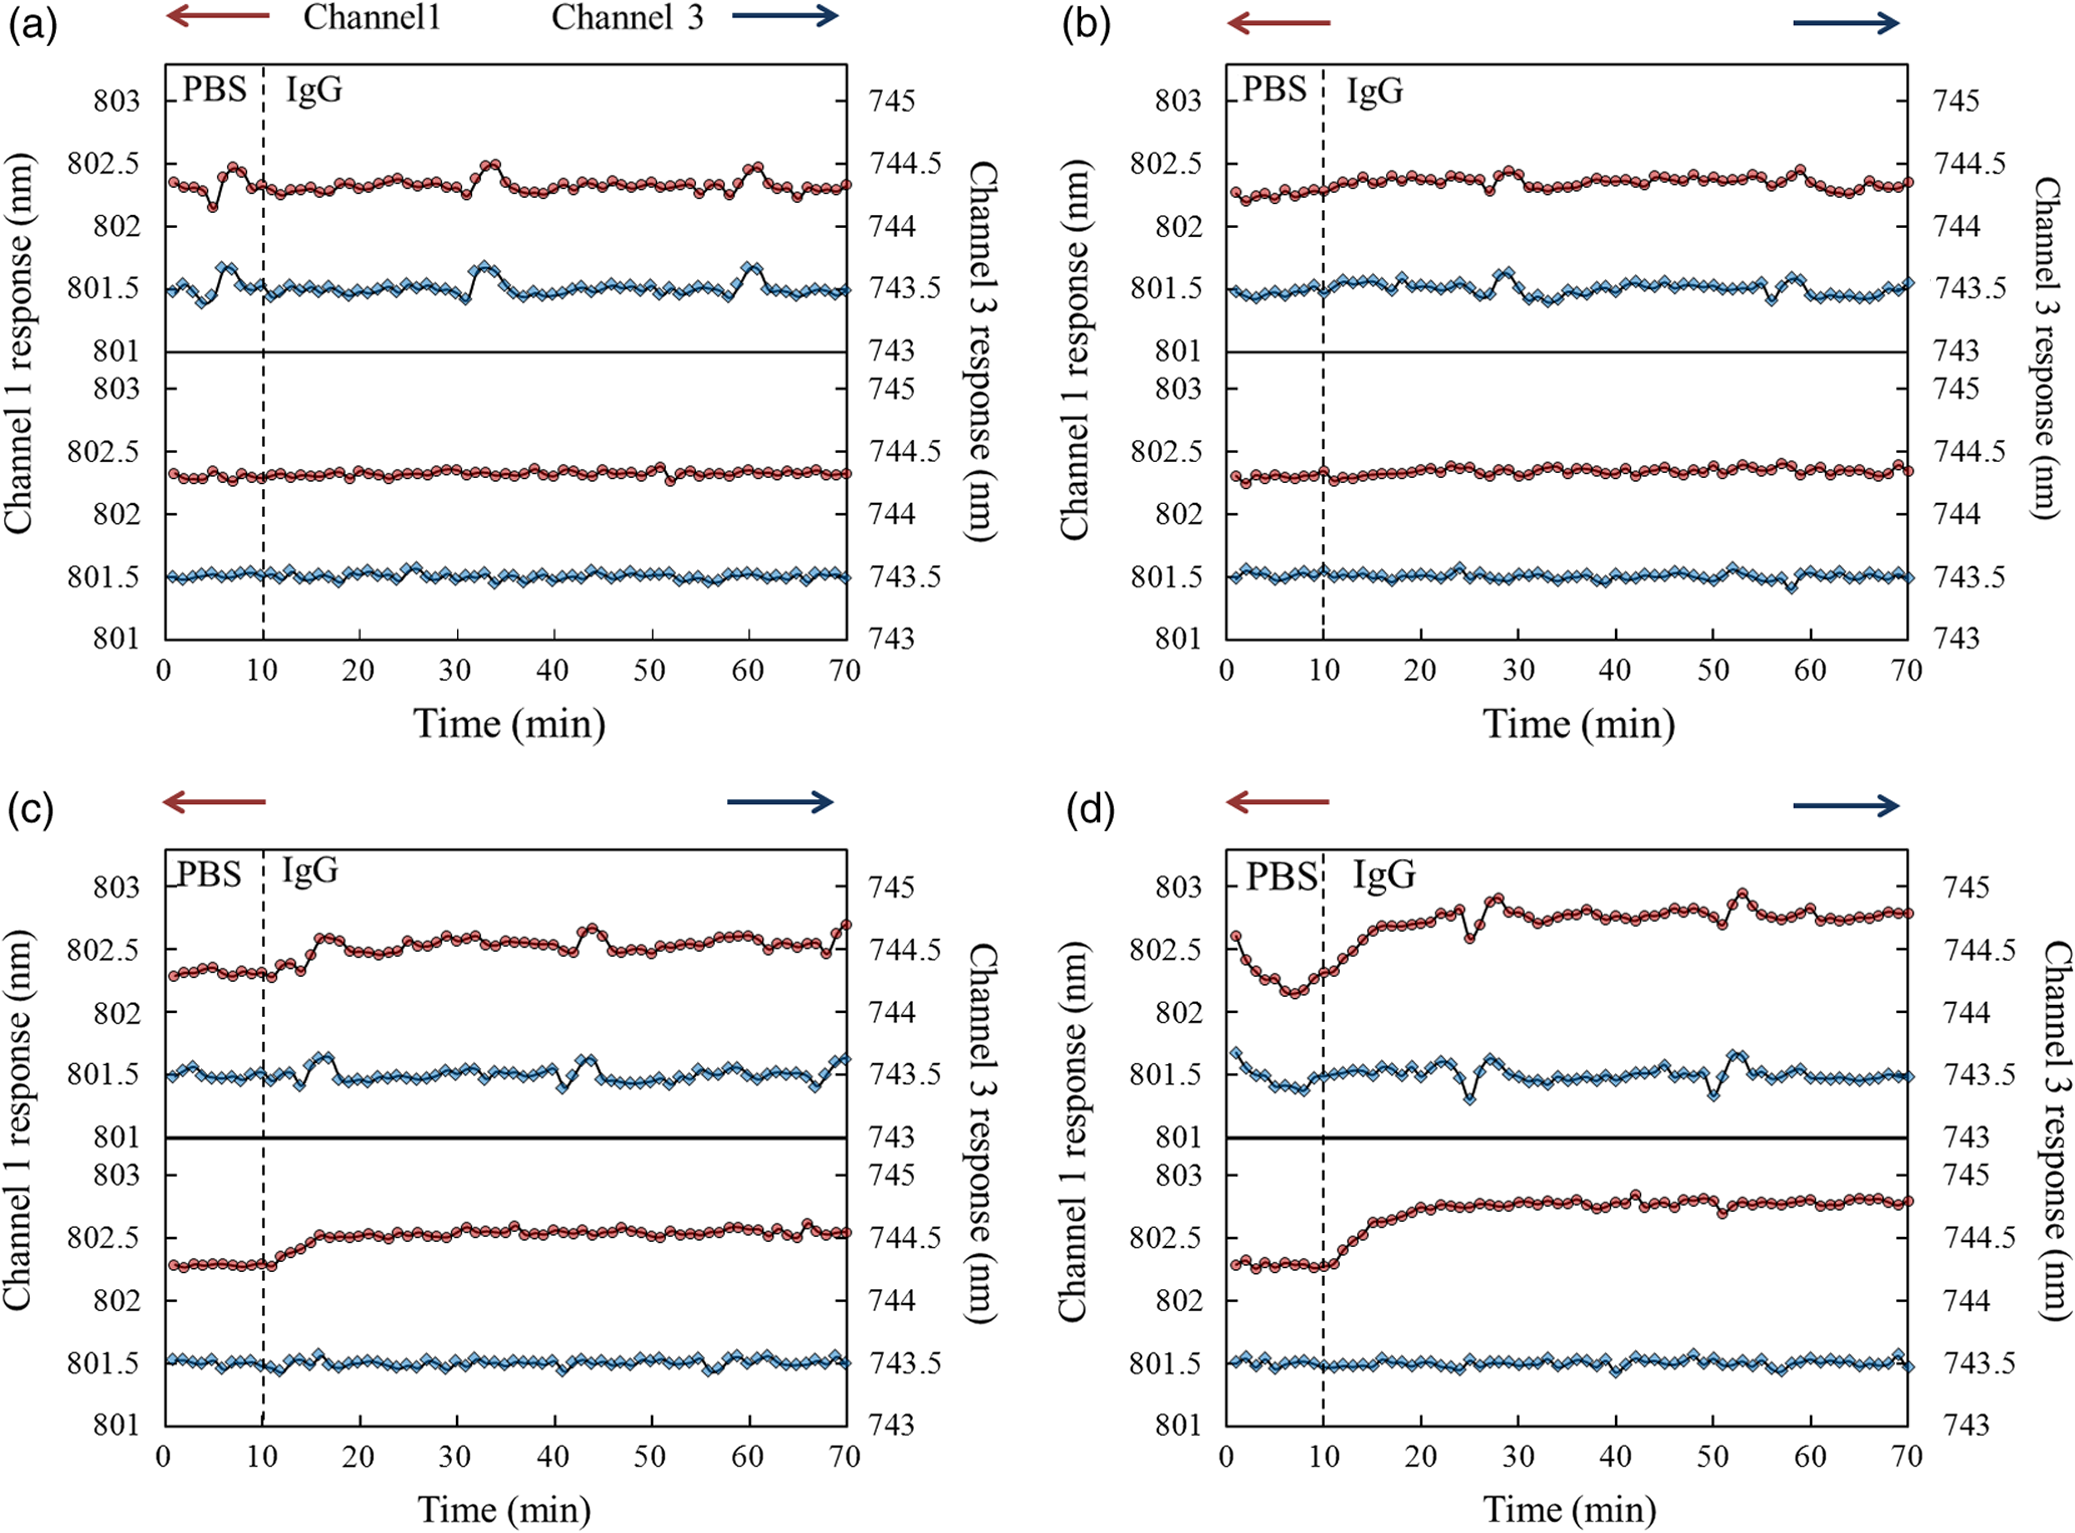 The detailed statistical information of Fig. 3 is given in Table 1. For presenting the SPR responses of hIgG-specific interactions on the sensitive film surface (eliminating nonspecific absorption and bulk response effects), we chose , the relative shift of resonance wavelength responses from channel 1 (specific responses) and channel 3 (nonspecific responses), as the output. Without timely baseline updating, the largest standard deviation wavelength responses are 0.143 nm. By using updated baselines, the largest standard deviation is decreased to 0.027 nm. Table 1Statistics of wavelength responses.
Further, we know that the relationship between and hIgG concentration can be described by Langmuir absorption isotherm.13 When is very low, it can be deemed to an approximately proportional relationship: where is the equilibrium binding rate, is the equilibrium dissociation constant, is the sensitivity, and is the intercept.Two linear fitting lines are presented in Fig. 4. Without baseline updating (bule line), the fitting goodness is . The sensitivity (slope) is . Thus, the concentration resolution2 of hIgG can be estimated by the worst standard deviation: . Referring to the “” rule, the limitation of detection (LOD) of hIgG can be defined as: . Correspondingly, with the baseline updating, and . The new concentration resolution is enhanced up to and . 5.ConclusionIn summary, we developed an on-chip multichannel spectral SPR device for biomedical detections. Experimentally, we demonstrated that the novel nonmovement scan design simultaneously provides specific reaction responses, nonspecific responses, and updated baselines. With timely updated baselines, noises due to the light intensity fluctuation can be efficiently suppressed. Hence, the device gives a highly improved LOD of hIgG. Compare to conventional multichannel scan mechanisms, here the parallel scan, which is achieved by optical media changing, overcomes the positional regression uncertainty and makes the device simpler and more reliable. AcknowledgmentsThis work is supported by Natural Science Foundation of China (61271099), Natural Science Foundation of Tianjin (12JCZDJC20400), and National Research Foundation for Doctoral Program of Higher Education of China (20120031110031). Besides, C.W. appreciates the national scholarship (201206200032) from China Scholarship Council. ReferencesD. JanasekJ. FranzkeA. Manz,
“Scaling and the design of miniaturized chemical-analysis systems,”
Nature, 442
(7101), 374
–380
(2006). http://dx.doi.org/10.1038/nature05059 NATUAS 0028-0836 Google Scholar
M. PiliarikJ. Homola,
“Surface plasmon resonance (SPR) sensors: approaching their limits?,”
Opt. Express, 17
(19), 16505
–16517
(2009). http://dx.doi.org/10.1364/OE.17.016505 OPEXFF 1094-4087 Google Scholar
J. DostálekH. VaisocherováJ. Homola,
“Multichannel surface plasmon resonance biosensor with wavelength division multiplexing,”
Sensor Actuator B: Chem., 108
(1), 758
–764
(2005). http://dx.doi.org/10.1016/j.snb.2004.12.096 SABCEB 0925-4005 Google Scholar
J. Homolaet al.,
“A novel multichannel surface plasmon resonance biosensor,”
Sensor Actuator B: Chem., 76
(1), 403
–410
(2001). http://dx.doi.org/10.1016/S0925-4005(01)00648-7 SABCEB 0925-4005 Google Scholar
J. Homolaet al.,
“Multi-analyte surface plasmon resonance biosensing,”
Methods, 37
(1), 26
–36
(2005). http://dx.doi.org/10.1016/j.ymeth.2005.05.003 MTHDE9 1046-2023 Google Scholar
B. Sutapunet al.,
“A multichannel surface plasmon resonance sensor using a new spectral readout system without moving optics,”
Sensor Actuator B: Chem., 156
(1), 312
–318
(2011). http://dx.doi.org/10.1016/j.snb.2011.04.038 SABCEB 0925-4005 Google Scholar
W. Zhanget al.,
“Travelling-wave piezoelectric micropump with low resistance microchannel,”
Electron. Lett., 47
(19), 1065
–1066
(2011). http://dx.doi.org/10.1049/el.2011.2035 ELLEAK 0013-5194 Google Scholar
C. Wanget al.,
“Time-division self-referencing multichannel spectral SPR sensor without mechanical scanning,”
Electron. Lett., 49
(7), 493
–495
(2013). http://dx.doi.org/10.1049/el.2012.4172 ELLEAK 0013-5194 Google Scholar
G. GuptaJ. Kondoh,
“Tuning and sensitivity enhancement of surface plasmon resonance sensor,”
Sensor Actuator B: Chem., 122
(2), 381
–388
(2007). http://dx.doi.org/10.1016/j.snb.2006.06.005 SABCEB 0925-4005 Google Scholar
E. C. A. StigterG. J. de JongW. P. Van Bennekom,
“An improved coating for the isolation and quantitation of interferon- in spiked plasma using surface plasmon resonance (SPR),”
Biosens. Bioelectron., 21
(3), 474
–482
(2005). http://dx.doi.org/10.1016/j.bios.2004.11.008 BBIOE4 0956-5663 Google Scholar
P. TobiškaJ. Homola,
“Advanced data processing for SPR biosensors,”
Sensor Actuator B: Chem., 107
(1), 162
–169
(2005). http://dx.doi.org/10.1016/j.snb.2004.09.040 SABCEB 0925-4005 Google Scholar
F. Bardinet al.,
“Surface plasmon resonance spectro-imaging sensor or biomolecular surface interaction characterization,”
Biosens. Bioelectron., 24
(7), 2100
–2105
(2009). http://dx.doi.org/10.1016/j.bios.2008.10.023 BBIOE4 0956-5663 Google Scholar
D. R. Gondimet al.,
“Dye ligand epoxide chitosan/alginate: a potential new stationary phase for human IgG purification,”
Adsorpt. Sci. Technol., 30
(8), 701
–712
(2012). http://dx.doi.org/10.1260/0263-6174.30.8-9.701 ASTEEZ 0263-6174 Google Scholar
|
|||||||||||||||||||||||||||||


