|
|
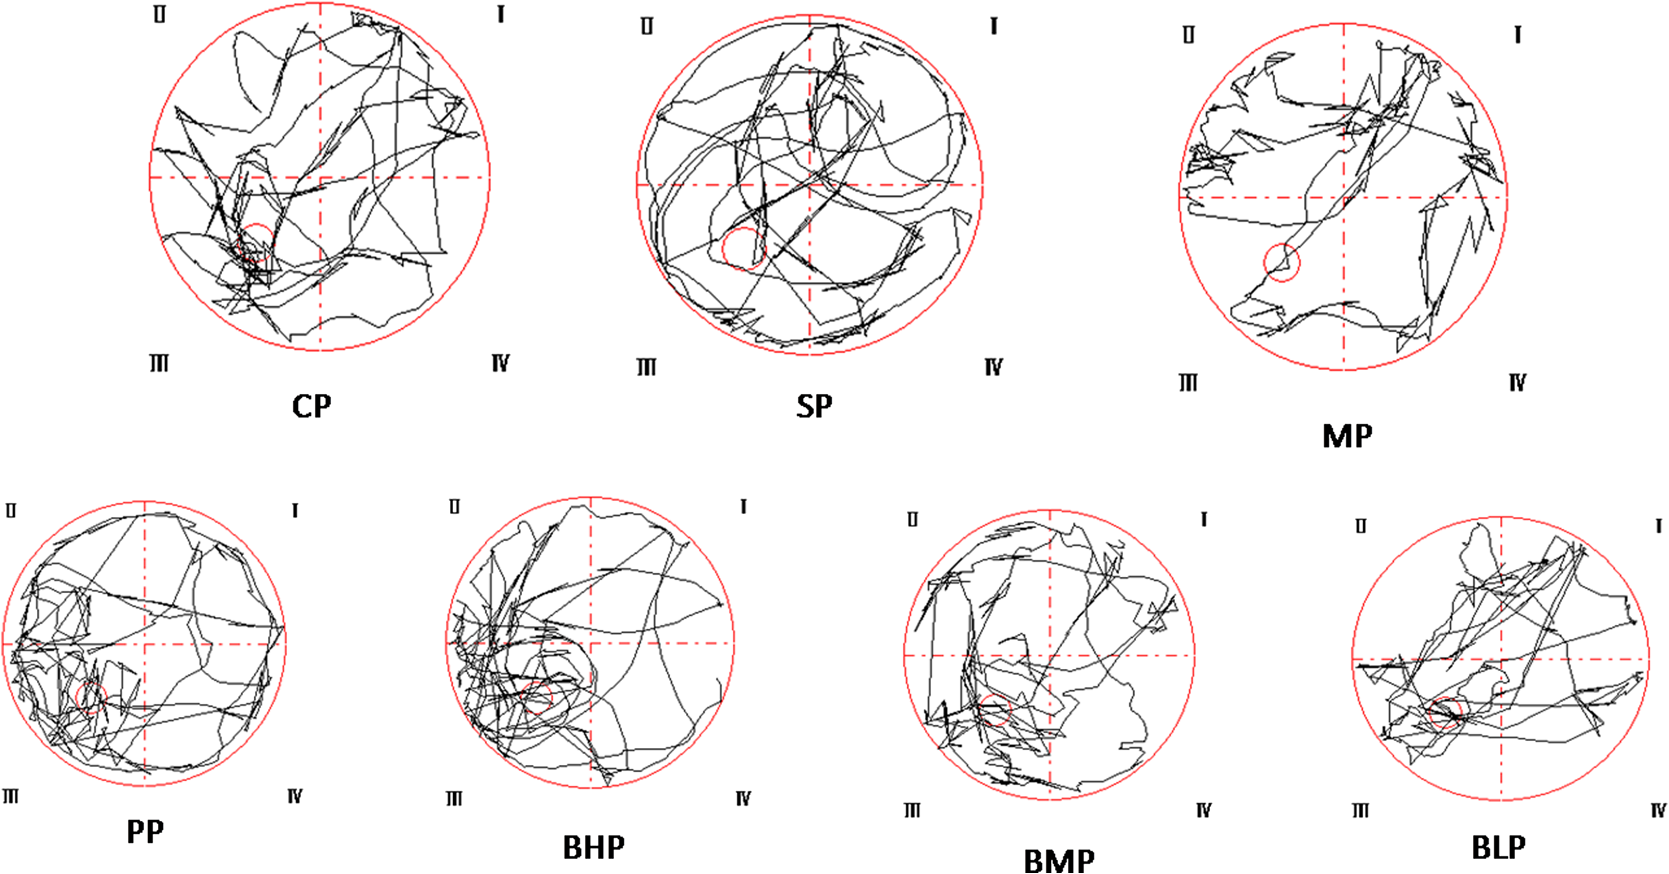
1.IntroductionAlzheimer’s disease (AD) is the fifth leading cause of death in older people and is the most common cause of dementia (up to 75%), with approximately 26 million affected individuals world-wide estimated to reach 115 million by 2050.1–4 As such, it has become a serious social problem and has attracted considerable attention in the medical profession. AD is an irreversible and progressive brain disease, which can be diagnosed using behavioral observations and the gold standard for confirmation relies on neuropathologic findings of -amyloid plaques and intraneuronal neurofibrillary tangles upon autopsy examination.5 Therefore, identifying clinical manifestations of risk factors related with the AD are critically needed for early diagnosis, prognostics, and preventive care of AD. Currently, the known risk factors of AD are advancing age, family history, gender, APOE allelic variant, cardiovascular factors, mild cognitive impairment, life style, and head trauma, which were investigated through large-scale epidemiological studies.6–11 However, these factors have relatively weak predictive effects. It is still necessary to find more potential risk factors which may contribute to AD development.3 Some of the biochemical abnormalities present in the AD brains have been found in other body tissues and fluids, especially in platelets, consequently it has been hypothesized that AD was a systemic disease. In addition platelets have the following similarities with neurons: (1) they contain the amyloid precursor protein and secrete -amyloid peptide,12,13 (2) they express neurotransmitters and some neuron-related proteins, such as -methyl-d-aspartate receptors.14 Studies also provide evidence that six clinical traits are significantly associated with the erythrocyte sedimentation rate of AD,15 and that measurement of red blood cell anion exchange may be useful in classifying patients with AD.16 It has been suggested that mitochondrial dysfunction and defects in membrane structure could be implied in AD pathogenesis, and the membrane fluidity is lower in AD samples and there are similar membrane fluidity in erythrocytes from AD patients and aged-matched controls.17 All the studies provide evidence that it is very possible to develop a method to detect the blood variations associated with the AD diagnosis, and if positive, this could be used as a prognostic marker. Confocal micro-Raman spectroscopy, which is a nondestructive technique, and a combination of Raman spectroscopy and confocal microscopy, based on the principle of inelastic scattering,18 provides information about the molecular compositions, molecular structures, and molecular interactions in cells and tissues. The unique pattern of changes in the vibrational state of a molecule under laser excitation in a specific environment constitutes a chemical “fingerprint” to identify and characterize biomolecules in various conformations or states. Raman spectroscopy has proven extremely versatile and has a vast array of applications in biomedical science.19–25 Thus, in this study, the confocal micro-Raman spectroscopy with the high resolution and spatial filtering ability is used to detect the variants of erythrocyte in the neurotoxicity rats induced by , to develop a method for the association of AD diagnosis, and if positive, can be used as a prognostic marker, and then used to investigate the protective effect of bajijiasu26 against -induced neurotoxicity rats via the variants of the erythrocyte in vivo. 2.Materials and Methods2.1.SubjectsAdult male Sprague–Dawley rats (180–220 g, obtained from Center of Laboratory Animal of Guangzhou University of Chinese Medicine, SCXK [Yue] 2008-0020, SYXK [Yue] 2008-0085) were pair-housed in plastic cages in a temperature-controlled (25°C) colony room on a 12/12-h light/dark cycle. Food and water were available ad libitum. All experiment protocols were approved by the Center of Laboratory Animal of Guangzhou University of Chinese Medicine. All efforts were made to minimize the number of animals used. 2.2.Drugs and Treatment ProceduresThe (A4559-1mg) was purchased from Sigma–Aldrich Inc. (St. Louis, Missouri, USA), dissolved in stroke-physiological saline solution to the concentration of stored at and hatched at 37°C for 4 days before being used. All other reagents and chemicals used in this study were of analytical grade. 2.3.Model Preparation and TreatmentThe procedures were similar to those described previously.27 Rats were intraperitoneally anesthetized with pentobarbital sodium (, i.p.; Sigma–Aldrich) and placed in a stereotaxic frame (RWD Life Science Co., Ltd., Shenzhen, China). The hair was shaved, and the scalp was opened, and then holes were drilled with an electric dental drill (brushless motor, 30,000 rpm) according to a mouse brain atlas (AP-3.6 mm, , DV3.0 mm). Then, 5 μL (10 μg) of (fibrillar state) was slowly injected into the CA1 region of the hippocampus over 5 min and the needle was kept in for 5 min. Then, the wound was sutured and penicillin () was injected intramuscularly to protect against infection. Then, the rats were isolated in a warm box until they recovered consciousness. After 15 days, the rats were screened by water maze tests to select models that are up to the standard. Then, they were divided into seven groups randomly. The seven groups are as follows: treatments control group (no but distilled water was given as oral), sham-operation group (just do the surgery no was given, while distilled water was given as oral), model group ( and distilled water were given as oral), positive group [donepezil HCl, , as oral], low-dose group [BJ, , as oral], medium-dose group [BJ, , as oral], and high-dose group [BJ, , as oral]. Every group had eight animals and the experiments lasted 25 days. Rat spatial learning and memory abilities were tested in the Morris water maze (MWM, DMS-2, Chinese Academy of Medical Sciences Institute of Medicine) using procedures similar to those described previously.28–30 The MWM consisted of a circular fiberglass pool (200-cm diameter) filled with water () that was made opaque by nontoxic black paint. The pool was surrounded by light blue curtains and three distal visual cues were fixed to the curtains. Four floor light sources of equal power provided a uniform illumination to the pool and testing room. A charge coupled device camera suspended above the center of the pool recorded animal swim paths, and video output was digitized by an EthoVision tracking system (Noldus, Leesburg, Virginia, USA). The water maze tests included three periods: initial spatial training, spatial reversal training, and the probe test. 2.4.Preparation of Erythrocytes and Enzymatic AssaysAfter the rats have been treated for 15 days, fresh blood was obtained by arteriopuncture and then collected in a lithium-heparinized anticoagulant tube. The erythrocytes were obtained from the anticoagulant blood samples by centrifugation at 3000 rpm for 5 min at 4°C. The buffy coat was removed and then erythrocytes were washed three times with phosphate-buffered saline. The supernatant fluid of fresh blood samples was stored at until they were used. The activities of malondialdehyde (MDA), superoxide dismutase (SOD), catalase (CAT), and glutathione reductase (GSH-Px) were measured with detection kits. Protein concentrations were determined using the Coomassie Brilliant Blue G250 assay. The kits were all purchased from Nanjing Jiancheng Bioengineering Institute (Nanjing, Jiangsu, PR China). The procedures were performed according to the manufacturer’s instructions. The levels were normalized to the protein concentration of each sample and expressed as a percentage of nontreated controls. 2.5.Raman SpectraThe erythrocyte samples were placed on a silicon slice for Raman scanning. There were no extra Raman peaks in the region of on the silicon slice. The Via Plus laser micro-Raman spectroscopy system was purchased from the Renishaw Company. The resolution of this instrument is . All the Raman spectra were recorded for 10 s and 3 accumulations. A laser of 785 nm was chosen and 5% laser exposed which was much lower than the safe limit of exposure. All the data were collected under the same conditions and the instrument was calibrated by silicon at the band. 2.6.Data AnalysisIn order to compare the related spectrum changes, we chose the intensity of phenylalanine band () to normalize the spectrum. At least five spectra were obtained from each sample. Then, the spectrum was baseline corrected by the software R2.8.1 (provided by Renishaw), smoothed, normalized, and averaged by Origin 8.0 (OriginLab Crop., Northampton, Massachusetts, USA). Statistical Package for the Social Science (SPSS 17.0, SPSS Inc., Chicago) was used for statistical analysis in this study. The spectra recorded were statistically analyzed by principal component analysis (PCA). PCA is oriented toward modeling a variance–covariance structure of a data matrix from which the eigenvalues corresponding to principal components were extracted. Each principal component (PC) was a linear combination of the independent wavenumber variables . For example The first PC (PC1) accounts for the greatest variance which corresponds to the largest eigenvalue. The second PC (PC2) is orthogonal to all those preceding and accounts for a decreasing proportion of the variance. In this paper, we chose the first three PCs which have accounted for of the accumulative total contribution for analysis. 3.Results and Discussion3.1.Effect of Bajijiasu on BehaviorThe initial spatial training results are shown in Fig. 1, which demonstrate that injecting into CA1 could cause memory loss and that the surgery did not cause any side effects. Compared with the model group, the incubation period for each BJ-treated group was significantly shorter. The variation in total swimming distance in each group was similar to the variation observed for the latency period. Compared to the model group, the differences of all BJ-treated groups were significant (). However, the differences were not significant compared to the control group (), and the average swimming speed was similar among all groups (). Fig. 1Effect of bajijiasu on escape latency of -treated rats in the MWM. The graph Control, control group; Sham, sham-operation group; Model, model group; Positive, positive group [ , ]; BJ-8 mg, low-dose BJ group [ ]; BJ-24 mg, medium-dose BJ group [ ]; BJ-48 mg, high-dose BJ group [ ]. Values given are the (). 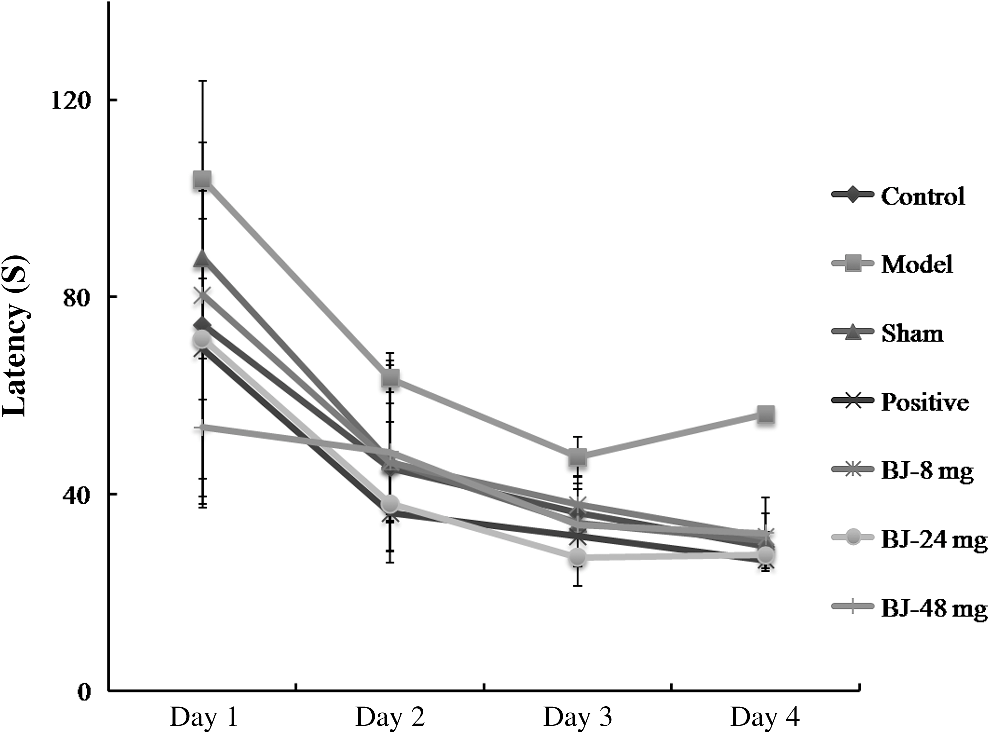 Probe test results showed that there was no significant difference () among the groups with regard to total swimming distance or speed. Compared to the control group, the differences of all BJ-treated groups were significant (), as shown in Figs. 2, and 3, the swimming trajectory of the BJ-high dose group was obviously denser in the NW quadrant than the others. All the results suggest that bajijiasu could ameliorate -induced learning and memory dysfunction in the rat model. Fig. 2The swimming time in the platform quadrant during the spatial probe test. The graph Control, control group; Sham, sham-operation group; Model, model group; Positive, positive group [ , ]; BJ-8 mg, low-dose BJ group [ ]; BJ-24 mg, medium-dose BJ group [ ]; BJ-48 mg, high-dose BJ group [ ]. Values given are the (), # versus control group, * versus model group, ** versus model group.  3.2.Raman Spectra of Normal ErythrocyteA typical Raman spectrum of normal erythrocyte is shown in Fig. 4. We had known that the Raman peaks of erythrocyte mostly come from the intracellular hemoglobin and erythrocyte membrane. The spin state marker region of hemoglobin appeared at 1547, 1566, 1585, and . Various pyrrole ring vibration modes of hemoglobin were observed at 896, 1398, 1374, and . The vinyl in-plane C–H bending mode appeared at . The deformation modes, primarily from amino acid side chains of membrane protein, appeared at . The peak at is assigned to C–C twist and symmetric C–C stretch of phenylalanine ring. The complete Raman frequency assignment of spectra recorded is presented in Table 1.31–39 Fig. 4Raman spectrum of the normal control erythrocytes which were smoothed, normalized, and averaged from eight samples and five spectra of each sample.  Table 1Raman frequencies and assignments of the erythrocyte of normal control group rats.
Note: Abbreviations: ν: in-plane modes, γ: out of plane modes, str: stretching, δ: bending vibration, υ: cycle oscillations 3.3.Raman Spectra of Model Erythrocyte in Rats Induced byOxidative stress is defined as a disturbance of the balance between the production of reactive oxygen species (ROS) and antioxidant defense systems. Excessive ROS production is known to cause oxidative damage to major macromolecules in cells, including DNA, lipids, and proteins, which disrupts cellular functions and integrity40,41 and can result in cell death and tissue damage. ROS are implicated in several diseases, including cancer, diabetes, cardiovascular diseases, and aging. Previous studies indicated that oxidative damage is an early factor in ADs.42–44 Therefore, it may be possible to stop AD progression with antioxidants and amyloid treatment causing a significant increase in ROS.45–46 In this study, caused a marked accumulation of the lipid peroxidation product MDA, and reduced GSH-Px, CAT, and SOD expression (, compared with and expressed as percentage of normal control controls), as shown in Fig. 5. Fig. 5Effect of SOD, MDA, CAT, and GSH-Px levels on the serum of -induced model rats. The graph Normal, normal control group; Sham, sham-operation group (animals underwent surgery but did not receive ); Model, model group (10 μg was given), Positive, positive group [ , ]; BJ-8 mg, low-dose BJ group [ ]; BJ-24 mg, medium-dose BJ group [ ]; BJ-48 mg, high-dose BJ group [ ]. Values given are the () and expressed as percentage of normal control controls, # versus control group, * versus model group, ** versus model group.  Free radicals are the product of metabolism in cells. Under normal circumstances, the free radicals can be used by the immune system to kill the pathogen. However, in some conditions (drug decoys, ultraviolet radiation, high temperature exposure, and so on), the content of free radicals will increase sharply. This will induce oxidation pressure in cells and then damage cells’ structure. The Raman spectrum of normal erythrocyte and the model erythrocytes of the rats induced by were shown in Fig. 3, which showed that under oxidative pressure, the s–s makers of the model erythrocyte around the region were increased obviously compared with the normal. This result is consistent with the fact that the oxidative stress leads to the increase of concentration of disulfide bridges within the erythrocytes. Meanwhile, the formation of protein–ss–glutathione mixed disulfide is expected to be formed inside the cells as a response to oxidative stress.47 On the other hand, there is a decrease of the intensity in the high spin (deoxygenated-Hb) marker band at , and an increased intensity at the peak which arises from as a sign of concentration of . The results suggested that the oxidative damage of the blood from the model rats induced by can be detected by the Raman spectra, and showed the same results as in Fig. 6. Fig. 6The Raman spectra of the erythrocyte on the -induced model rats. The graph Normal, normal control group; Sham, sham-operation group (animals underwent surgery but did not receive ); Model, model group (10 μg was given), while (a) is the normal control compared with the model and (b) is the sham-operation compared with the normal control. 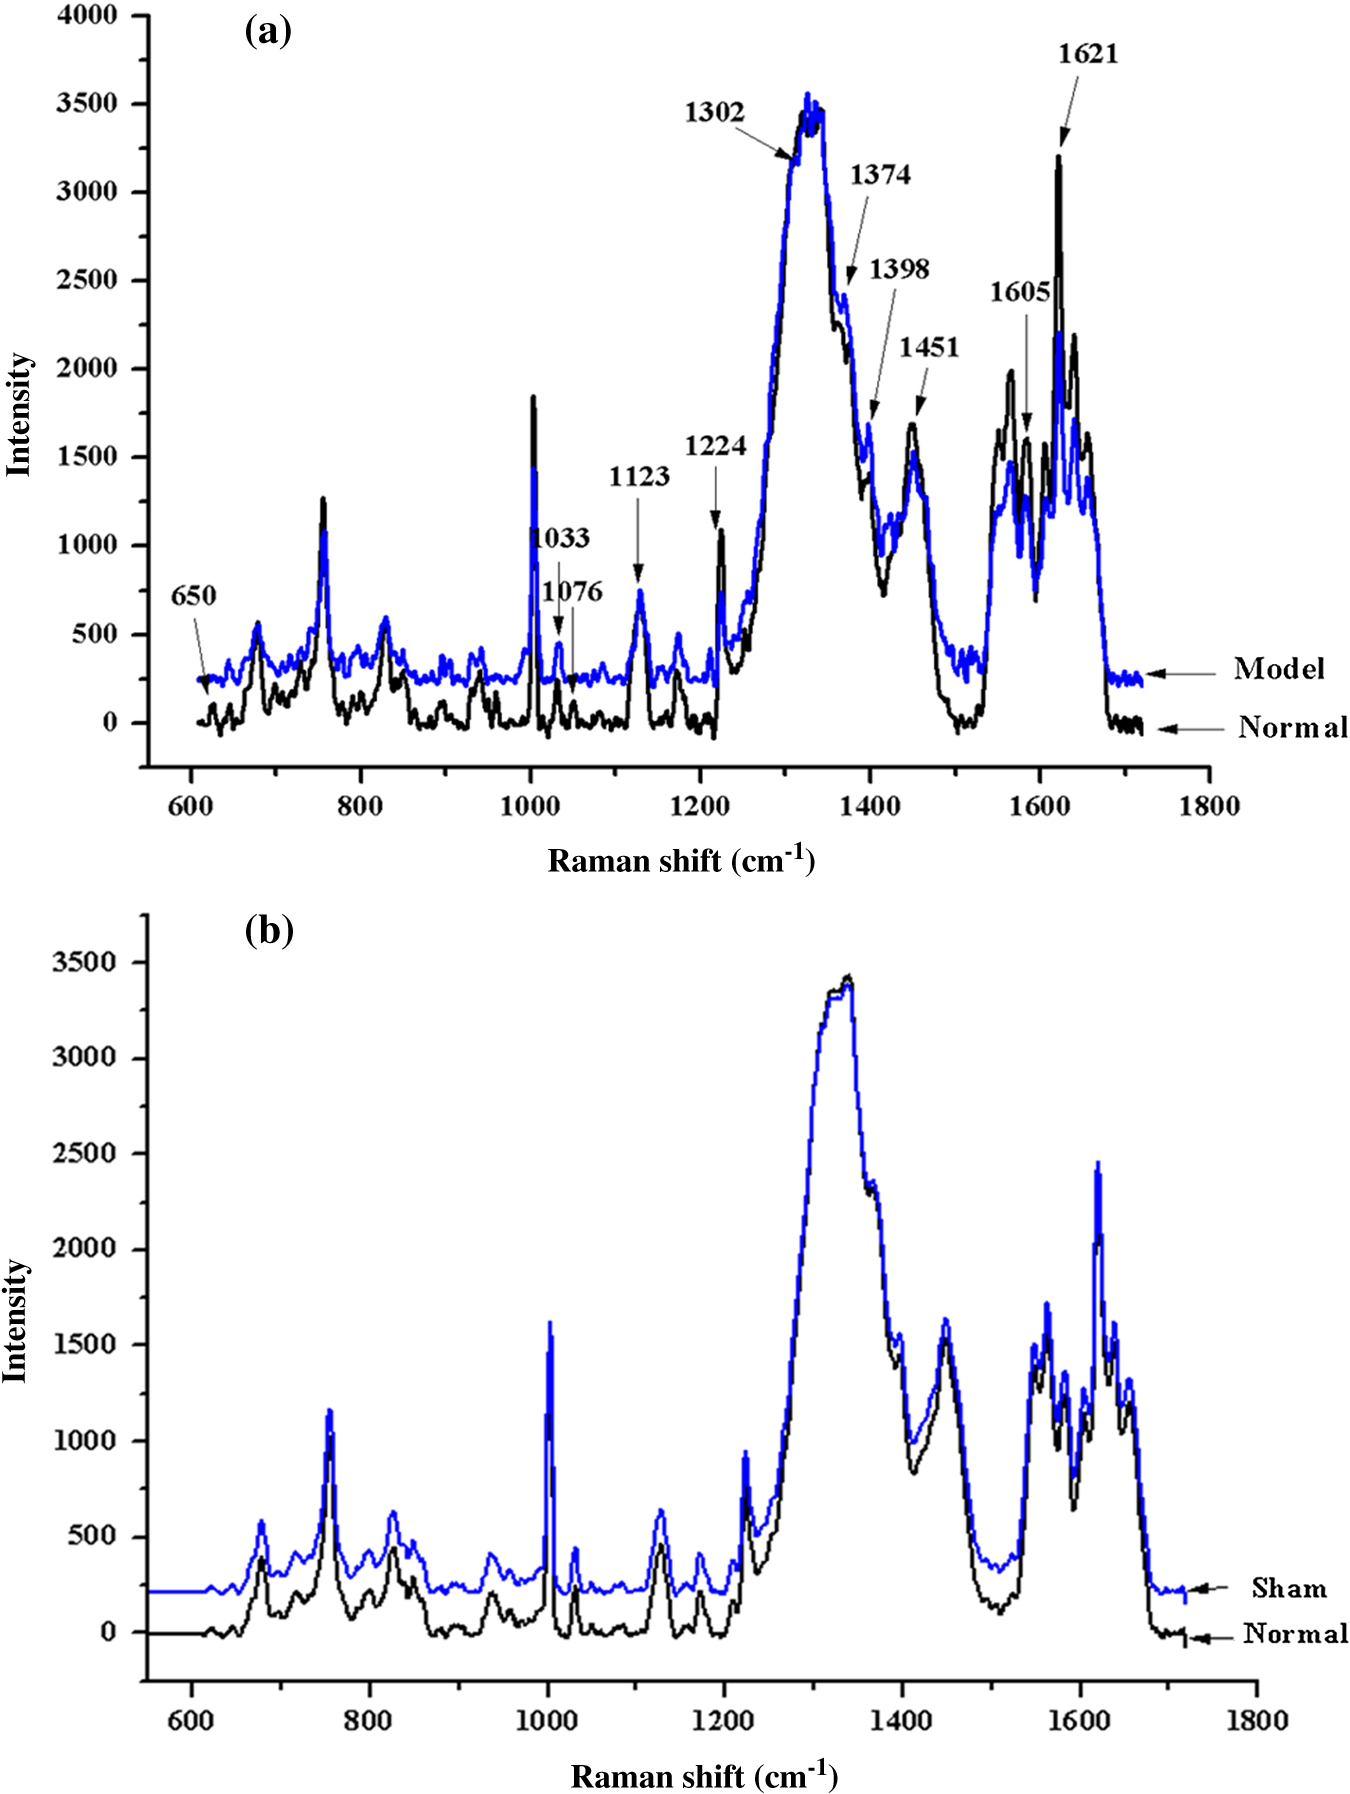 Erythrocyte membrane lipids are constituted of phospholipid bilayer and together with the unsaturated fatty acid, ensures the liquidity of membrane. The liquidity of membrane relates to the deformability and ionic permselectivity of the erythrocytes. This function can ensure the normal work of erythrocyte even if in blood capillary. Therefore, erythrocytes can carry oxygen to every tissue of body and then provide energy. Some of the Raman spectra of erythrocytes come from the membrane lipids and membrane protein, as the Raman peaks at 1123 and belong to the trans stretching vibrations of CAC skeleton and the peak at is assigned to the gauche vibrations of CAC skeleton48,49 which are very sensitive to the change of the conformation of membrane lipids. The more content the of the trans conformation the higher the order of vertical chain. And more content of the trans conformation also results in less liquidity of the erythrocyte membrane. As shown in Fig. 6(a), the Raman peaks that belong to the membrane lipids or membrane protein of the model group were different from that of the normal control, which suggested that the structure and performance of the erythrocyte membrane had changed. All the data showed the same results as in Fig. 5, the lipid peroxidative products of MDA, GSH-Px, CAT, and SOD expression were changed. Amide III is a sensitive mode in the conformation of the main chain in the membrane protein. Some of its peaks had change after induced by , as shown in Fig. 6; the Raman peaks around which assigned to amide III was discussed49 and the quantity decreased, the peak at that belongs to protein amide I showed the same reaction. At the same time, the Raman intensity of peak at assigned to random coil increased, which indicated that the secondary structure of the main chain in membrane protein has been destroyed. Not only the main chain, but also the side chain of the erythrocyte membrane protein had been damaged by . In the normal control erythrocyte membrane, there was one obvious Raman peak at , which belongs to stretch in the side chain. The structure and the content of chemical groups in the side chain of the membrane will affect the tertiary structure of protein. The decreased content of indicated that the CAH bond has been damaged, which was induced by . And the previous studies showed that erythrocyte anion exchange of citrate is abnormal in AD, and the erythrocyte sedimentation rate is significantly associated with the clinical traits of AD,15–16 above all, the side chain of membrane protein of the rats induced by had been changed. 3.4.Principal Component AnalysisAs shown in Fig. 7, we can see that the Raman spectra fingerprints of the erythrocyte of model group were obviously different from those of the normal control. In order to distinguish the Raman spectra of erythrocyte variants of normal control group and model group, PCA was employed. The results were shown in Fig. 7, which depicts the plot between scores of the PC1 and the PC2 26 Raman spectra of control group and 27 of the model group that were used for PCA. The plots showed that almost all the Raman spectra of the control group were located at the bottom left, while those of model group were at the opposite, and the analysis results showed a good classification compared with the other method. 3.5.Protective of Bajijiasu on the ErythrocyteBased on PCA of the full Raman range, samples with varying percentages of erythrocyte with oxidative damage could be separated and identified. After being treated with bajijiasu, the Raman spectra fingerprints of the erythrocyte were close to those of the normal control, and the BJ-48 mg groups’ were almost the same as those of the normal control, as shown in Figs. 8 and 5. The results of this study suggested that the method to detect the variants of the erythrocyte in a rat model of -induced neurotoxicity based on micro-Raman spectroscopy was useful, and bajijiasu could be used as a potential drug treatment for AD. 4.ConclusionThe value of any diagnostic test rests on its ability to provide information which affects patient management. In the current medical economic climate, new diagnostic tests are given much more scrutiny than in the past years. Tests that do not provide information on prognosis or which help direct patient care do little other than drive up the cost of medical care. Micro-Raman spectroscopy provides a highly sensitive way to characterize the changes of the structure of the erythrocyte in a rat model induced by . In this study, the results showed that the intensity of Raman peaks around the region belong to the s–s makers were increased obviously, the peak at corresponds to the high spin (deoxygenated-Hb) marker, and the peak at arises from as a sign of concentration of , which indicated the levels of oxidative damage. At the same time, the peaks at 1123 and are associated with the trans stretching vibrations of the CAC skeleton, and the peak at is assigned to the gauche vibrations of the CAC skeleton. Peaks around (-helix of amide III), (protein amide I), and ( stretch) have also changed, which indicated that the variants of erythrocyte membrane protein has occurred in the -induced model rats. And the further PCA was successfully used to classify the Raman spectra of normal control and model group, and bajijiasu can make these changes recover. Our study also suggested that erythrocyte variants detected using Raman spectroscopic should be tested in a specific longitudinal study for association with AD diagnosis, and if positive, can be used as a prognostic marker. AcknowledgmentsThis work was supported by the financial support from China National Ministry of Science and Technology plan projects (2011BAI01B02) and Guangdong Science and Technology plan projects (2012A030100005), and Guangdong Natural Science Foundation Grant No. (S2013040016159) and HaiNan province Science and Technology Agency Grant No. 090603. ReferencesA. M. Miniñoet al.,
“Deaths: final data for 2008,”
Natl. Vital Stat. Rep., 59
(10), 1
–126
(2011). 1551-8922 Google Scholar
L. E. Hebertet al.,
“Alzheimer disease in the US population: prevalence estimates using the 2000 census,”
Arch. Neurol., 60
(8), 1119
–1122
(2003). http://dx.doi.org/10.1001/archneur.60.8.1119 ARNEAS 0003-9942 Google Scholar
J. Povovaet al.,
“Epidemiological of and risk factors for Alzheimer’s disease: a review,”
Biomed. Pap. Med. Fac. Univ. Palacky. Olomouc. Czech. Repub., 156
(2), 108
–114
(2012). http://dx.doi.org/10.5507/bp.2012.055 Google Scholar
K. Andersenet al.,
“Gender differences in the incidence of AD and vascular dementia: the EURODEM studies. EURODEM Incidence Research Group,”
Neurology, 53
(9), 1992
–1997
(1999). http://dx.doi.org/10.1212/WNL.53.9.1992 NEURAI 0028-3878 Google Scholar
L. Fratiglioniet al.,
“Risk factors for late-onset Alzheimer’s disease: a population-based, case-control study,”
Ann. Neurol., 33
(3), 258
–266
(1993). http://dx.doi.org/10.1002/ana.410330306 ANNED3 0364-5134 Google Scholar
S. T. PendleburyP. M. Rothwell,
“Prevalence, incidence, and factors associated with pre-stroke and post-stroke dementia: a systematic review and meta-analysis,”
Lancet Neurol., 8
(11), 1006
–1018
(2009). http://dx.doi.org/10.1016/S1474-4422(09)70236-4 LNAEAM 1474-4422 Google Scholar
R. A. Whitmeret al.,
“Central obesity and increased risk of dementia more than three decades later,”
Neurology, 71
(14), 1057
–1064
(2008). http://dx.doi.org/10.1212/01.wnl.0000306313.89165.ef NEURAI 0028-3878 Google Scholar
A. Solomonet al.,
“Midlife serum cholesterol and increased risk of Alzheimer’s and vascular dementia three decades later,”
Dement. Geriatr. Cogn. Disord., 28
(1), 75
–80
(2009). http://dx.doi.org/10.1159/000231980 DGCDFX 1420-8008 Google Scholar
H. C. Hendrieet al.,
“The NIH cognitive and emotional health project. Report of the Critical Evaluation Study Committee,”
Alzheimers Dement., 2
(1), 12
–32
(2006). http://dx.doi.org/10.1016/j.jalz.2005.11.004 ADLEBN 1552-5260 Google Scholar
M. Kivipeltoet al.,
“Obesity and vascular risk factors at midlife and the risk of dementia and Alzheimer disease,”
Arch. Neurol., 62
(10), 1556
–1560
(2005). http://dx.doi.org/10.1001/archneur.62.10.1556 ARNEAS 0003-9942 Google Scholar
T. M. SivanandamM. K. Thakur,
“Traumatic brain injury: a risk factor for Alzheimer’s disease,”
Neurosci. Biobehav. Rev., 36
(5), 1376
–1381
(2012). http://dx.doi.org/10.1016/j.neubiorev.2012.02.013 NBREDE 0149-7634 Google Scholar
M. Di Lucaet al.,
“Platelets as a peripheral district where to study pathogenic mechanisms of Alzheimer disease: the case of amyloid precursor protein,”
Eur. J. Pharm., 405
(1), 277
–283
(2000). http://dx.doi.org/10.1016/S0014-2999(00)00559-8 EJPHAZ 0014-2999 Google Scholar
C. DreuxJ. M. Launay,
“Blood platelets: neuronal model in psychiatric disorders,”
Encephale, 11
(2), 57
–64
(1985). ENCEAN 0013-7006 Google Scholar
V. J. Sánchez-Gonzálezet al.,
“Altered beta-amyloid precursor protein isoforms in Mexican Alzheimer’s disease patients,”
Dis. Markers, 22
(3), 119
–125
(2006). http://dx.doi.org/10.1155/2006/347502 DMARD3 0278-0240 Google Scholar
L. Liet al.,
“Systematic identification of risk factors for Alzheimer’s disease through shared genetic architecture and electronic medical records,”
Pac. Symp. Biocomput., 18 224
–235
(2013). Google Scholar
F. A. GrecoA. SatlinA. K. Solomon,
“Abnormal erythrocyte anion exchange in Alzheimer disease,”
Arch. Pathol. Lab. Med., 124
(8), 1141
–1146
(2000). APLMAS 0003-9985 Google Scholar
G. G. Ortizet al.,
“Detection of membrane fluidity in submitochondrial particles of platelets and erythrocyte membranes from Mexican patients with Alzheimer disease by intramolecular excimer formation of 1,3 dipyrenylpropane,”
Dis. Markers, 24
(3), 151
–156
(2008). http://dx.doi.org/10.1155/2008/642120 DMARD3 0278-0240 Google Scholar
V. Sánchezet al.,
“Oxidative DNA damage in human sperm can be detected by Raman microspectroscopy,”
Fertil. Steril., 98
(5), 1124
–1129
(2012). http://dx.doi.org/10.1016/j.fertnstert.2012.07.1059 FESTAS 0015-0282 Google Scholar
R. L. Frostet al.,
“The molecular structure of the phosphate mineral chalcosiderite-A vibrational spectroscopic study,”
Spectrochim. Acta. A. Mol. Biomol. Spectrosc., 111 24
–30
(2013). http://dx.doi.org/10.1016/j.saa.2013.02.023 SAMCAS 1386-1425 Google Scholar
G. P. Kotcheyet al.,
“Effect of antioxidants on enzyme-catalysed biodegradation of carbon nanotubes,”
J. Mater. Chem. B. Mater. Biol. Med., 1
(3), 302
–309
(2012). http://dx.doi.org/10.1039/c2tb00047d 0959-9428 Google Scholar
M. Richard-LacroixC. Pellerin,
“Novel method for quantifying molecular orientation by polarized Raman spectroscopy: a comparative simulations study,”
Appl. Spectrosc., 67
(4), 409
–419
(2013). http://dx.doi.org/10.1366/12-06879 APSPA4 0003-7028 Google Scholar
Z. F. Zhuanget al.,
“Study of molecule variations in renal tumor based on confocal micro-Ranman spectroscopy,”
J. Biomed. Opt., 18
(3), 031103
(2013). http://dx.doi.org/10.1117/1.JBO.18.3.031103 JBOPFO 1083-3668 Google Scholar
M. Pudlaset al.,
“Raman spectroscopy as a tool for quality and sterility analysis for tissue engineering applications like cartilage transplants,”
Int. J. Artif. Organs, 33
(4), 228
–237
(2010). IJAODS 0391-3988 Google Scholar
K. Won-inet al.,
“Raman spectroscopic study on archaeological glasses in Thailand: ancient Thai glass,”
Spectrochim. Acta A Mol Biomol Spectrosc., 83
(1), 231
–235
(2011). http://dx.doi.org/10.1016/j.saa.2011.08.023 SAMCAS 1386-1425 Google Scholar
Z. J. SmithT. R. HuserS. Wachsmann-Hogiu,
“Raman scattering in pathology,”
Anal. Cell. Pathol. (Amst), 35
(3), 145
–163
(2012). SHTIEW 0926-9630 Google Scholar
D. L. Chenet al.,
“Protective effect of bajijiasu against -amyloid-induced neurotoxicity in PC12 cells,”
Cell. Mol. Neurobiol., 33
(6), 837
–850
(2013). http://dx.doi.org/10.1007/s10571-013-9950-7 CMNEDI 0272-4340 Google Scholar
Y. YamaguchiS. Kawashima,
“Effects of amyloid-beta-(25–35) on passive avoidance, radial-arm maze learning and choline acetyltransferase activity in the rat,”
Eur. J. Pharmacol., 412
(3), 265
–272
(2001). http://dx.doi.org/10.1016/S0014-2999(01)00730-0 EJPHAZ 0014-2999 Google Scholar
Z. F. Donget al.,
“Hippocampal long-term depression mediates spatial reversal learning in the Morris water maze,”
Neuropharmacology, 64 65
–73
(2013). http://dx.doi.org/10.1016/j.neuropharm.2012.06.027 NEPHBW 0028-3908 Google Scholar
R. M. Hamidet al.,
“What is the most sensitive measure of water maze probe test performance?,”
Front. Integr. Neurosci., 3 1
–9
(2009). FINRCR 1662-5145 Google Scholar
G. Novarinoet al.,
“Involvement of the intracellular ion channel CLIC1 in microglia-mediated beta-amyloid-induced neurotoxicity,”
J. Neurosci., 24
(23), 5322
–5330
(2004). http://dx.doi.org/10.1523/JNEUROSCI.1170-04.2004 JNRSDS 0270-6474 Google Scholar
B. R. Woodet al.,
“Resonance Raman spectroscopy of red blood cells using near infrared excitation,”
Anal. Bioanal. Chem., 387
(5), 1691
–1703
(2007). http://dx.doi.org/10.1007/s00216-006-0881-8 ABCNBP 1618-2642 Google Scholar
K. Ramseret al.,
“Resonance Raman spectroscopy of optically trapped functional erythrocytes,”
J. Biomed. Opt., 9
(3), 593
–600
(2004). http://dx.doi.org/10.1117/1.1689336 JBOPFO 1083-3668 Google Scholar
E. Zachariahet al.,
“Probing oxidative stress in single erythrocytes with Raman Tweezers,”
J. Photochem. Photobiol. B, 100
(3), 113
–116
(2010). http://dx.doi.org/10.1016/j.jphotobiol.2010.05.009 JPPBEG 1011-1344 Google Scholar
B. R. Woodet al.,
“Raman microspectroscopy and imaging provides insights into heme aggregation and denaturation within human erythrocytes,”
J. Biomed. Opt., 10
(1), 014005
(2005). http://dx.doi.org/10.1117/1.1854678 JBOPFO 1083-3668 Google Scholar
B. R. WoodD. McNaughton,
“Raman excitation wavelength investigation of single red blood cells in vivo,”
J. Raman Spectrosc., 33
(7), 517
–523
(2002). http://dx.doi.org/10.1002/(ISSN)1097-4555 JRSPAF 0377-0486 Google Scholar
B. R. WoodB. TaitD. McNaughton,
“Micro-Raman characterization of the R to T state transition of haemoglobin within a single living erythrocyte,”
Biochim. Biophys. Acta, 1539
(1–2), 58
–70
(2001). http://dx.doi.org/10.1016/S0167-4889(01)00089-1 BBACAQ 0006-3002 Google Scholar
N. A. Brazheet al.,
“New insight into erythrocyte through In vivo surface-enhanced Raman spectroscopy,”
Biophys. J., 97
(12), 3206
–3214
(2009). http://dx.doi.org/10.1016/j.bpj.2009.09.029 BIOJAU 0006-3495 Google Scholar
N. Liet al.,
“Micro-Raman spectroscopy study of the effect of Mid-Ultraviolet radiation on erythrocyte membrane,”
J. Photochem. Photobiol. B, 112 37
–42
(2012). http://dx.doi.org/10.1016/j.jphotobiol.2012.04.005 JPPBEG 1011-1344 Google Scholar
A. M. Gardneret al.,
“Apoptotic versus nonapoptotic cytotoxicity induced by hydrogen peroxide,”
Free Radic. Biol. Med., 22
(1–2), 73
–83
(1997). http://dx.doi.org/10.1016/S0891-5849(96)00235-3 FRBMEH 0891-5849 Google Scholar
W. Fierset al.,
“More than one way to die: apoptosis and necrosis and reactive oxygen damage,”
Oncogene, 18
(54), 7719
–7730
(1999). http://dx.doi.org/10.1038/sj.onc.1203249 ONCNES 0950-9232 Google Scholar
W. R. Markesbery,
“Oxidative stress hypothesis in Alzheimer’s disease,”
Free Radic. Biol. Med., 23
(1), 134
–147
(1997). http://dx.doi.org/10.1016/S0891-5849(96)00629-6 FRBMEH 0891-5849 Google Scholar
Y. Gilgun-SherkiE. MelamedD. Offen,
“Antioxidant treatment in Alzheimer’s disease: current state,”
J. Mol. Neurosci., 21
(1), 1
–11
(2003). http://dx.doi.org/10.1385/JMN:21:1 JMNEES 0895-8696 Google Scholar
M. C. Polidori,
“Oxidative stress and risk factors for Alzheimer’s disease: clues to prevention and therapy,”
J. Alzheimers Dis., 6
(2), 185
–191
(2004). JADIF9 1387-2877 Google Scholar
G. Liet al.,
“Protective effect of erythropoietin on -amyloid-induced PC12 cell death through antioxidant mechanisms,”
Neurosci. Lett., 442
(2), 143
–147
(2008). http://dx.doi.org/10.1016/j.neulet.2008.07.007 NELED5 0304-3940 Google Scholar
Y. Penget al.,
“L-3-n-butylphthalide improves cognitive impairment induced by intracerebroventricular infusion of amyloid-beta peptide in rats,”
Eur. J. Pharmacol., 621
(1–3), 38
–45
(2009). http://dx.doi.org/10.1016/j.ejphar.2009.08.036 EJPHAZ 0014-2999 Google Scholar
P. Ghezzi,
“Oxidoreduction of protein thiols in redox regulation,”
Biochem. Soc. Trans., 33
(Pt 6), 1378
–1381
(2005). http://dx.doi.org/10.1042/BST20051378 BCSTB5 0300-5127 Google Scholar
A. T. Tu, Raman Spectroscopy in Biology: Principles and Applications, 187 John Wiley and Sons, New York
(1982). Google Scholar
B. P. GaberW. L. Peticolas,
“On the quantitative interpretation of biomembrane structure by Raman spectroscopy,”
Biochim. Biophys. Acta, 465
(2), 260
–274
(1977). http://dx.doi.org/10.1016/0005-2736(77)90078-5 BBACAQ 0006-3002 Google Scholar
P. R. Carey, Biochemical Applications of Raman and Resonace Raman Spectroscopies, 71 Academic Press, New York
(1982). Google Scholar
|