|
|
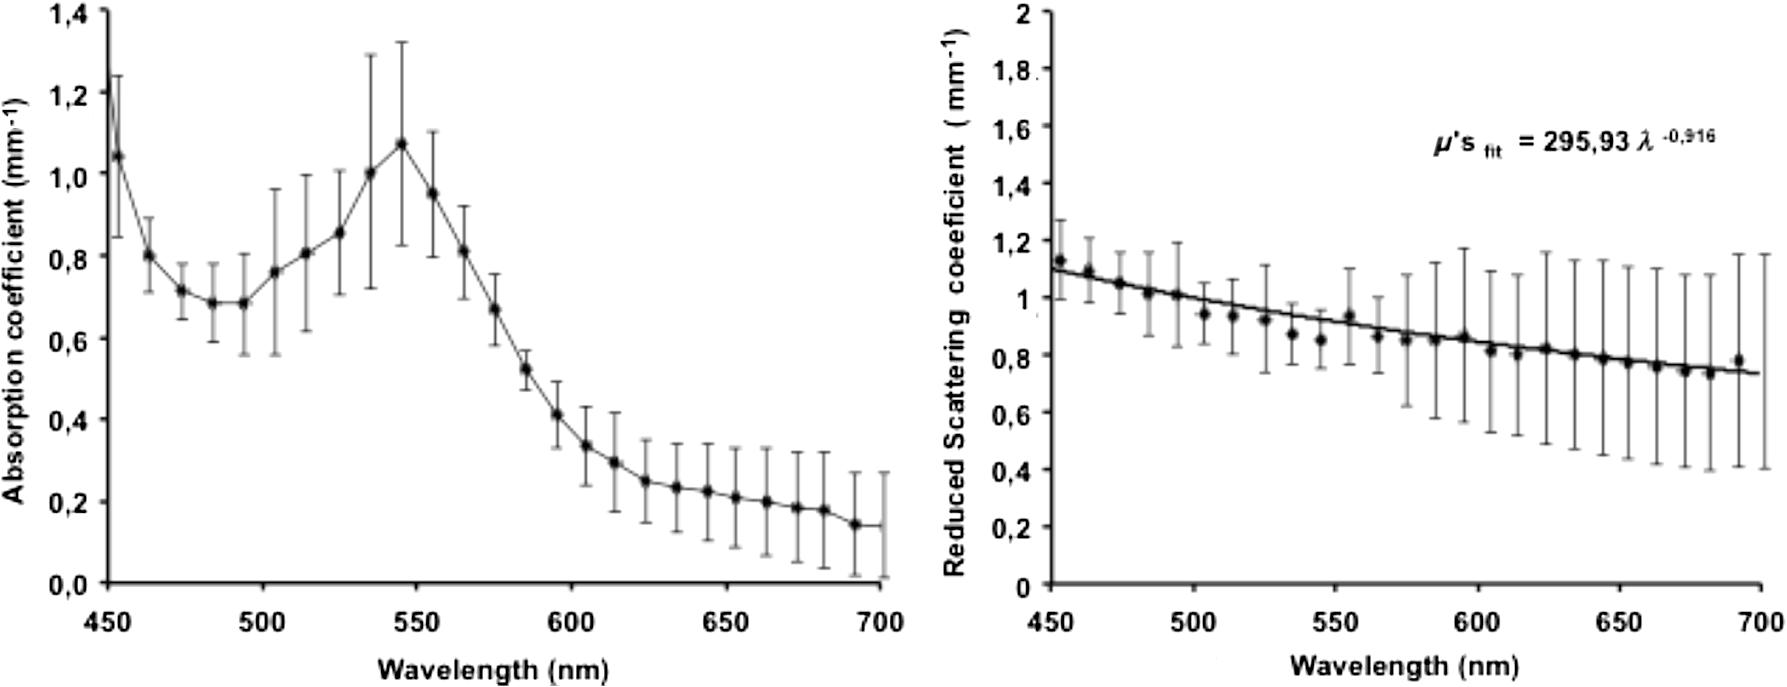
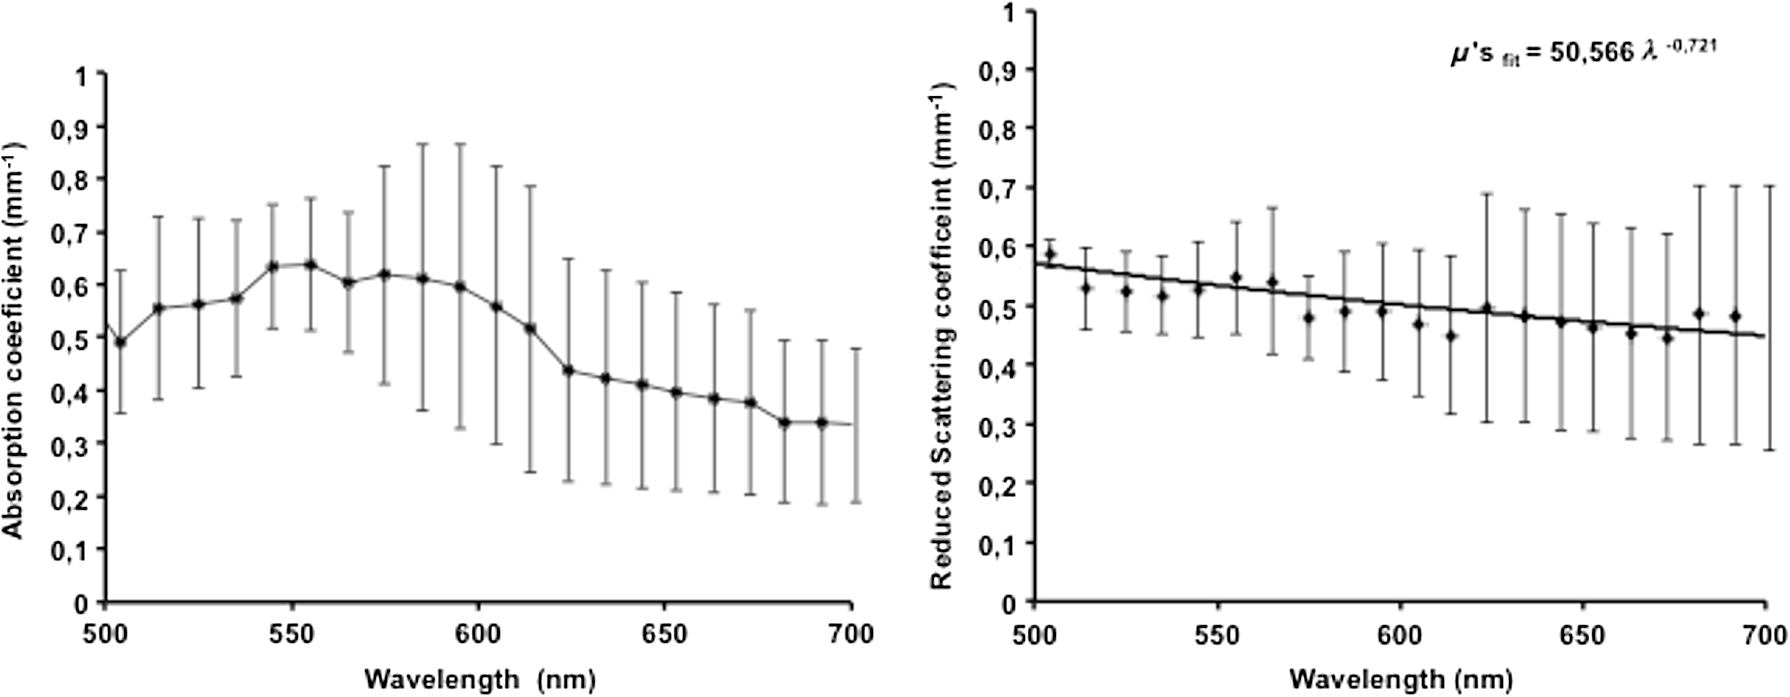
1.IntroductionThe use of biophotonics techniques has increased steadily in the last decade for both fundamental and preclinical research on small living animals. Wide-field bioluminescence has become a standard for fast screening of small animal models of cancers in preclinical oncology.1 In vivo optical imaging at the cellular level, such as two-photon fluorescence imaging, second harmonic generation imaging, or wide-field imaging techniques at the structure or organ level (intrinsic optical imaging, calcium or sensitive dye imaging), have become routine tools in labs,2 especially in the neuroscience field. These techniques produce new data, unraveling structural and functional mechanisms, and have been adopted quickly as reference tools. Recently, the rise of optogenetics has opened the novel possibility to address and trigger action potentials in specific cells with light.3 In many experimental paradigms, the need for quantitation requires modeling of the light path and fluence distribution in the tissues, of the penetration depth, and of possible interactions with fluorophores. Monte Carlo simulations based on simple and established algorithms for light propagation in tissues are commonly used to estimate these parameters, in order to properly design device and correctly interpret optical signals.4,5 Although Monte Carlo simulations might be extremely useful for the design and optimization of instruments and experimental protocols in biophotonics, they need to be based on accurate optical properties of the tissues so that the conclusions drawn from the simulations are reliable. Although biophotonics techniques are developing rapidly, the knowledge of optical properties of organs and tissues, especially of internal organs, is currently insufficient. The available reviews6–8 of optical properties in different organs show (1) a large variability of optical properties for the same tissues; (2) a lack of data in the visible spectral range, especially for the blue and green wavelengths, which concerns many endogenous and exogenous fluorophores; (3) data obtained from tissues in various states (in vivo or in vitro, fresh tissues or frozen slices, homogenized paste) with few comparative analysis between optical properties for different sample preparations;9–13 (4) few data are available for rats and mice and were rather obtained in larger animals such as pigs for the heart14 or dogs for kidney and prostate;15 and (5) few data are available for internal organs. Due to the lack of measurements, the data from few studies are used as standards in many studies (e.g., the data for human brain tissues in Refs. 9 and 16). Sometimes, audacious assumptions are used, such as extrapolating optical coefficients measured at a specific wavelength to other wavelengths, or pooling tissue optical properties of different species to get an estimate of the optical properties in small animal tissues.17 In the present article, we try to address partly the needs for optical property measurements in rat organs. We measured the optical properties of fresh and frozen rat tissues over a 450- to 700-nm spectral range. We also discuss the influence of cryogenic processing on the optical properties as well as the interindividual and intraindividual variations. 2.Materials and Methods2.1.Tissues PreparationTissues from the heart, kidney, brain gray matter (striatum), liver, and hind limb muscle of Wistar rats (mean weight 350 g) were obtained after overdose of pentobarbital () injected intraperitoneally. After dissection, the organs were placed in saline at 4°C for a few minutes (on ice) and then included in agar gel at 10% before slicing. For each organ, at least three different animals were used. For each animal, two sections of each tissue were analyzed. For each section, up to three independent measurements points were carried out. A total of nine animals were used in the studies. Sections of 200-μm thickness were obtained using a vibratome (Leica, Nanterre, France, VT1000S). Immediately after slicing and just before optical measurements, the sample was placed in saline on ice at 4°C. Tissue sections were then mounted between two glass slides in order to minimize rough surface effects. Spacers of 200-μm thickness that glued to one glass slide were used to prevent tissue compression, which is known to affect optical properties.18 A drop of saline was added to prevent sample drying and refractive index mismatch at the tissue/glass boundaries. Vibratome parameters, such as speed and vibrating frequency, were adjusted empirically for each organ to obtain satisfactory slicing, which was achieved for the heart, kidney, and brain tissues but proved difficult in muscle and liver. Consequently, a cryotome (LeicaLC1950) was also used at slice frozen tissues from the same animals to obtain 200-μm-thick tissue slices for heart, kidney, brain, liver, and muscle. Organs were frozen immediately after dissection by dropping them in isopentane at . After slicing with a cryotome, tissue sections were placed in saline on ice at 4°C until complete defrost, and sections were mounted between two glass slides with spacers just before optical measurements similar to fresh tissues. 2.2.Total Transmittance and Reflectance Set-upA standard set-up was used for measurements of total transmittance and reflectance . It consists of an integrated sphere including three ports (IS200 three ports model, Thorlabs, Newton, New Jersey), a high intensity white source (HPX 2000, Ocean Optics, Dunedin, Florida) associated to an optical fiber (50/125 glass fiber), and a collimator. A 1-mm-wide beam pointed to the center of the tissue sample covering either the front (transmittance measurements) or the back (reflectance measurement) port of the integrating sphere. To avoid light contamination resulting from a partly uncovered sphere port, sample dimensions were chosen large enough to entirely cover the port of the integrating sphere. This was achieved using a single slice for the heart, liver, and muscle measurements. For kidney and brain measurements, contiguous slices of tissues were patched together onto a microscope slide to entirely cover the entrance port. Extreme care was taken (1) to avoid these slices to be superimposed and (2) to avoid gaps between slices. In addition, experiments were carried out in a dark room to minimize potential contamination from ambient light. A high-sensitivity spectrophotometer (QE 6500, Ocean Optics) associated to a plastic fiber (PMMA Toray, 50-cm long, 1-mm diameter, 0.22 NA) was used for light collection. The spectral output of the collimated source combined with the spectral sensitivity of the spectrophotometer made it possible to record spectra with adequate signal-to-noise ratio in the 450- to 700-nm range. 2.3.Optical Properties DerivationThe inverse adding doubling (IAD) approach was used to derive the absorption, diffusion, and anisotropy coefficients from the macroscopic measurements.19 We used the last version of IAD program available online.20 The set-up was validated using a 1-mm-thick slab of optical phantom material (Biomimic INO, Canada). The targeted optical properties of the phantom at the manufacturing step were and at 630 nm. Optical index and anisotropy of the Biomimic phantom were evaluated by the manufacturer to and .21 The optical properties of our phantom measured using the time resolved method by the manufacturer were and at 530 nm and and at 630 nm. 3.Results3.1.Validation of the Optical Properties Derivation MethodUsing the integral sphere set-up described above, the total reflectance and transmittance of a 1-mm-thick slab of phantom material were measured. Inversion of the macroscopic measurement using IAD led to and at 530 nm and and at 630 nm, showing a good agreement with the optical properties measured by the manufacturer using the time resolved technique. The influence of critical parameters in the inversion procedure was studied. IAD inversions were carried out assuming different probing beam radii, optical index of the sample, slice thickness of the sample, and integrating sphere wall reflectivity. These studies demonstrated a negligible influence of the illuminating beam radius ( changes in the derived optical properties for beam diameter varying from 1 to 3 mm) provided it remained small compared to the sphere port diameter covered by the sample as demonstrated earlier.22 The optical index of the sample and sample thickness accuracy showed a moderate impact on the inversion results. Indeed, the derived optical properties varied linearly with the optical index assumed for the tissue. A 10% change in the optical index resulted in a 10% change in the derived optical properties. Similarly, an increase in the assumed thickness of the sample from 1 to 1.1 mm led to a 10% decrease of both microamperes and microseconds. Changing the reflectivity coefficient of the integrating sphere walls between 90% and 99% led to strong changes in both microamperes and microseconds (20% and , respectively). To avoid these errors, we used a new and calibrated sphere with calibrated reflectivity of 99% over the entire wavelength range. 3.2.Optical Properties of Brain, Heart, and Kidney Fresh TissuesIn this section, we show the estimated absorption and reduced scattering coefficient averaged over all measurements and the corresponding standard deviations for wavelengths between 450 and 700 nm. Data have been pooled among different slices and among different animals. Interindividual and intraindividual variations are discussed below in a specific section. As can be seen on Figs. 1 and 2, heart and kidney data show similar optical properties over the measured spectral range. Both organs present an absorption coefficient strongly related to the hemoglobin absorption spectra with high values for low wavelengths, a maximum absorption coefficient close to at around 550 nm and a low absorption ( or less) for red-near infrared wavelengths. The scattering coefficient shows a steady decrease with increasing wavelength that can be fitted by the following power laws: for the heart and kidney, respectively, , with in and in nm. Optical properties of brain tissues were assessed for the gray matter only (Fig. 3). Striatal tissues were primarily targeted as they can be easily discriminated by eye. Experimental data show a significantly lower absorption and a less pronounced yet existing correlation with the hemoglobin spectra compared to what is observed for kidney, heart, and muscle tissues. Brain-reduced scattering coefficient is much higher than for any other structure throughout the whole spectra and was fitted with the following power law: . 3.3.Optical Properties of Tissues after Cryogenic ProcessingFor muscle and liver, slicing fresh tissues using a vibratome was difficult and did not yield reliable results in terms of tissue integrity, slice thickness, or reproducibility. Therefore, these tissues were frozen and then sliced with a microtome. Measurements were carried out on thawed slices. For comparison purposes, the same procedure was applied to brain tissues. Results for the brain, shown on Fig. 4, demonstrate a global and significant decrease of both absorption (about 50%) and reduced scattering coefficients (about 30%) for cryogenized tissues compared to fresh tissues. These decreases are independent of wavelength. Similar results were obtained for heart and kidney tissues. Results for cryogenized muscle and liver tissues are shown in Figs. 5 and 6. Absorption for liver showed a marked absorption peak of hemoglobin at 550 nm as for the kidney but the overall values for absorption were significantly lower than for the fresh tissues of the kidney and the heart. Reduced scattering for defrost liver decreased steadily with wavelength and was fitted by the following power law: . Absorption for defrost muscle showed a weak dependence with wavelength and a very broad peak around 550 nm. Reduced scattering decreased steadily with wavelength and could be fitted by the following power law: . Fig. 1Optical absorption and reduced scattering coefficients for fresh heart tissues (3 animals, 6 slices, 12 independent measurement points). Error bars represent one standard deviation. 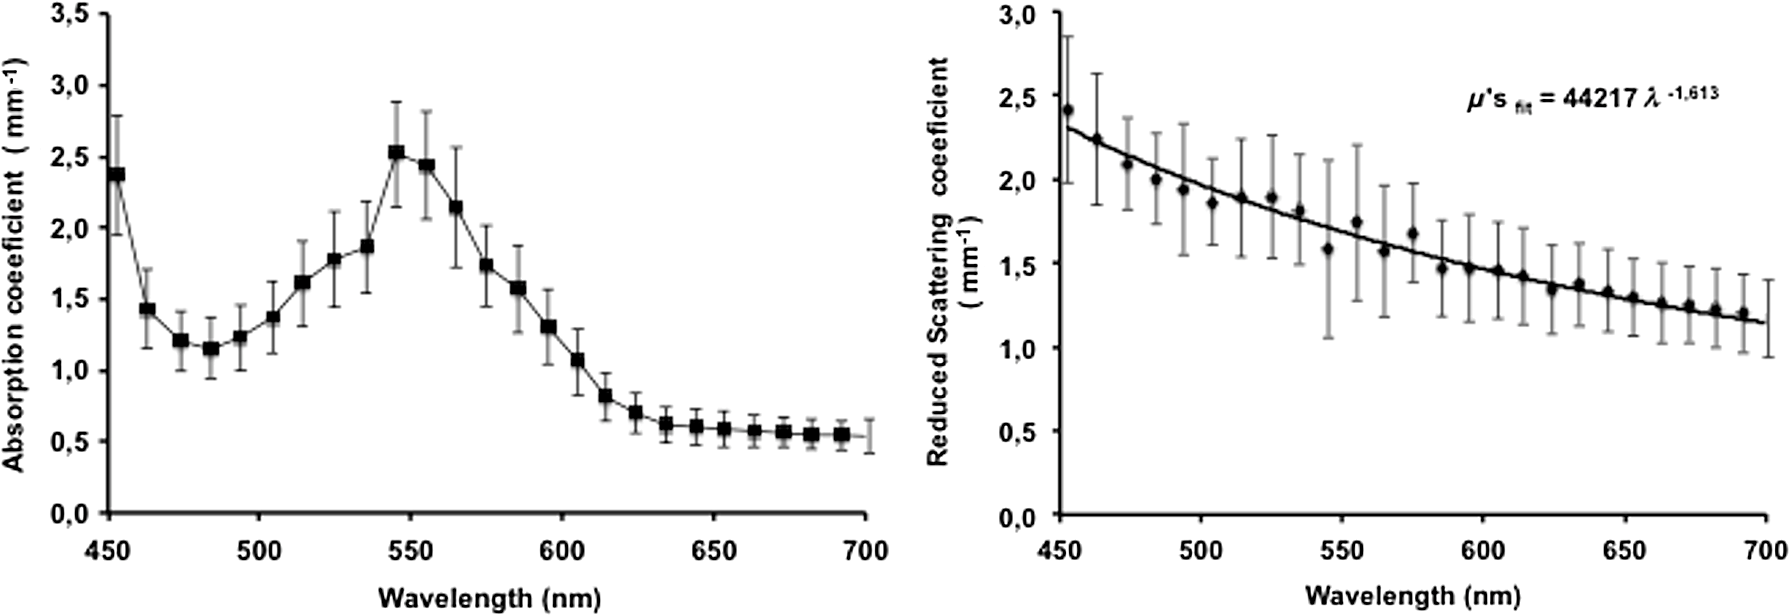 Fig. 2Optical absorption and reduced scattering coefficients for fresh kidney tissues (3 animals, 6 slices, 8 independent measurement points). Error bars represent one standard deviation. 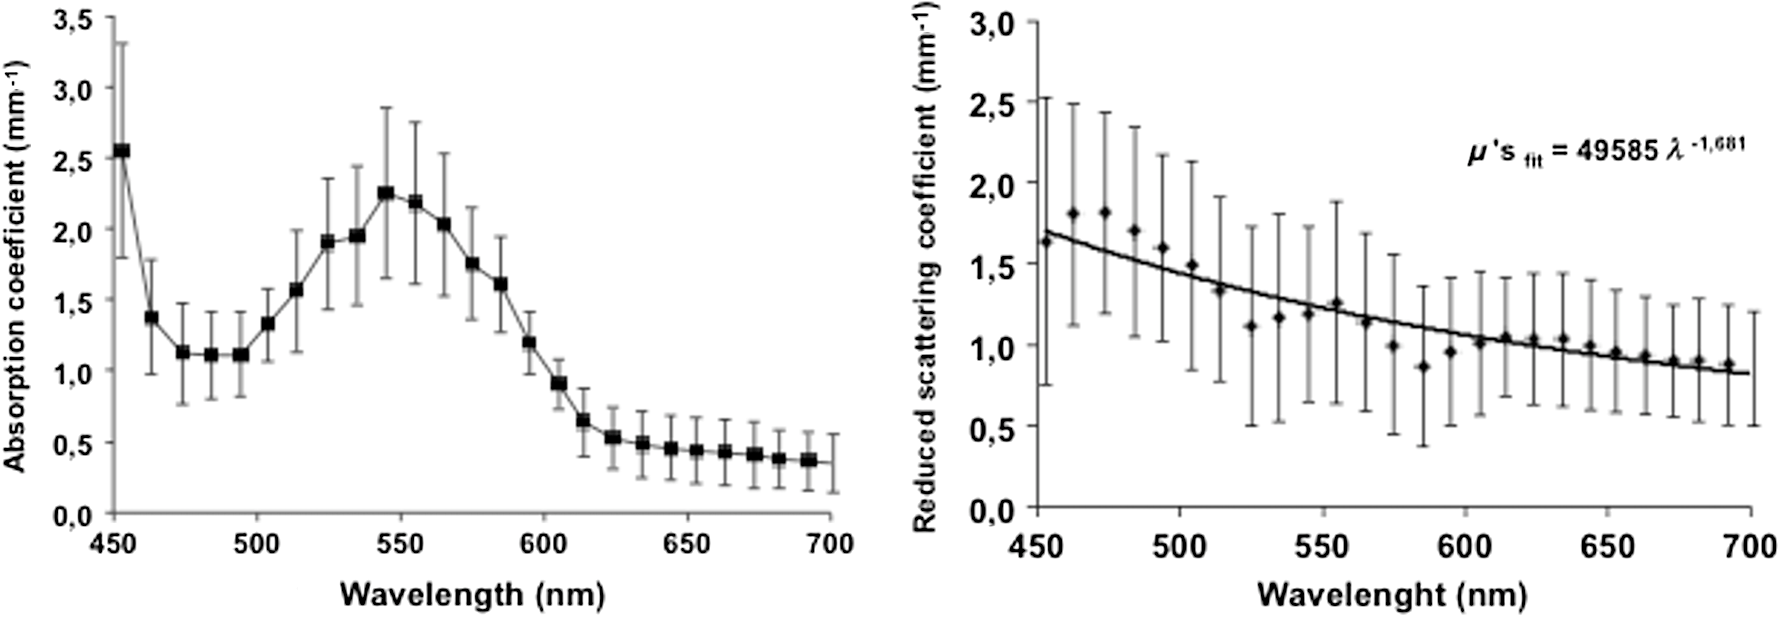 Fig. 3Optical absorption and reduced scattering coefficients for fresh brain tissues (4 animals, 6 slices, 10 independent measurement points). Error bars represent one standard deviation.  Fig. 4Influence of cryogenic processing on optical properties of brain tissues (fresh tissues: 4 animals, 6 slices, 10 independent measurement points; frozen tissues, 1 animal, 1 slice, 2 independent measurement points).  3.4.Intraindividual and Interindividual VariationVariations of the optical properties within the samples for a single animal were studied as well as variations between animals for fresh tissues. Similar results were obtained for brain, heart, and kidney tissues, so for the sake of conciseness only brain data are presented here. Regarding intraindividual variations, optical absorption and scattering were found to be rather homogeneous for all organs. For brain tissues, care was taken to probe similar brain region in all samples (gray matter in the striatal region was targeted since it could be located easily by eye inspection prior to measurements). Moderate variations of the optical measurements and derived optical properties were observed in the same slice or in different slices within the same organs in a single animal. The intraindividual variations were expressed as the standard deviation between measurements in different measurement points for the same animal. For brain tissues, these variations lie in the 0.2- to range for the absorption coefficient and in the 0- to range for the reduced scattering coefficient (Fig. 7). Variations between animals were found to be similar to variations within one animal except for one animal whose optical coefficients differ significantly (animal #4 in Fig. 8). The standard deviation calculated for the optical coefficients derived from all samples for the brain tissues lies in the 0.2- to range for absorption coefficient and in the 1- to range for the reduced scattering coefficient. As can be seen in Fig. 8, optical properties present similar profiles with wavelengths for different animals. Absolute values can differ by up to 30% for both absorption and reduced scattering coefficient. Fig. 7Intraindividual variability of optical fresh brain optical properties. Intraindividual variability was evaluated from three independent measurements for a single animal at different locations within the gray matter (striata). Thick black line and diamonds are the mean of measurements. Black lines correspond to optical properties derived from single measurements. Shaded gray area corresponds to one standard variation of measurements.  Fig. 8Interindividual variability of optical fresh brain optical properties. Interindividual variability was evaluated from the mean optical properties derived for four different animals. Thick black line and diamonds are the mean of all measurements, which were pooled within animals. Shaded gray area corresponds to one standard variation of measurements. Black lines correspond to the mean optical properties of individual animals.  4.DiscussionWe have measured the optical properties of five major organs in the rat for the visible range using the IAD method. The technique has been used extensively over the last decades,11,19,22,23 and the accuracy of the method is regarded as very good within the limits imposed by the fact that the samples are measured in resected configuration. This technique has been continuously improved over the years, and successive versions of the inversion software were released to correct for the light escaping the samples at the edges. One crucial point for measurements on samples with small dimensions is to entirely cover the sphere port to avoid the entry of ambient light through the uncovered port. In our experiments, this was possible for heart, liver, and muscle but not for brain and kidney due to the limited dimensions of rat organs. We initially considered two approaches: (1) restriction of the diameter of the port of the integrating sphere by covering it with a 7-mm-diameter pinhole and (2) careful assembly of contiguous slices of the tissues to ensure entire coverage of the sphere port. In the pinhole approach, the inner face of this pinhole was painted with diffusive paint (Labsphere) matching the reflective properties of the sphere walls. The pinhole approach was not satisfactory for several reasons. First, the reflectivity of the paint depends on the paint thickness which is difficult to control. Second, as discussed in the IAD manual,20 the distance from the edge of the irradiating beam on the sample to the edge of the port () should be as large as practicable. Especially, it should verify to avoid light losses at the sample sides. Here, using a 7-mm-diameter pinhole and a 1-mm-diameter light beam, can be less than five times higher than , for tissues with relatively low and especially in the 600- to 700-nm wavelengths, thus leading to strong light losses at the edges. Even if light loss calculation is dealt with through Monte Carlo calculations in the IAD program, in some experiments with the pinhole, the program failed to converge due to strong light losses. Consequently, we chose to follow the patched tissue approach since it provided converging and reproducible derivations of optical coefficients. Furthermore, to ensure the absence of ambient light contamination, experiments were carried out in a completely dark room, the light source enclosure being covered with black sheet, so that the only light source is the collimated light beam aimed at the center of the sample. We think that the present work partly addresses the need for a carefully validated database of optical properties in rats to assist in the development and characterization of optical small animal imaging instruments and experiment design. The optical properties for heart, kidney, brain, and muscle and liver should be especially useful in the context of Monte Carlo simulations of optical photons traveling in biological tissues. Applications that could benefit from these data range from bioluminescence or tomographic optical fluorescence in preclinical models of cancer, to the control of the spatial extent of light pulse stimulations in recent optogenetic rodent models. Experimental measurements of tissues optical properties are scattered in the literature. Many studies focused on measurements at one or two wavelengths due to instrumental limitations (especially the lack of availability of short pulses laser sources) or targeted interest in a particular wavelength. As an example, the phototherapy research area is particularly active at evaluating optical properties in the red and near infrared.24 As a consequence, in the seminal review of biological tissues in optical properties,6 the vast majority of reported data were for red-infrared wavelengths for diffuse optical tomography and photodynamic therapy applications. From this first milestone, many studies have been carried out with a variety of techniques including reflectance and transmittance measurements with integral spheres, time resolved measurements,25 differential pathlength spectroscopy,26 confocal reflectance microscopy,27 and optical coherent imaging.28,29 Some techniques are limited to ex vivo imaging, whereas others lead to scattering properties only. A remarkable set of measurements for several organs in different species was carried out using the IAD method at four wavelengths in the 630- to 1064-nm range.23 Yet, when looking at the literature, few data are available, especially for rats, and no data are available for mice in the visible range, which correspond to the spectral window of excitation for most of the endogenous and exogenous fluorophores. As a consequence, researchers in the biophotonic field still use crude experimental measurement of maximum light transportation in tissue (see Ref. 30 for a discussion in the context of optogenetics) or extrapolate optical properties of human tissues to tailor small animal experiments.17 This arises from the intrinsic difficulty of measuring optical properties in living tissues and the limited dimensions of the rodent organs. The dynamic, in vivo, and spatially resolved measurement of optical properties in deep tissues still remains a challenging goal. Furthermore, absorption coefficients and reduced scattering coefficients from the literature show large variations up to several orders of magnitude for the same organs,6–8 and very few studies have been carried out for internal soft tissues such as heart, kidney, and liver. To our knowledge, apart from one study,23 no studies have reported data from several tissue types obtained in the same animals, with the same experimental set-up, making it difficult to interpret the large variability of optical coefficients seen in the literature. 4.1.Effect of Tissue FreezingApart from instrumental considerations, several studies have shown that sample preparations affect the optical properties.9–13,18 Compared to the “fresh” condition defined here, we found that cryogenic processing of tissues led to significant decreases of the absorption and reduced scattering coefficients for brain, heart, and kidney tissues, without distinct wavelength dependence. These results are consistent with a previous study on pigs liver tissue12 that showed a similar influence of cryogenic processing on the absorption and reduced scattering coefficient, respectively, with a magnitude of 10% and 20% for a “slow” freezing process at . Data obtained on frozen and thawed ear tissues10 and calf jejunum tissues13 also demonstrated the same behavior in the 400- to 600-nm range compared to intact tissues with a decrease of that absorption coefficient of about 10% to 50% and decrease of scattering coefficient of about 5% to 20%. Provided no extra blood loss occurs during the freezing process, the generally accepted assertion is that freezing would alter the microscopic structure and consequently, the diffusion properties more than the absorption, which mainly depends on blood content. To explain the strong decrease of the absorption coefficient, the hypothesis of erythrocytes lyses and distribution of free hemoglobin was raised.10,12 Overall, our results confirm previous observations and suggest that no simple extrapolation can be performed from data obtained in frozen samples to actual optical properties of in vivo tissues. Yet, measurements on frozen tissues can yield a valuable insight into the optical properties of tissues when measurements on freshly resected tissues are difficult. 4.2.Biological VariabilityBiological variability of tissues between subject, strain, and heterogeneity of optical properties in organs could also contribute significantly to the dispersion of optical property measurements. Here, we compared the optical properties of different organs in a total of nine Wistar rats. To limit experimental variability, all data were obtained by the same operator, using the same experimental set-up and standardized protocols. We found for all tissues that intraindividual and interindividual variations were of similar amplitude within the 20% to 30% range. This indicates that performing a large number of measurements on few animals is appropriate to obtain accurate optical properties, provided that the subjects are of the same strain and age. Variability can be reduced by standardization of tissue processing and optical measurement protocols. We now compare the optical coefficients obtained to those available in the literature. We have voluntarily restricted this comparison to data obtained in vivo or in vitro on fresh rat tissue. 4.3.Rat Heart Tissue Optical PropertiesData related to the heart are particularly scarce for fresh tissues in rats. A single study was reported31 and provided with data at 633 nm for three types of preparation for heart tissues of Wistar rats: freshly excised, 1-day-old refrigerated, and frozen. The measurement method was similar to the one implemented in our study though measurements were carried out only at 633 nm. Values for absorption and scattering coefficients in fresh tissues were about twice as low as our own values (0.3 and for and compared to and in our study). Since no precise details are provided on the sample preparation protocol, especially on the actual time of measurement after excision, it is difficult to compare the datasets. It should be noticed, however, that the observed differences are close to the range of the interindividual variations we observed. A set of data acquired from fresh pig tissues and using an integrating sphere set-up is often cited as a reference for heart tissue properties.14 The optical coefficients compare well with our data, with similar profiles throughout the spectrum ranging from 450 to 900 nm and values slightly lower for both absorption and reduced scattering coefficients. 4.4.Rat Kidney Tissue Optical PropertiesKidney data in the visible range are also scarce in the literature, and we found a single study in vivo in dogs obtained using oblique incidence spectroscopy.15 The spectral range from this study (630 to 1000 nm) overlaps with our own range (450 to 700 nm). The study by Solonenko et al. does not report the absorption coefficient spectrum. A fit of the reduced scattering coefficient as a function of wavelength for kidney tissues in vivo is provided as , while our in vitro data led to . It should be stressed here that again it is difficult to compare these data obtained in different experimental conditions and in different species. 4.5.Rat Muscle and Liver Tissue Optical PropertiesMuscle and liver data were particularly difficult to obtain since we did not succeed in reproducible slicing of these tissues using a vibratome. Again, most data reported in the rat so far have been obtained for wavelengths over 630 nm.7 In one study, inverse Monte Carlo calculations were used to derive optical properties for fresh rat liver at six wavelength points over the 500 to 800 nm range.32 At 650 nm, values of and were reported for liver tissues. Optical coherent tomography measurements at 710 nm led to an estimate of reduced scattering coefficients of .29 Two studies using the integrating sphere approach for freshly resected rat liver led, respectively, to and at 633 nm,23 and and 33. These measurements agreed well with our data at 633 nm for both absorption () and scattering (). As underlined previously, the results for muscle are difficult to compare since the reported results are from different types of muscle samples and available data for the muscle in rats are scarce. At 650 nm, values of and have been reported,32 compared to and in the present study. Although reduced scattering coefficients are similar, absorption coefficients are lower by almost 1 order of magnitude. Such high-magnitude differences are most likely due to blood leakage during sample preparation. 4.6.Rat Brain Tissue Optical PropertiesBrain optical properties in the visible range have been measured in a number of species but almost no data are listed in reviews for rat and mice brains despite their prominent role in fundamental and preclinical neuroscience research. Among the different tissues measured in our study, brain data showed the largest value for the reduced scattering coefficient with values 3 to 10 times higher than those observed in the other organs that we studied. Such high reduced scatterings are consistent with the literature and are generally attributed to the large amount of membranes and axonal fibers though the origins of light diffusion in living brain are a long-debated subject.34 Absorption was somehow less related to blood content compared to heart and kidney with a much smoother hemoglobin absorption peak around 550 nm. We compared our data with optical properties estimated in vivo from wide-field reflectance data at 550 nm of the exposed brain of rats.35 Values of and were derived. These data compare well with our own estimates for but are an order of magnitude higher than our estimation of of at 550 nm. In his PhD thesis,36 Van der Zee showed the average optical properties for the brains of nine Wistar in the 500- to 900-nm spectral range for measurements carried out within 26 h postexcision. The absorption coefficient ranged from and with a maximum around 550 nm. Reduced scattering coefficient was within 2 and . Our measurements were obtained for excised tissues within a 4-h range against a 26-h range in the work of Van der Zee. It is likely that the brain blood leakage during excision increases strongly with time. This could explain the observed discrepancies. Notably, in a study on human brains,16 very low absorption values (around ) were reported for in vivo measurements of human white and gray matter during neurosurgery. Measurements performed on blood-free human brain tissues led to very low values of absorption coefficients in both white and gray matter, ranging between 0.08 and in the 450- to 850-nm spectral range, demonstrating the major contribution of blood to absorption.9 Optical scattering properties of brain white matter are considered to vary drastically with time after excision.8 However, we found values within the range of in vivo data for samples analyzed within 4 h postexcision since we carefully ensure that the samples were neither drying nor over-soaked in saline. In the study by Yaroslavsky et al.,9 the reduced scattering coefficient of human brain tissues decreased from 10 to for gray matter and 30 to for white matter in the 350- to 700-nm range. Our measurements targeted the striata which are deep gray matter structures that can be easily located by visual examination of slices. However, due to the small dimensions of rat brain structures, the optical coefficient derived from reflectance and transmittance measurements do not purely represent striatal values, but rather an average of different gray loci surrounding the point the light beam is directed to. Due to its intrinsic complexity in terms of anatomical and functional loci, it is likely that optical properties differ significantly from one brain structure to another. In the context of optogenetics and optical imaging in the brain of small animals, this supports the need for techniques with high spatial resolution and the ability for dynamic measurement of the optical properties.37,38 5.ConclusionWe have obtained new measurements of the optical absorption and reduced scattering coefficient for rat heart, kidney, brain, liver, and muscle tissues in the visible range. We confirmed observations of previous studies regarding the influence of cryogenic process on optical properties and studied the biological variability of the data. Our results show that accurate optical properties can be derived from several measurements within the same organ in few animals provided that the sample preparation and analysis protocols are carefully standardized. We believe that these data help filling the holes in the building database of optical properties of biological tissues, which are of particular importance for numerical simulations carried out in the process of the design of new biomedical approaches. AcknowledgmentsThis research including M. Mesradi postdoctoral fellowship was funded by Agence National de la Recherche hGATE ANR-09-COSI-004. The authors would like to thank UPR3294 Neurobiology and Development Unit for help in the processing of fresh tissues with a vibratome. ReferencesM. KelkarA. De,
“Bioluminescence based in vivo screening technologies,”
Curr. Opin. Pharmacol., 12
(5), 592
–600
(2012). http://dx.doi.org/10.1016/j.coph.2012.07.014 COPUBK 1471-4892 Google Scholar
F. PainB. L’HeureuxH. Gurden,
“Visualizing odor representation in the brain: a review of imaging techniques for the mapping of sensory activity in the olfactory glomeruli,”
Cell. Mol. Life Sci., 68
(16), 2689
–2709
(2011). http://dx.doi.org/10.1007/s00018-011-0708-4 CMLSFI 1420-9071 Google Scholar
E. S. Boydenet al.,
“Millisecond-timescale, genetically targeted optical control of neural activity,”
Nat. Neurosci., 8
(9), 1263
–1268
(2005). http://dx.doi.org/10.1038/nn1525 NANEFN 1097-6256 Google Scholar
L. WangS. L. JacquesL. Zheng,
“MCML—Monte Carlo modeling of light transport in multi-layered tissues,”
Comput. Methods Programs Biomed., 47
(2), 131
–146
(1995). http://dx.doi.org/10.1016/0169-2607(95)01640-F CMPBEK 0169-2607 Google Scholar
B. L’HeureuxH. GurdenF. Pain,
“Autofluorescence imaging of NADH and flavoproteins in the rat brain: insights from Monte Carlo simulations,”
Opt. Express, 17
(12), 9477
–9490
(2009). http://dx.doi.org/10.1364/OE.17.009477 OPEXFF 1094-4087 Google Scholar
W. F. CheongS. A. PrahlA. J. Welch,
“A review of the optical properties of biological tissues,”
IEEE J. Quantum Electron., 26
(12), 2166
–2185
(1990). http://dx.doi.org/10.1109/3.64354 IEJQA7 0018-9197 Google Scholar
A. N. BashkatovE. A. GeninaV. V. Tuchin,
“Optical properties of skin, subcutaneous and muscle tissues: a review,”
J. Innovative Opt. Health Sci., 04
(01), 9
–38
(2011). http://dx.doi.org/10.1142/S1793545811001319 1793-5458 Google Scholar
S. L. Jacques,
“Optical properties of biological tissues: a review,”
Phys. Med. Biol., 58
(11), R37
–R61
(2013). http://dx.doi.org/10.1088/0031-9155/58/11/R37 PHMBA7 0031-9155 Google Scholar
A. N. Yaroslavskyet al.,
“Optical properties of selected native and coagulated human brain tissues in vitro in the visible and near infrared spectral range,”
Phys. Med. Biol., 47
(12), 2059
–2073
(2002). http://dx.doi.org/10.1088/0031-9155/47/12/305 PHMBA7 0031-9155 Google Scholar
E. SalomatinaA. N. Yaroslavsky,
“Evaluation of the in vivo and ex vivo optical properties in a mouse ear model,”
Phys. Med. Biol., 53
(11), 2797
–2807
(2008). http://dx.doi.org/10.1088/0031-9155/53/11/003 PHMBA7 0031-9155 Google Scholar
E. A. Geninaet al.,
“Effect of storage conditions of skin samples on their optical characteristics,”
Opt. Spectrosc., 107
(6), 934
–938
(2009). http://dx.doi.org/10.1134/S0030400X09120169 OPSUA3 0030-400X Google Scholar
A. Rogganet al.,
“The effect of preparation technique on the optical parameters of biological tissue,”
Appl. Phys. B, 69
(5–6), 445
–453
(1999). http://dx.doi.org/10.1007/s003400050833 APBOEM 0946-2171 Google Scholar
E. ChanT. MenovskyA. J. Welch,
“Effects of cryogenic grinding on soft-tissue optical properties,”
Appl. Opt., 35
(22), 4526
–4532
(1996). http://dx.doi.org/10.1364/AO.35.004526 APOPAI 0003-6935 Google Scholar
J. Swartlinget al.,
“Changes in tissue optical properties due to radio-frequency ablation of myocardium,”
Med. Biol. Eng. Comput., 41
(4), 403
–409
(2003). http://dx.doi.org/10.1007/BF02348082 MBECDY 0140-0118 Google Scholar
M. Solonenkoet al.,
“In vivo reflectance measurement of optical properties, blood oxygenation and motexafin lutetium uptake in canine large bowels, kidneys and prostates,”
Phys. Med. Biol., 47
(6), 857
–873
(2002). PHMBA7 0031-9155 Google Scholar
F. Bevilacquaet al.,
“In vivo local determination of tissue optical properties: applications to human brain,”
Appl. Opt., 38
(22), 4939
–4950
(1999). http://dx.doi.org/10.1364/AO.38.004939 APOPAI 0003-6935 Google Scholar
G. AlexandrakisF. R. RannouA. F. Chatziioannou,
“Tomographic bioluminescence imaging by use of a combined optical-PET (OPET) system: a computer simulation feasibility study,”
Phys. Med. Biol., 50
(17), 4225
–4241
(2005). http://dx.doi.org/10.1088/0031-9155/50/17/021 PHMBA7 0031-9155 Google Scholar
E. K. Chanet al.,
“Effects of compression on soft tissue optical properties,”
IEEE J. Sel. Top. Quantum Electron., 2
(4), 943
–950
(1996). http://dx.doi.org/10.1109/2944.577320 IJSQEN 1077-260X Google Scholar
S. A. PrahlM. J. van GemertA. J. Welch,
“Determining the optical properties of turbid mediaby using the adding-doubling method,”
Appl. Opt., 32
(4), 559
–568
(1993). http://dx.doi.org/10.1364/AO.32.000559 APOPAI 0003-6935 Google Scholar
“Inverse Adding-Doubling v3-9-10,”
(2013) http://omlc.ogi.edu/software/iad/index.html October ). 2013). Google Scholar
J.-P. Bouchardet al.,
“Reference optical phantoms for diffuse optical spectroscopy. Part 1—Error analysis of a time resolved transmittance characterization method,”
Opt. Express, 18
(11), 11495
–11507
(2010). http://dx.doi.org/10.1364/OE.18.011495 OPEXFF 1094-4087 Google Scholar
J. W. Pickeringet al.,
“Double-integrating-sphere system for measuring the optical properties of tissue,”
Appl. Opt., 32
(4), 399
–410
(1993). http://dx.doi.org/10.1364/AO.32.000399 APOPAI 0003-6935 Google Scholar
J. F. Beeket al.,
“In vitro double-integrating-sphere optical properties of tissues between 630 and 1064 nm,”
Phys. Med. Biol., 42
(11), 2255
–2261
(1997). http://dx.doi.org/10.1088/0031-9155/42/11/017 PHMBA7 0031-9155 Google Scholar
J. L. SandellT. C. Zhu,
“A review of in-vivo optical properties of human tissues and its impact on PDT,”
J. Biophotonics, 4
(11–12), 773
–787
(2011). http://dx.doi.org/10.1002/jbio.v4.11/12 JBOIBX 1864-063X Google Scholar
M. S. PattersonB. ChanceB. C. Wilson,
“Time resolved reflectance and transmittance for the non-invasive measurement of tissue optical properties,”
Appl. Opt., 28
(12), 2331
–2336
(1989). http://dx.doi.org/10.1364/AO.28.002331 APOPAI 0003-6935 Google Scholar
A. AmelinkH. J. Sterenborg,
“Measurement of the local optical properties of turbid media by differential path-length spectroscopy,”
Appl. Opt., 43
(15), 3048
–3054
(2004). http://dx.doi.org/10.1364/AO.43.003048 APOPAI 0003-6935 Google Scholar
R. SamathamS. L. JacquesP. Campagnola,
“Optical properties of mutant versus wild-type mouse skin measured by reflectance-mode confocal scanning laser microscopy (rCSLM),”
J. Biomed. Opt., 13
(4), 041309
(2008). http://dx.doi.org/10.1117/1.2953195 JBOPFO 1083-3668 Google Scholar
J. Bindinget al.,
“Brain refractive index measured in vivo with high-NA defocus-corrected full-field OCT and consequences for two-photon microscopy,”
Opt. Express, 19
(6), 4833
–4847
(2011). http://dx.doi.org/10.1364/OE.19.004833 OPEXFF 1094-4087 Google Scholar
J. YiV. Backman,
“Imaging a full set of optical scattering properties of biological tissue by inverse spectroscopic optical coherence tomography,”
Opt. Lett., 37
(21), 4443
–4445
(2012). http://dx.doi.org/10.1364/OL.37.004443 OPLEDP 0146-9592 Google Scholar
O. Yizharet al.,
“Optogenetics in neural systems,”
Neuron, 71
(1), 9
–34
(2011). http://dx.doi.org/10.1016/j.neuron.2011.06.004 NERNET 0896-6273 Google Scholar
A. SinghA. E. KarstenR. M. Smith,
“Determination of the optical properties of rat tissue,”
Eur. Cells Mater., 19
(Suppl. 1), 14
(2010). Google Scholar
A. M. K. NilssonR. BergS. Andersson-Engels,
“Measurements of the optical properties of tissue in conjunction with photodynamic therapy,”
Appl. Opt., 34
(21), 4609
–4619
(1995). http://dx.doi.org/10.1364/AO.34.004609 APOPAI 0003-6935 Google Scholar
P. ParsaS. L. JacquesN. S. Nishioka,
“Optical properties of rat liver between 350 and 2200 nm,”
Appl. Opt., 28
(12), 2325
–2330
(1989). http://dx.doi.org/10.1364/AO.28.002325 APOPAI 0003-6935 Google Scholar
L. B. CohenR. D. KeynesB. Hille,
“Light scattering and birefringence changes during nerve activity,”
Nature, 218
(5140), 438
–441
(1968). http://dx.doi.org/10.1038/218438a0 NATUAS 0028-0836 Google Scholar
S. Chenet al.,
“In vivo optical reflectance imaging of spreading depression waves in rat brain with and without focal cerebral ischemia,”
J. Biomed. Opt., 11
(3), 034002
(2006). http://dx.doi.org/10.1117/1.2203654 JBOPFO 1083-3668 Google Scholar
P. Van der Zee,
“Measurement and Modeling of the optical properties of human tissue in the near infrared,”
University College London,
(1992). Google Scholar
R. B. Saageret al.,
“Method for depth-resolved quantitation of optical properties in layered media using spatially modulated quantitative spectroscopy,”
J. Biomed. Opt., 16
(7), 077002
(2011). http://dx.doi.org/10.1117/1.3597621 JBOPFO 1083-3668 Google Scholar
R. B. SaagerD. J. CucciaA. J. Durkin,
“Determination of optical properties of turbid media spanning visible and near-infrared regimes via spatially modulated quantitative spectroscopy,”
J. Biomed. Opt., 15
(1), 017012
(2010). http://dx.doi.org/10.1117/1.3299322 JBOPFO 1083-3668 Google Scholar
|