

|
|
|
The incidence of cutaneous melanoma is rising faster than any other type of cancer, however, many experts believe this trend may be due to an increase in false positives rather than an increase in the true occurrence of melanoma.1 This notion is fueled, in part, by the significant mismatch between the disease’s incidence rate and mortality rate, which have increased 120% and 5%, respectively, since 1991.2,3 In addition, studies have found no statistical differences between the mortality rates of areas that screen for melanoma and those that do not.4 These facts raise important questions regarding current diagnostic paradigms and call for new strategies that can help better target this disease. The current gold standard for melanoma diagnosis is visual or dermoscopic inspection, followed by excision, and microscopic examination of fixed tissue slices ( thick) using hematoxylin and eosin (H&E) staining. Unfortunately, histological evaluation suffers from significant drawbacks; for example, it is subjective. As a result, melanoma diagnosis is subject to (1) high discordance rates () (i.e., pathologists examining the same skin biopsy samples disagree on the diagnosis);5 and (2) a “diagnostic drift” (i.e., the same severely atypical dysplastic nevi samples diagnosed as nonmalignant in the late 1980s are now reclassified as malignant).6 These problems have motivated the development of molecular imaging techniques that provide additional insight into the disease states.7,8 In this work, we utilize pump-probe microscopy, which yields information on diagnostically relevant pigments, namely eu- and pheo-melanin, by probing their excited state photodynamics.7 The ability to visualize the melanin chemistry with high spatial resolution is potentially useful to aid diagnosis since it provides insight into metabolic states, location of melanocytes, and melanogenesis.7 Recently, we have demonstrated the ability to quantitatively differentiate between melanocytic nevi and malignant melanomas based on bulk percent eumelanin, without considering its spatial distribution.7 These findings echo those of other studies that use diffuse reflectance spectroscopy9 or destructive chemical analyses.10 Unlike these methods, however, pump-probe microscopy offers additional information based on the subcellular distribution of the melanin content,7,11 which, if quantified, could have a significant impact on melanoma diagnosis. In this Letter, we quantify melanin spatial distribution using a mathematical morphology transformation. The approach applies a two-dimensional (2-D) autocorrelation function to the quantitative molecular images and extracts statistical properties from the resulting distribution. The parameters extracted to quantify melanin structure are described and their diagnostic relevance is demonstrated by analyzing pigmented, unstained, thin cutaneous, and conjunctival melanocytic lesions. Results are compared to the diagnosis made by a board-certified pathologist (Dr. M. A. Selim) using H&E stained samples from adjacent slices from the same lesions. In pump-probe microscopy, two laser pulses are used to probe the ultra-fast dynamic properties of pigmented samples. A detailed description of the instrumentation is given elsewhere.7 In brief, the output of a mode-locked Ti:Sapphire laser, tuned to 810 nm, is split into two beams: One is used to pump an optical parametric oscillator that is tuned to 720 nm, and then modulated at 2 MHz using an acousto-optic modulator. The second beam from the Ti:Sapph (probe beam) is sent to a delay-line to control the time of arrival of the probe with respect to the pump. Then the pump and probe beams are recombined and sent to a scanning microscope. This wavelength combination is chosen to increase contrast between eu- and pheo-melanin. When a nonlinear interaction between the two beams occurs in the sample, the pump modulation is transferred to the probe beam, which is then detected using a lock-in-amplifier. Data collected can be considered a hyperspectral cube, where two dimensions contain the spatial information and the third contains the dynamic properties. To obtain quantitative molecular maps of the melanin distribution, we first remove unwanted contributions from pigments that are irrelevant to the diagnosis of melanocytic lesions by applying phasor analysis.12 Unwanted pigments may include surgical ink and/or hemoglobin, neither of which is produced by melanocytes. In phasor analysis, clusters of points in a 2-D histogram of the phasors (cosine and sine transformations from the time response of each image-pixel) are indicative of different molecular species, allowing one to digitally remove unwanted species by applying a mask in phasor space. The same mask, as determined by the cumulative phasor histogram of 42 cutaneous lesions,12 is applied to all images. Finally, we obtain quantitative information by solving an overdetermined set of linear equations (i.e., by matrix inversion), using as a basis set the known pump-probe response for sepia eumelanin and synthetic pheomelanin. Four molecular maps are obtained: eu- and pheo-melanin distribution, total melanin content, and percent eumelanin. (A different class of melanin, identified as iron-loaded eumelanin, was recently found in tissue and in Jurassic-aged fossils,13 but its diagnostic value is still under investigation and is thus not specifically accounted for here.) Once these four quantitative molecular images are obtained, a 2-D autocorrelation is computed for each. This is equivalent to producing a morphological autocorrelation transformation (MAT) which extracts second-order geometrical information (i.e., morphological covariance) and can produce metrics that are invariant to translation, scale, and rotation.14 (MAT was defined in Ref. 14 as a collection of directional autocorrelation functions, computed for a set of angles . These are equivalent to radial slices of the 2-D autocorrelation. Thus, the 2-D autocorrelation represents a MAT covering a range of .) The MAT provides information that is not made available by other mathematical morphology methods (e.g., morphological skeleton transformation or pattern spectrum), which are first order and can only describe boundaries and areas, or give a skeletal image representation.15 Thus, MAT can better depict the complex architecture observed in the pigmented tissue samples and allow comparison of melanin structure across different images and specimens. Built-in MATLAB (Mathworks 2013, Natick, Massachusetts) functions were used for all computations. Figure 1 shows representative quantitative molecular images (percent eumelanin) along with their MAT. In general, benign samples tend to have pigment that is more organize or structured; in other words, the melanin is bounded to the epidermis or dermal-epidermal junction.16 This organized structure manifests itself as anisotropy in the MAT; for example, the MAT will contain a “pointy” streak. On the other hand, samples exhibiting higher degrees of vertical growth, a hallmark of invasive behavior,16 will possess a rounder, more homogenous MAT distribution. To quantify this observation, we start by computing the standard-deviations (second moments, and ) along and orthogonal to , a vector from the origin to the center-of-mass of the MAT. Then, we define the normalized MAT anisotropy parameter as , which varies from 0 (highly disorganized) to (highly organized); note that is rotation invariant, zero when and symmetrical about . Further, the magnitude of can be interpreted as the amount of organized pigmentation along the direction of highest covariance, which is typically along the epidermis. These parameters are depicted graphically in Fig. 1(b). Next, we compute the entropy of the MAT, which provides an additional measure of the organization of the pigment (i.e., spatial heterogeneity). Note that the image entropy and MAT entropy are not equivalent since the MAT is a second-order transformation. Lastly, images with low SNR (below 0 dB) are omitted from the analysis; to estimate the noise from a single image, we use the average difference in intensity between the zero-lag of the MAT and adjacent points.17 Fig. 1Representative percent eumelanin images along with their two-dimensional (2-D) morphological autocorrelation transformation (MAT). Because the MAT is symmetric about the origin, only the right half-plane is depicted. (b) Illustrates the parameters extracted from the MAT to quantify image structure, see text for details.  The results for cutaneous lesions are summarized in Fig. 2. For comparison with the MAT structure analysis, we first classify the lesions using bulk pigment information (such as percent eumelanin), neglecting spatial morphology. Figure 2(a) is a scatter plot of percent eumelanin average versus standard-deviation; with decision lines determined using a quadratic discrimination function. Here, the data generally show that as lesions become more eumelanotic, they lose chemical heterogeneity (i.e., the distribution of percent eumelanin becomes narrower). However, this trend is not strong, and we observe that the percent eumelanin alone is a poor predictor of invasive lesions. To quantitatively compare the predictive power of the parameters, the leave-one-out cross-validation (LOOCV) method is used, which provides an unbiased estimate of the predictive error and is a common choice for small sample sets.18 Also, support vector machine (SVM) is used to train the algorithm with a Gaussian radial basis function kernel.19 Using these bulk melanin parameters alone to discriminate between invasive and noninvasive lesions, the cross-validation yields a sensitivity (probability of detection) and specificity (complement of false alarm probability) . Note that with SVM and LOOCV, the user does not have to specify decision lines nor a sensitivity or specificity value. It is also worth emphasizing that we only classify for invasive melanomas since clear cytological and architectural features for this lesion type allows for an indisputable diagnosis using histology and thus provide an appropriate benchmark for the analysis. Fig. 2Scatter plot of quantitative parameters. Arrows point to the parameters from samples shown in Fig. 1. SK: seborrheic keratosis (benign), BN: benign nevus, CN: compound nevus, DN: dysplastic nevus, MIS: melanoma in-situ, and IM: invasive melanoma. 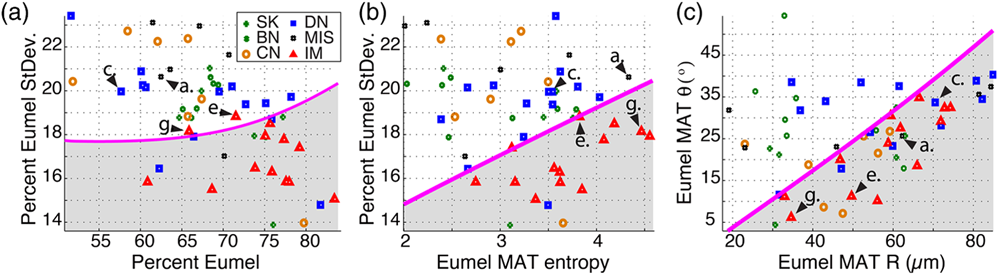 Figure 2(b) incorporates the entropy from the eumelanin image MAT, where it is clear that the two parameters provide better discrimination. Quantitatively, the standard-deviation of the percent eumelanin and entropy of the eumelanin image MAT yield an improved and . Adding and from the eumelanin image MAT [shown in Fig. 2(c)] to the cross-validation further improves the classifier to and (one false negative and one false positive). These results show dramatically improved sensitivity and specificity even over previous attempts to incorporate spatial information using wavelet analysis and hidden Markov trees, which have achieved and (same dataset and statistical analysis were used in this study).20 Further improvements might be possible by incorporating additional MAT-derived parameters (e.g., entropy of total-melanin image MAT). However, each new parameter increases the dimensionality of the classification space, bringing on the so-called “curse of dimensionality”: while our limited training set () adequately samples a low-dimensional space, it is too sparse in a high-dimensional space to reliably estimate decision boundaries.21 These effects are expected to lessen as we acquire a larger training set in future work. The 2-D MAT analysis was also recently applied to conjunctival melanocytic lesions22 (the MAT method was not described in detail there). In this proof-of-principle work, a smaller sample subset was imaged (), with three different groups: benign nevi, primary acquired melanosis, and conjunctival melanoma. For these lesions, from pheomelanin images, total melanin MAT entropy, and percent eumelanin standard-deviation provided perfect separation of the three different groups. Although this was a small study, the results further support the importance of the 2-D MAT as a valuable tool to quantify image structure for melanoma detection. Recent work by Seidenari et al.8 using multiphoton laser tomography and fluorescence life time imaging (FLIM) have also shown promising results for diagnosing melanoma. They differentiate between disease states using FLIM spectra along with morphological features. Classification of features, however, was achieved using observer-blinded studies rather than mathematical/computational approaches. In conclusion, we have presented a method to quantify pump-probe image structure using a 2-D mathematical autocorrelation transformation. The parameters extracted from the MAT, namely , , and entropy, seek to quantify different features related to the structure of the molecular images. The method can be implemented using built-in MATLAB functions and all new parameters have been explicitly defined. The combination of these parameters along with bulk chemical properties, yield high sensitivity and specificity for invasive melanoma. Future work will focus on obtaining a larger sample set to enable separation of other lesion types, such as melanoma in-situ and dysplastic nevi, and to look for statistical differences with age and gender. AcknowledgmentsThis work was supported by the National Institutes of Health grants R01-CA166555 and Duke University. F.E. Robles, Ph.D., holds a Postdoctoral Enrichment Program Award from the Burroughs Welcome Fund. ReferencesE. J. Glusac,
“The melanoma ‘epidemic’, a dermatopathologist’s perspective,”
J. Cutaneous Pathol., 38
(3), 264
–267
(2011). http://dx.doi.org/10.1111/cup.2011.38.issue-3 JCUPBN 0303-6987 Google Scholar
H. G. WelchS. WoloshinL. M. Schwartz,
“Skin biopsy rates and incidence of melanoma: population based ecological study,”
Br. Med. J., 331
(7515), 481
(2005). http://dx.doi.org/10.1136/bmj.38516.649537.E0 BMJOAE 0007-1447 Google Scholar
A. Jemalet al.,
“Cancer surveillance series: changing patterns of cutaneous malignant melanoma mortality rates among whites in the United States,”
J. Natl. Cancer Inst., 92
(10), 811
–818
(2000). http://dx.doi.org/10.1093/jnci/92.10.811 JNCIEQ 0027-8874 Google Scholar
J. Meliaet al.,
“The relation between mortality from malignant melanoma and early detection in the Cancer Research Campaign Mole Watcher Study,”
Br. J. Cancer, 85
(6), 803
–807
(2001). http://dx.doi.org/10.1054/bjoc.2001.2012 BJCAAI 0007-0920 Google Scholar
B. A. ShooR. W. SagebielM. Kashani-Sabet,
“Discordance in the histopathologic diagnosis of melanoma at a melanoma referral center,”
J. Am. Acad. Dermatol., 62
(5), 751
–756
(2010). http://dx.doi.org/10.1016/j.jaad.2009.09.043 JAADDB 0190-9622 Google Scholar
J. E. Frangoset al.,
“Increased diagnosis of thin superficial spreading melanomas: a 20-year study,”
J. Am. Acad. Dermatol., 67
(3), 387
–394
(2012). http://dx.doi.org/10.1016/j.jaad.2011.10.026 JAADDB 0190-9622 Google Scholar
T. E. Matthewset al.,
“Pump-probe imaging differentiates melanoma from Melanocytic Nevi,”
Sci. Transl. Med., 3
(71), 71ra15
(2011). http://dx.doi.org/10.1126/scitranslmed.3001604 STMCBQ 1946-6242 Google Scholar
S. Seidenariet al.,
“Multiphoton laser tomography and fluorescence lifetime imaging of melanoma: morphologic features and quantitative data for sensitive and specific non-invasive diagnostics,”
PLoS ONE, 8
(7), e70682
(2013). http://dx.doi.org/10.1371/journal.pone.0070682 1932-6203 Google Scholar
R. MarchesiniA. BonoM. Carrara,
“In vivo characterization of melanin in melanocytic lesions: spectroscopic study on 1671 pigmented skin lesions,”
J. Biomed. Opt., 14
(1), 014027
(2009). http://dx.doi.org/10.1117/1.3080140 JBOPFO 1083-3668 Google Scholar
K. Jimbowet al.,
“Distribution of eu-and pheomelanins in human skin and melanocytic tumors, and their photoprotective vs. phototoxic properties,”
Melanin: Its Role in Human Photoprotection, 155
–155 Overland Park(1795). Google Scholar
M. J. Simpsonet al.,
“Nonlinear microscopy of eumelanin and pheomelanin with subcellular resolution,”
J. Invest. Dermatol., 1
–5
(2013). http://dx.doi.org/10.1038/jid.2013.37 JIDEAE 0022-202X Google Scholar
F. E. Robleset al.,
“Phasor analysis for nonlinear pump-probe microscopy,”
Opt. Express, 20
(15), 17082
–17092
(2012). http://dx.doi.org/10.1364/OE.20.017082 OPEXFF 1094-4087 Google Scholar
M. J. Simpsonet al.,
“Pump-probe microscopic imaging of jurassic-aged eumelanin,”
J. Phys. Chem. Lett., 4
(11), 1924
–1927
(2013). http://dx.doi.org/10.1021/jz4008036 1948-7185 Google Scholar
A. P. A. LouiA. N. A. VenetsanopoulosK. C. K. Smith,
“Morphological autocorrelation transform: a new representation and classification scheme for two-dimensional images,”
IEEE Trans. Image Process., 1
(3), 337
–354
(1992). http://dx.doi.org/10.1109/83.148607 IIPRE4 1057-7149 Google Scholar
P. Maragos,
“Pattern spectrum of images and morphological shape-size complexity,”
Acoustics, Speech, and Signal Processing, IEEE International Conference on ICASSP'87, 241
–244
(1987). Google Scholar
V. Kumaret al., Robbins & Cotran Pathologic Basis of Disease, Elsevier Health Sciences(2009). Google Scholar
J. T. ThongK. S. SimJ. C. Phang,
“Single-image signal-to-noise ratio estimation,”
Scanning, 23
(5), 328
–336
(2001). http://dx.doi.org/10.1002/sca.4950230506 SCNNDF 0161-0457 Google Scholar
W. JiangR. Simon,
“A comparison of bootstrap methods and an adjusted bootstrap approach for estimating the prediction error in microarray classification,”
Stat. Med., 26
(29), 5320
–5334
(2007). http://dx.doi.org/10.1002/(ISSN)1097-0258 SMEDDA 1097-0258 Google Scholar
B. Scholkopfet al.,
“Comparing support vector machines with Gaussian kernels to radial basis function classifiers,”
IEEE Trans. Signal Process., 45 2758
–2765
(1997). http://dx.doi.org/10.1109/78.650102 ITPRED 1053-587X Google Scholar
M. F. Duarteet al.,
“Melanoma classification from Hidden Markov tree features,”
Int. Conf. Acoustics, Speech and Signal Processing (ICASSP), 2012 IEEE, 685
–688
(2012). Google Scholar
T. J. HastieR. J. TibshiraniJ. J. H. Friedman, The Elements of Statistical Learning: Data Mining, Inference, and Prediction, Springer(2001). Google Scholar
J. W. Wilsonet al.,
“Imaging microscopic pigment chemistry in conjunctival melanocytic lesions using pump-probe laser microscopy,”
Invest. Ophthalmol. Vis. Sci., 54
(10), 6867
–6876
(2013). http://dx.doi.org/10.1167/iovs.13-12432 IOVSDA 0146-0404 Google Scholar
|


