
|
|
1.IntroductionAlzheimer’s disease (AD) is a neurodegenerative disorder that intermittently induces mild memory loss and confusion in the early stages, gradually leading to a decline in cognitive and intellectual abilities in daily life, and an irreversible severe mental deterioration in its late stages.1–5 Since Dr. Alzheimer discovered the pathogenic hallmarks of AD from the presenile brain in 1906, a lot of intensive efforts have been put into the research on AD through a wide variety of biological fields during the past several decades.3–13 Based on the multidisciplinary researches, the most universally accepted hypotheses on AD pathogenesis until a recent date demonstrate that the intracerebral lesions, induced by the extracellular aggregate formation of beta-amyloid () peptides and the neurofibrillary tangles composed of tau proteins, have been regarded as the crucial histopathological evidences of AD.8–12 Even their synergetic aspects might play a serious role in the pathological progress of AD, meaning that those would be confirmative biomarkers for AD diagnosis. According to a medical paradigmatic transition from treatment to early diagnostic prevention, highly sophisticated neuroimaging systems have been developed as cerebral visualization tools, allowing noninvasive diagnosis for the intracerebral distribution of the amyloid plaques for the clinical assessment of AD status.14–20 However, these systems have limitations in spatial resolution with a molecular-level precision for the identification of nanoscale peptides in the early stages of AD, because their detection is on the basis of the computed images of somewhat large size of plaque clumps. Also, high-user expense bearing might work as a privative factor in early AD diagnosis and may require routine clinical examinations several times a year. Scientists have also been concerned with physiological body fluids as a biomarker medium, in which the promising AD biomarkers could be verified. Cerebrospinal fluid (CSF) is a very useful fluid for AD diagnosis, because the information on brain metabolic processes is included due to the direct contact with the brain.21,22 However, the invasive collection by lumbar puncture may not be relevant to early diagnostic use, because severe pain, discomfort, or potential side effects from viruses might be accompanied. Blood plasma measurements are the most standard in clinics in terms of minimal invasiveness and easy collection and processing. However, the effective utilization of plasma is still limited, because the plasma concentration of the AD biomarker is rather fluctuating in a broad spectrum of changes.23 In this research, we utilized saliva as a biomarker medium to correlate the salivary levels to AD pathological aspects. In fact, the use of saliva has been considered as a diagnostic fluid over the past decade, and some researches induced meaningful findings in terms of its diagnostic potential.24 Several researches focused on the associations between AD and AD-induced impairment of a salivary gland, which produces most of salivary volume.25–27 Also, the alteration of amyloid precursor proteins (APPs), expressed in salivary epithelial cells, engendered structurally neurotoxic formation of peptides.25,28 Besides being treated as a promising diagnosis fluid, saliva provides more benefits over other physiological body fluids in that it can be collected noninvasively by participants with moderate training and without high risk of viral infection. Therefore, the identification of the salivary AD biomarkers using a facile microarraying method would motivate this study with the assistance of magnetically assembled antibody-conjugated nanoparticles. Recently, a microcontact printing (μCP) method has been widely used for rapid micropatterning biomaterials such as nanoparticles, DNA, proteins, cells, and so on.29 However, despite the great contribution to the well-defined, rapid micropatterning of various proteins in a controlled manner, the μCP may support only one single sample diagnosis for all of the micropatterns printed on one substrate (at least a few millimeters’ scale substrate), meaning that each individual micropattern transferred from the stamp is ineligible to diagnose each biomarker fluid from different patients without, for example, the integration of a microfluidic separating system for each micropattern, which may not be a simple method any more. Experimentally, more precise studies were performed to identify the salivary AD biomarkers using the existing tools such as mass spectrometer25 or enzyme-linked immunosorbent assay (ELISA).30 The ELISA system is treated as the golden standard method for protein assessment, and there are many different kinds of ELISA systems with a high sensitivity. But, generally, the system would be concurrently used for several samples obtained from many examinees due to the immediate use of the reagents within the day, which is not appropriate for personal diagnostic ready-to-use. However, our measuring method would be a pertinent system for personal diagnosis and does not require complicated, time-consuming processes. As described in Fig. 1, the magnetic particle-collecting platform mainly consists of the sensing array surrounded by obtuse-angled arc-shaped PDMS guides and the magnetic bars (diameter ) placed beneath each sensing region with center alignment. This simple magnetoimmunoassay system enables the assembly of the antibody-conjugated nanobeads, capturing the peptides from AD salivary samples, measures the photointensity generated by the Q-dot tagged with peptides using a photomultiplier tube (PMT, Photon Technology International, Birmingham, New Jersey, D-104), and consequently enables the effective quantification of salivary peptides. This method demonstrates a facile approach for the analysis of quantification using magnetic force and magnetic silica nanoparticles (diameter ), enabling one to simply detect salivary peptides at a concentration as low as . It is expected that our simple magnetoimmunoassay system may have potential as a detector for low-level peptides with weak-fluorescence emission. Fig. 1Schematic diagram of the antibody-based magnetoimmunoassay process. The magnetic particle-collecting platform mainly consists of the sensing array surrounded by obtuse-angled arc-shaped PDMS guides and the magnetic bars placed beneath each sensing region with center alignment, simply enabling the formation of circular nanoparticle assemblage and the quantification of salivary beta-amyloid () peptides conjugated to the nanoparticles labeled with Q-dots. The salivary -conjugated nanoparticle solution was prepared by sandwich immunoassay method through the processes (a) to (e). 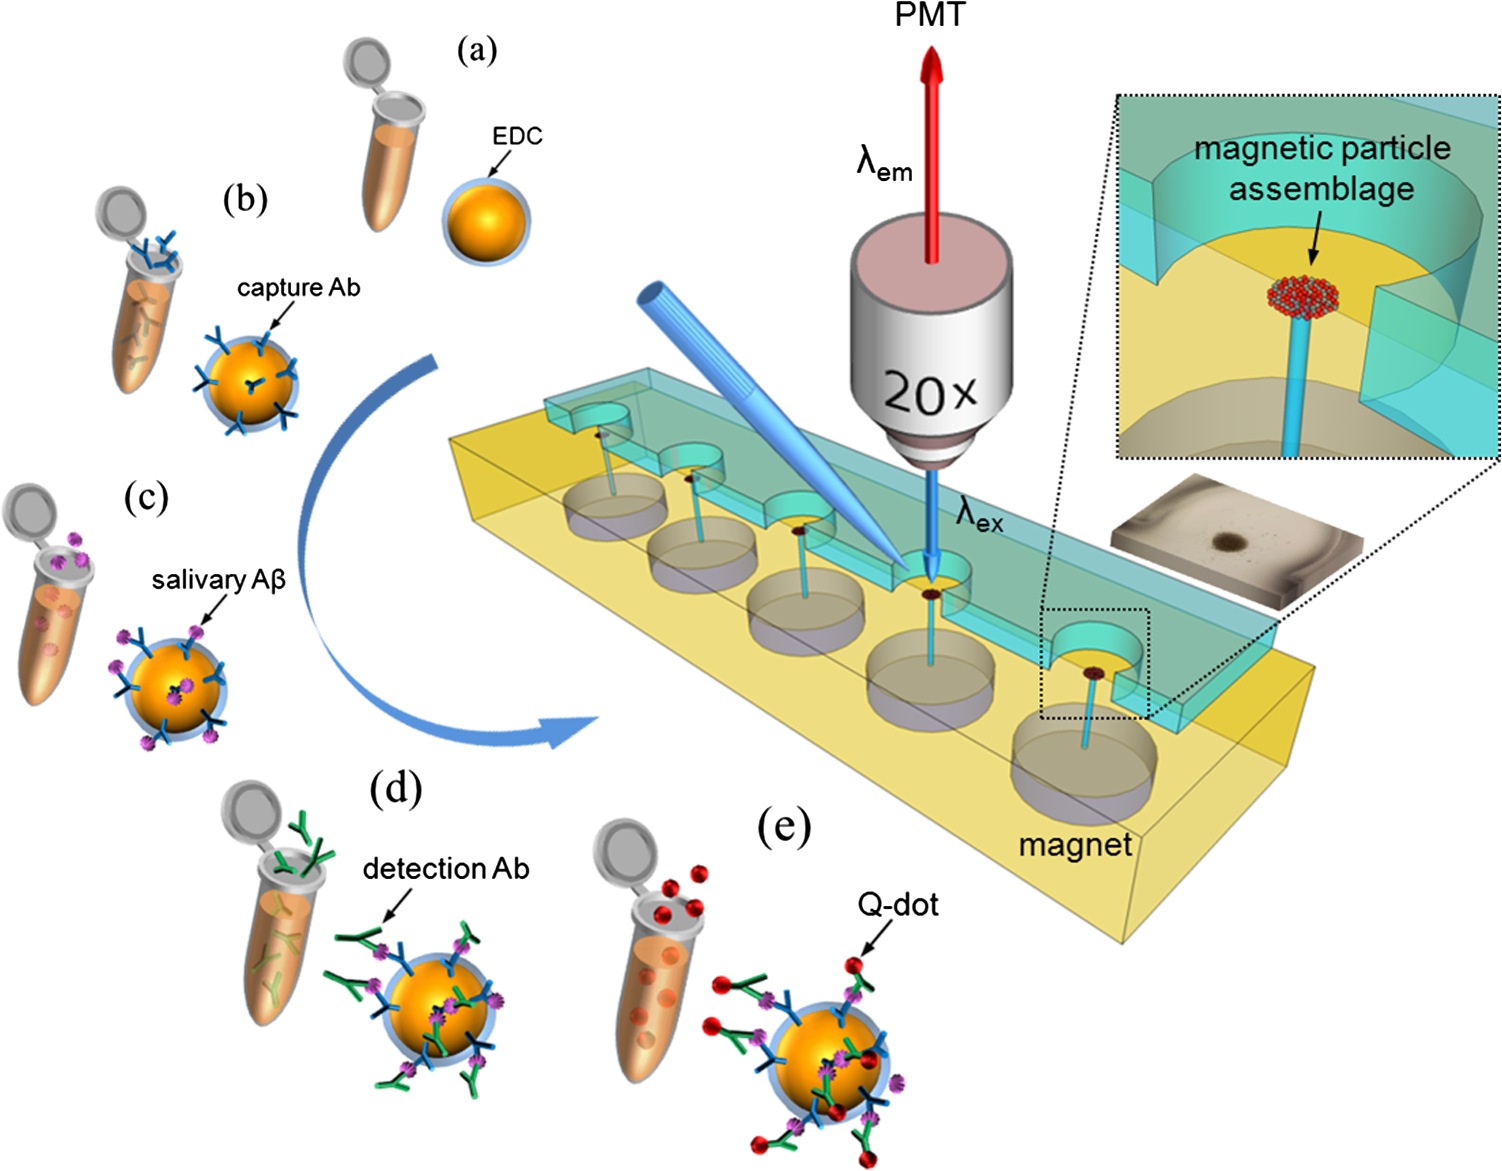 2.Materials and Methods2.1.SubjectFor antibody-based magnetoimmunoassay of salivary peptides in this study, two groups were examined: 28 putative ADs and 17 normal controls without any cognitive impairment and neuropathological symptoms. For all AD patients, diagnosis was done by clinically well-practiced medical doctors, according to the clinical mental examination and on the basis of the evidence of cognitive dysfunction, interference in daily life, and intellectual damage. All AD cases also performed the mini-mental state examination (MMSE) that has been generally used to identify current cognitive function of patients and would be helpful for AD diagnosis.31,32 The mean value of MMSE score for the AD patients was 17.3 (, maximum 28, minimum 3). The AD group was classified into severe and mild cognitive impairment (MCI) stages. The control group was composed of persons who have no family history of AD and the normal cognitive function and intellectuality. MMSE was also performed for the normal group: the mean value of MMSE score for the controls was 25.5 (, maximum 28, minimum 22). 2.2.Saliva CollectionSalivary samples were collected from both AD patients and healthy controls. All procedures carried out in this study were approved by the ethical permission, the Human Subjects Committees of the Chosun University. Informed consent was obtained prior to sample collection from all participants. Salivary samples were obtained using sterile centrifuge containers; thereafter, 2% sodium azide solution was added to prevent microbial decomposition.30,33 In this procedure, saliva samples were achieved under unstimulated condition, which requires resting condition of whole mouth for a while and subsequent salivary drooling.24,34 Participants were asked to rinse their mouth with purified water before providing saliva samples of approximately 2 to 3 ml into the containers. The samples were immediately frozen at until use. The samples were centrifuged at 1500 rpm for 7 min to remove debris in a similar manner that was previously described.30,35 2.3.Sandwich Immunoassay on Magnetic Nanoparticles (Antibody-Based Immunoassay)Carbodiimide-mediated coupling method was used for coupling of amino group of primary capture antibodies (monoclonal antibody, mouse, Covance, Dedham, Massachusetts) to the magnetic nanoparticles (, Chemicell, Berlin, Germany) containing terminal carboxylate groups, which is a binary covalent binding to guarantee a good immobilization of the antibodies on the nanoparticle surface. As graphically described in Fig. 1(a), 20 μl ( beads) of magnetic bead suspension was washed two times with 250 μl of 2-(-morpholino) ethanesulfonic acid (MES, pH 5.0, Sigma-Aldrich, St. Louis, Missouri) buffer using a magnetic separator. After second washing, the particles were resuspended in 250 μl of MES buffer containing 5 mg of water soluble 1-ethyl-3-(3-dimethylaminopropyl) carbodiimide (EDC, Sigma Aldrich) for 5 min at room temperature on a rotating wheel, which will enhance the uniform binding of the capture antibody to the entire bead surfaces at the next step. After an additional two times washing steps with 250 μl of MES buffer, the EDC-treated particles were resuspended in 250 μl of MES buffer. Given that 10 samples at the final step would be prepared at the concentration of particles per vial, 14 μl of the EDC-treated bead suspension was added to 86 μl of the MES buffer to prepare a 100-μl bead suspension with concentration of beads. Thereafter, 2 μl of the primary monoclonal capture antibodies were conjugated to the EDC-treated beads in the 100-μl suspension [Fig. 1(b)]. The antibody conjugation was performed at a concentration corresponding to eight times the minimum amount suggested by the manufacturer protocol (Chemicell) to effectively cover all the magnetic particles with the antibodies. The mixture was incubated on a rotating wheel for 2 h at room temperature. The capture antibody-conjugated beads were then washed two times with phosphate-buffered saline (PBS, pH 7.4, Sigma Aldrich) mixture including 0.1% bovine serum albumin (Sigma Aldrich), 0.05% Tween-20 (Sigma Aldrich), and 0.05% sodium azide (Sigma Aldrich). A 250 μl of blocking solution (goat serum, Covance) was introduced to the capture antibody-conjugated beads separated by a magnetic separator. After 30 min incubation, the suspension was washed two times with PBS mixture used at the previous step using a magnetic separator, then resuspended in 300 μl of PBS, and divided into 10 individual sample vials ( beads per 30 μl in a vial). Thereafter, the solutions containing antigens were loaded into each vial [Fig. 1(c)]: (1) For calibration of the photon-counting signals measured by PMT, the peptide solutions (Amyloid- protein fragment 1-40 or 1-42, 99%, Sigma-Aldrich) diluted to a few specified concentrations within the ranges from 10 to were introduced into each corresponding vial. A 1-μl drop of the calibration solution included the corresponding concentrations. (2) For salivary peptide detection for both probable AD patients and normal controls, 30 μl of individual saliva samples collected from the participants were added to the different vials containing capture antibody-treated nanobeads. After 2 h reaction between antigens and capture antibodies at room temperature, all individual vials were positioned on a magnetic separator to be washed two times with PBS mixture, and the -conjugated particles in each vial were resuspended in 30 μl PBS. A 2-μl drop of solution containing primary detection antibodies (polyclonal antibody, rabbit, Invitrogen, Grand Island, New York) was then introduced into each individual vial followed by 2 h reaction [Fig. 1(d)]. The epitopes of peptides react with paratopes of the detection antibodies which, at the next step, would bind to secondary antibodies (Q-dots 655, Invitrogen) for quantification by counting the number of photons emitted from Q-dots [Fig. 1(e)]. After 1 h incubation at room temperature, the fluorescence-treated nanobeads were washed with PBS mixture and resuspended in PBS at the final concentration ( beads per 300 μl in a vial). The nanobeads were then stored in a dark place at 4°C until use. To minimize nonspecific binding of the antibodies, we carried out enough washing processes between each step. The magnetic bead assemblage and sandwich immunoassay procedures are schematically described in Fig. 1. 2.4.Controllable Positioning of -Conjugated Nanobeads by Magnetic AttractionFollowing the consecutive processes of sandwich immunoassay, a 1-μl drop (concentration at beads) of the solution containing -conjugated magnetic nanobeads was gently introduced using a pipette on each sensing spot placed on one end of a steel bar that is in contact with a magnet at the other end. As described in Fig. 1, each sensing area is surrounded by an obtuse-angled arc-shaped PDMS guide and aligned with center of the steel bar with the strong magnetic attraction. We empirically realized that PDMS microfluidics was not a proper material for the treatment of nanoparticles due to a little sticky nature of PDMS that usually caused a tremendous loss of the nanoparticles during the flow, so we could not control the number of nanoparticles (or the size of the circular assemblage) at the final stage of the experiments. With no use of any microfluidic channel, we tried to use a small well () to confine the nanoparticle solution, but it was difficult to fill up the well with nanoparticle solution due to the trapped air inside the well. Therefore, an obtuse-angled arc-shaped PDMS guide was the most proper structure in confining the solution and controlling the formation of the circular assemblage, because its open wall helped the solution being easily filled in the structure. To prevent widespread scattering of nanobeads out of the sensing area and to achieve effective deposition within the area, the introduced nanobeads were required to decrease sedimentation rate with the assistance of hydraulic resistance in the water droplet, which was previously dropped on the sensing area. The magnetic nanobeads in the sensing area gradually formed a circular monolayer assemblage by the strong magnetic attraction from the tiny cylindrical wire, as shown in the schematically enlarged description and the inset. Figure 2 shows the arrayed sensing spots with five consecutive nanobead assemblages and their fluorescent images with which the samples from five different patients would be analyzed at a time. In almost every case of experiments, the size of the magnetic bead assemblages was pretty well adjusted in a controlled manner with a diameter of on average, and the assemblages were well aligned within each sensing area. It means that the number of magnetic beads in the assemblage was almost consistent and estimated to be approximately . There seemed to be no direct association between the diameter of circular assemblage and the size of the arc PDMS. The diameter of circular assemblage was affected by the number of nanoparticles existing in a droplet after the solution preparation processes, and also fast sedimentation caused the dispersion of the nanoparticles out of the sensing area. Fig. 2The arrayed sensing spots with five consecutive nanoparticle assemblages and their fluorescent images. The magnetic nanoparticles in the sensing area gradually formed a circular monolayer assemblage by the strong magnetic attraction from the tiny cylindrical wire placed beneath each sensing spot. The size of the magnetic bead assemblages was well adjusted in a controlled manner, and the assemblages were well aligned within each sensing area. 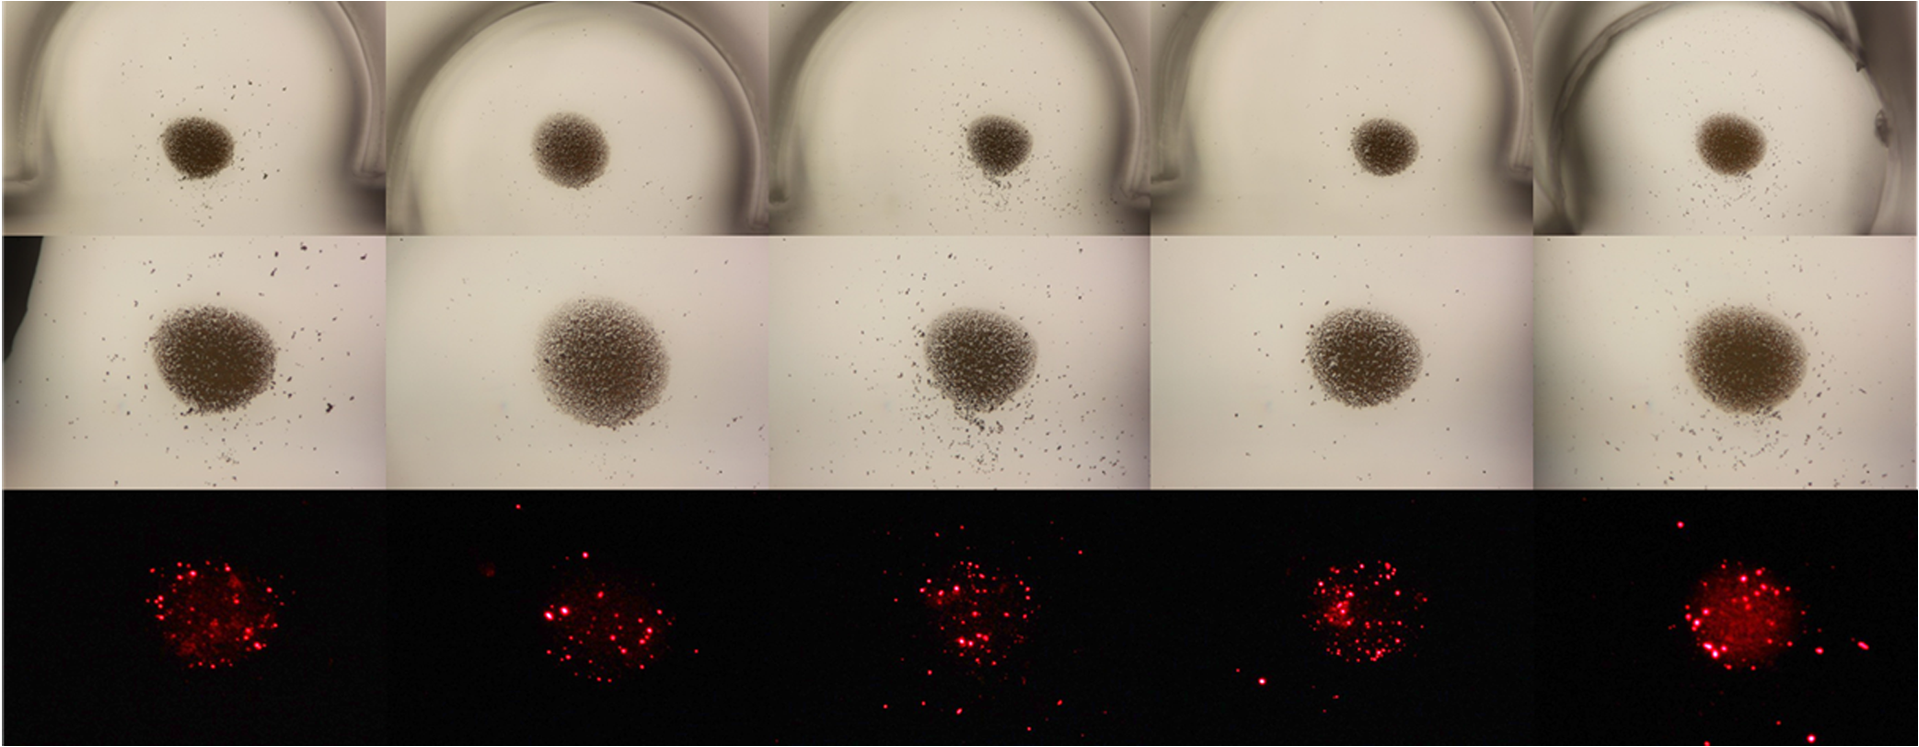 2.5.Photon Counting and Fluorescence ImagingQuantitative evaluation for salivary levels of the AD and control groups was performed by photon counting using a PMT. After a droplet of -conjugated nanobead solution was supplied on each sensing spot of the array system placed on the stage of the fluorescence microscope (Olympus, Daejeon, Korea, BX51) equipped with the PMT, the nanobead assemblage was formed [Fig. 3(a)], and the excitation light at a wavelength of 480 nm was applied to the assemblage on the sensing area. We measured the number of photons emitted at 655 nm from the fluorescent Q-dots labeled with peptides, which was carried out three times and took the average value for each sample. The virtual region-of-interest (ROI) for PMT analysis was set as a region on the fluorescent image, whose fluorescent light passes through on the way toward PMT, as shown in Fig. 3(b). The horizontal and vertical slits of the PMT for control of the amount of incident beam were precisely adjusted to the dimension of the squared ROI, meaning that we counted the photons emitted from the nanobeads exactly within the ROI, not from the surroundings out of the ROI. Fluorescence imaging was achieved using a high-sensitive CCD camera equipped to the fluorescence microscope. The power of excitation light from the UV source was fixed at 2.8 mW for all the experiments. In addition, transmission electron microscopy (TEM) images were taken to verify the labeling of Q-dots with peptides covalently bound to nanobead surfaces. For the AD case, much more Q-dots were indicated by white arrows in Fig. 3(c) compared with the control case in Fig. 3(d). Fig. 3(a) Formation of a salivary -conjugated nanoparticle assemblage with a diameter of . The number of magnetic beads in the assemblage was almost consistent and estimated to be approximately . (b) The virtual region-of-interest (ROI) for photomultiplier tube (PMT) analysis was set as a region on the fluorescent image, whose fluorescent light passes through on the way toward PMT. The number of photons emitted from the Q-dots was measured three times by a PMT, and the average value was taken for each sample. (c) Transmission electron microscopy (TEM) images were taken to verify the labeling of Q-dots covalently bound to nanobead surfaces for the Alzheimer’s disease (AD) case, showing that much more Q-dots were indicated, (d) compared with the control case.  3.Results3.1.Calibration of PMT Photon-Counting SignalPrior to the detection of the salivary peptides collected from probable AD patients using antibody-conjugated magnetic nanobead immunoassay, we were required to generate two standard calibration curves for the PMT photon-counting signals induced from the fluorescent Q-dots labeled with two different species ( and ). As previously described in brief, each species was diluted to the specified concentrations ranging from 10 to . A 1-μl drop of each species containing different concentrations was added to the capture antibody-treated nanobeads, followed by several processes of incubation and washing. Through the further processes such as detection–antibody conjugation and secondary Q-dot labeling, a certain amount of nanobeads was placed on the center of sensing area using magnetic attraction. The photons of fluorescence emitted from the Q-dots only within the squared ROI were counted by PMT for all calibration solutions of each species. Experiments were repeated more than three times for each concentration and for both species. The results are described in average values (squares) with standard deviation (SD), as shown in Figs. 4(a) and 4(b), forming a linear configuration as a function of the concentration. The fluorescent images of Q-dots for different concentrations (unit: ) of peptides were described in Fig. 5(a), indicating that a higher concentration of species allowed the detecting antibody and Q-dots to be more abundantly conjugated with peptides, which generate a stronger emission from a larger number of Q-dots than a lower concentration of . The dimension of the image indicates that of the ROI. Fig. 4PMT measurements of the photon-counting signals induced from the fluorescent Q-dots labeled with two different species: (a) for and (b) for . Standard calibration curves (squares) and the photon-counting measurements for AD severe group (red square), mild cognitive impairment (MCI) group (blue square), and control group (green square).  Fig. 5Fluorescent images of Q-dots at different concentrations. Higher concentration of species allowed the detecting antibody and Q-dots to be more abundantly conjugated with peptides, generating stronger emission from larger number of Q-dots than lower concentration. (a) Standard calibration solution at different concentrations (unit: ). Fluorescent images of Q-dots conjugated with salivary obtained (b) from normal group, (c) from MCI case, and (d) from severe AD case. 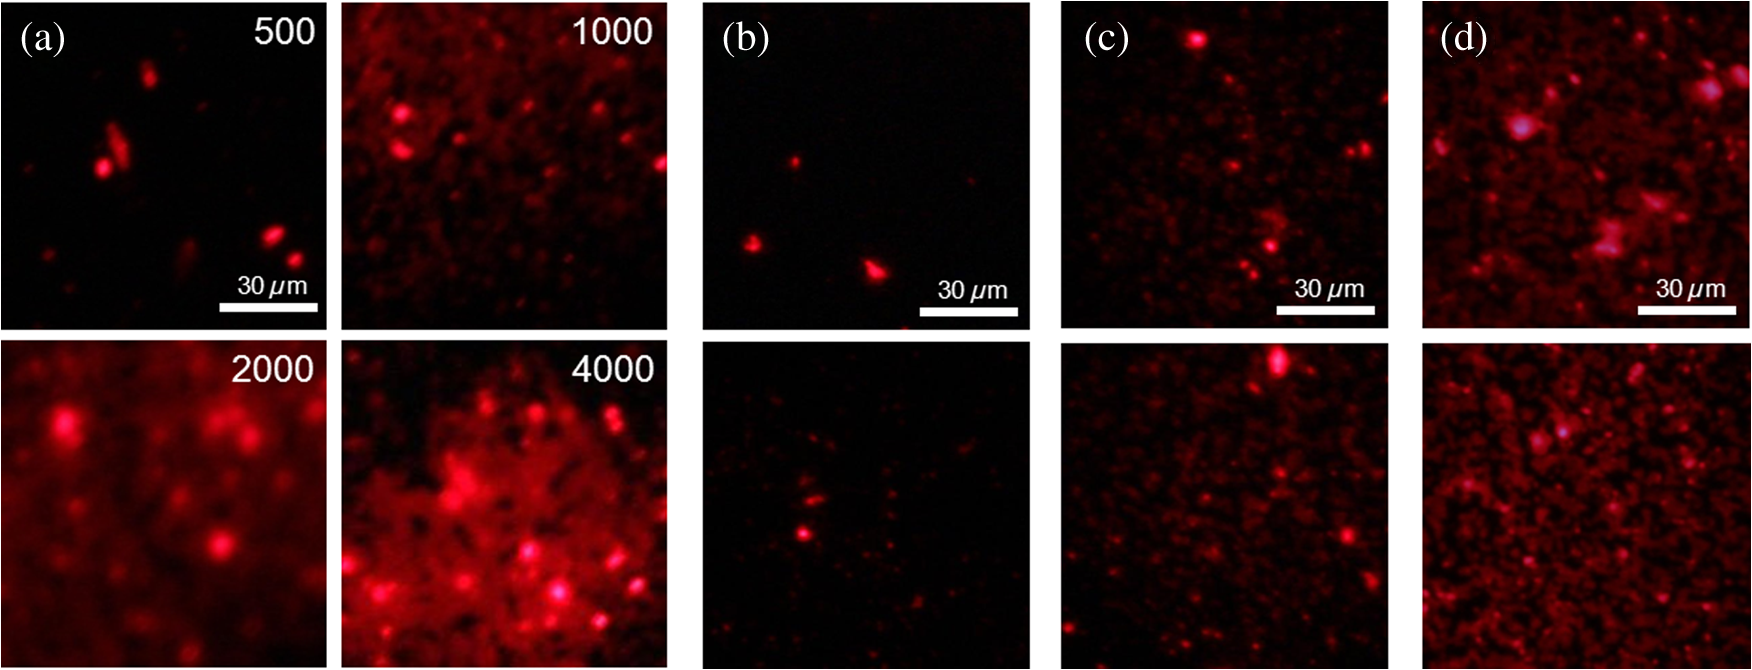 3.2.Salivary LevelsThe photon-counting assessments for salivary levels of both and peptides using PMT were performed for totally 45 putative AD patients and controls. After antibody-conjugated magnetic nanobead immunoassaying, it was unequivocal that our method was able to identify the existence of the peptides in human saliva as demonstrated in a previous study.30 A sensitive ELISA (Covance) was used as a gold-standard reference using saliva samples from the same participants. The putative AD patients were classified into two groups: severe and MCI stages. They had similarity in age and gender. The salivary levels resulting from the photon-counting measurements showed a distinct inclination to increase for AD patients (red square) compared with control group (green square), as shown in Fig. 4(a), which statistically seemed to be significantly different. Comparison within the AD group also had a tendency toward an obvious increase in the level for the severe stage (red square) compared with the MCI stage (blue square), meaning a statistically noteworthy difference, however, which still showed a high SD. This finding showed an antithetical tendency to a previous report, in which the levels of severe AD stage were lower than those of more moderate stages.30 Regarding the photon counting of the salivary , the results showed a similar trend to those of cases for all categories of this study, as shown in Fig. 4(b), however, statistically, with no significant differences. These findings also had conflicting results over the previous report in which levels remained unchanged for all AD cases as well as the control group.30 However, our results were carefully compared using a sensitive ELISA. The results obtained from ELISA were compared with those from PMT and showed a similar trend between the two results (data not shown). Given that the definite mechanism of how peptides accumulate in saliva has not been clearly determined yet, our results might be carefully worth consideration, which should be clarified through the future study with more participants. The fluorescent images of Q-dots conjugated with salivary obtained from normal group were shown in Fig. 5(b). Also, the fluorescent images of Q-dots obtained from the MCI and severe cases were shown in Figs. 5(c) and 5(d), respectively. It is apparent from these images that the fluorescent intensity from the severe cases seems to be much stronger than that of the MCI cases, indicating that the higher concentration in saliva of the severe cases allowed the detecting antibody and Q-dots to be more abundantly conjugated with peptides. 4.Discussionhas been known to be intimately related to AD pathogenesis and biochemically proved to be the most definitively promising biomarker of AD.10–12 Our method explicitly revealed the presence of in human saliva and was able to detect and measure the salivary levels using a simple detecting method. Compared with the results of ELISA as a reference, our method had a high-accuracy rate for identification of peptides in human saliva. One of the important results from our study was that salivary levels were elevated in MCI stage compared with normal stage, indicating that our method showed the potential as an early diagnostic tool with simple processes. As early initiation of AD treatments has been known as a significant therapeutic intervention for preventing the intracerebral spreading of peptides, early diagnosis of AD is treated to be highly significant in recent days, and the detection of AD biomarker seems to be critical in routine clinical examinations. Biomarkers need to be evaluated as a reliable indicator of a disease, and their specificity and ease-of-use are crucially regarded as an ultimate diagnostic utility.23 The identification of biomarker for diagnosing AD has been largely focused on the use of CSF or blood plasma.22 The CSF biomarker currently has been known to be the most validated, and, however, is quite limited due to painful invasive collecting methods. Use of blood plasma is less potential due to relatively poor reproducibility. Saliva has obtained attention as potential diagnostic fluid with a wide spectrum of proteins over the past decade. With the advantage of noninvasive sample collection method, the identification of in human AD saliva is considered to be of significance, as it may serve as a potential indicator of AD. Although the exact mechanism of how could increase in saliva is still equivocal, the accumulation of salivary might be induced from -secretase cleavage against APP expressed in salivary epithelial cells derived from AD patients.28 In this study, we reported that the salivary levels of peptide increased as the severity of AD increases, which showed rather antithetical tendency to the previous reports for the severe AD stage. Our results revealed that levels were higher in severe AD stage than in MCI stage which was also higher than in normal stage, whereas, in other researches, the levels were reduced for the severest AD stage in saliva30 and CSF30,36–38 of AD patients. Although loss of the intracerebral neurons producing monomers by - and -secretase cleavage against APP might lower salivary levels,30 it may be possible that the salivary concentration could relatively increase as the severity of AD becomes higher due to the apparently diminished amount of saliva caused by significant impairment of submandibular gland.26 But more apparent biological evidences are still needed to clarify the mechanism of how the peptides accumulate in salivary gland and flow with saliva. More to the point, the early diagnosis with highly accurate detecting method for the AD biomarkers has been recently emphasized to predict people at high risk of AD. Even though the definitive diagnosis of AD requires clinically combinational assessments, including postmortem verification about AD brain,23,39 the accurate early detection of the AD biomarkers deserves an important performance for diagnosing the putative AD patients. Therefore, it is imperative that a rapid and reliable method for the early diagnostic detection of AD biomarkers can be established. In this study, we used a facile microarraying method that enabled the identification of the salivary levels for the MCI cases with the assistance of magnetically assembled antibody-conjugated nanoparticles. Our measuring method did not require complicated, time-consuming, labor-dependent processes and high-end devices. This method demonstrates a facile approach for the analysis of quantification using magnetic force and magnetic silica nanoparticles, enabling one to simply detect salivary peptides at a concentration as low as , which might be somewhat higher than the commercial ELISA systems. According to the protocol of the ELISA system used as a reference in this study, the lowest measurable concentration of the standard peptides is , which might be a little ambiguous because the curve-fit for the calibration does not satisfy a very accurate linearity for the very low concentration ranges. However, it is expected that our simple magnetoimmunoassay system may have a trustworthy potential as a detector for low-level peptides with weak-fluorescence emission. 5.ConclusionsWe utilized saliva as a biomarker medium to correlate the salivary levels to AD pathological aspects, especially to the MCI group among AD patients, to verify our detecting system to be sensitive for an early diagnostic tool. We used a facile microarraying method using magnetically assembled antibody-conjugated nanoparticles with assistance of a PMT as an optical detector. Our measuring method does not require complicated, time-consuming processes and high-end devices such as highly sophisticated neuroimaging devices. The magnetic particle-collecting platform simply consists of the sensing array and the magnetic bars placed beneath each sensing region with alignment. This simple magnetoimmunoassay system measures the photointensity generated by fluorescence, enables the quantification of the peptides from AD salivary samples, and consequently classifies the salivary levels into AD pathological aspects. This method demonstrates a facile approach enabling one to simply detect salivary peptides at a concentration as low as . It is expected that our simple magnetoimmunoassay system may have a reliable potential as a detector for low-level peptides with weak-fluorescence emission. AcknowledgmentsThis research was supported by the Converging Research Center Program through the Ministry of Science, ICT and Future Planning, Korea (2013K000367). ReferencesR. L. Nussbaumet al.,
“Alzheimer’s disease and Parkinson’s disease,”
N. Engl. J. Med., 348
(14), 1356
–1364
(2003). http://dx.doi.org/10.1056/NEJM2003ra020003 NEJMAG 0028-4793 Google Scholar
G. McKhannet al.,
“Clinical diagnosis of Alzheimer’s disease: report of the NINCDS-ADRDA Work Group under the auspices of Department of Health and Human Services Task Force on Alzheimer’s disease,”
Neurology, 34
(7), 939
–944
(1984). http://dx.doi.org/10.1212/WNL.34.7.939 NEURAI 0028-3878 Google Scholar
D. H. Smallet al.,
“Alzheimer’s disease and toxicity: from top to bottom,”
Nat. Rev. Neurosci., 2
(8), 595
–598
(2001). http://dx.doi.org/10.1038/35086072 NRNAAN 1471-0048 Google Scholar
L. Bertramet al.,
“The current status of Alzheimer’s disease genetics: what do we tell the patients?,”
Pharmacol. Res., 50
(4), 385
–396
(2004). http://dx.doi.org/10.1016/j.phrs.2003.11.018 PHMREP 1043-6618 Google Scholar
R. E. Tanziet al.,
“Twenty years of the Alzheimer’s disease amyloid hypothesis: a genetic perspective,”
Cell, 120
(4), 545
–555
(2005). http://dx.doi.org/10.1016/j.cell.2005.02.008 CELLB5 0092-8674 Google Scholar
L. Bertramet al.,
“Thirty years of Alzheimer’s disease genetics: the implications of systematic meta-analyses,”
Nat. Rev. Neurosci., 9
(10), 768
–778
(2008). http://dx.doi.org/10.1038/nrn2494 NRNAAN 1471-0048 Google Scholar
J. Williamsonet al.,
“Genetic aspects of Alzheimer disease,”
Neurologist, 15
(2), 80
–86
(2009). http://dx.doi.org/10.1097/NRL.0b013e318187e76b 1074-7931 Google Scholar
J. Hardyet al.,
“The amyloid hypothesis of Alzheimer’s disease: progress and problems on the road to therapeutics,”
Science, 297
(5580), 353
–356
(2002). http://dx.doi.org/10.1126/science.1072994 SCIEAS 0036-8075 Google Scholar
S. D. Yanet al.,
“An intracellular protein that binds amyloid- peptide and mediates neurotoxicity in Alzheimer’s disease,”
Nature, 389
(6652), 689
–695
(1997). http://dx.doi.org/10.1038/39522 NATUAS 0028-0836 Google Scholar
D. A. Butterfieldet al.,
“Evidence of oxidative damage in Alzheimer’s disease brain: central role for amyloid -peptide,”
Trends Mol. Med., 7
(12), 548
–554
(2001). http://dx.doi.org/10.1016/S1471-4914(01)02173-6 TMMRCY 1471-4914 Google Scholar
M. Meyer-Luehmannet al.,
“Extracellular amyloid formation and associated pathology in neural grafts,”
Nat. Neurosci., 6
(4), 370
–377
(2003). http://dx.doi.org/10.1038/nn1022 NANEFN 1097-6256 Google Scholar
F. M. LaFerlaet al.,
“Intracellular amyloid- in Alzheimer’s disease,”
Nat. Rev. Neurosci., 8
(7), 499
–509
(2007). http://dx.doi.org/10.1038/nrn2168 NRNAAN 1471-0048 Google Scholar
J. F. Reillyet al.,
“Amyloid deposition in the hippocampus and entorhinal cortex: quantitative analysis of a transgenic mouse model,”
Proc. Natl. Acad. Sci. U. S. A., 100
(8), 4837
–4842
(2003). http://dx.doi.org/10.1073/pnas.0330745100 PNASA6 0027-8424 Google Scholar
S. L. Pimlottet al.,
“SPECT imaging in dementia,”
Br. J. Radiol., 80
(2), S153
–S159
(2007). http://dx.doi.org/10.1259/bjr/89285735 BJRAAP 0007-1285 Google Scholar
W. E. Klunket al.,
“Imaging brain amyloid in Alzheimer’s disease with Pittsburgh compound-B,”
Ann. Neurol., 55
(3), 306
–319
(2004). http://dx.doi.org/10.1002/(ISSN)1531-8249 ANNED3 0364-5134 Google Scholar
K. Shoghi-Jadidet al.,
“Localization of neurofibrillary tangles and beta-amyloid plaques in the brains of living patients with Alzheimer disease,”
Am. J. Geriatr. Psychiatr., 10
(1), 24
–35
(2002). http://dx.doi.org/10.1097/00019442-200201000-00004 1064-7481 Google Scholar
M. Hintersteineret al.,
“In vivo detection of amyloid- deposits by near-infrared imaging using an oxazine-derivative probe,”
Nat. Biotechnol., 23
(5), 577
–583
(2005). http://dx.doi.org/10.1038/nbt1085 NABIF9 1087-0156 Google Scholar
H. Benvenisteet al.,
“Detection of neuritic plaques in Alzheimer’s disease by magnetic resonance microscopy,”
Proc. Natl. Acad. Sci. U. S. A., 96
(24), 14079
–14084
(1999). http://dx.doi.org/10.1073/pnas.96.24.14079 PNASA6 0027-8424 Google Scholar
M. Higuchiet al.,
“19F and 1H MRI detection of amyloid plaques in vivo,”
Nat. Neurosci., 8
(4), 527
–533
(2005). http://dx.doi.org/10.1038/nn1422 NANEFN 1097-6256 Google Scholar
Z.-H. Choet al.,
“A fusion PET–MRI system with a high-resolution research tomograph-PET and ultra-high field 7.0 T-MRI for the molecular-genetic imaging of the brain,”
Proteomics, 8
(6), 1302
–1323
(2008). http://dx.doi.org/10.1002/(ISSN)1615-9861 PROTC7 1615-9853 Google Scholar
K. Blennow,
“CSF biomarkers for Alzheimer’s disease: use in early diagnosis and evaluation of drug treatment,”
Expert Rev. Mol. Diagn., 5
(5), 661
–672
(2005). http://dx.doi.org/10.1586/14737159.5.5.661 ERMDCW 1473-7159 Google Scholar
K. Blennowet al.,
“Cerebrospinal fluid and plasma biomarkers in Alzheimer disease,”
Nat. Rev. Neurol., 6
(3), 131
–144
(2010). http://dx.doi.org/10.1038/nrneurol.2010.4 NRNACP 1759-4758 Google Scholar
C. Humpel,
“Identifying and validating biomarkers for Alzheimer’s disease,”
Trends Biotechnol., 29
(1), 26
–32
(2011). http://dx.doi.org/10.1016/j.tibtech.2010.09.007 TRBIDM 0167-7799 Google Scholar
T. Pfaffeet al.,
“Diagnostic potential of saliva: current state and future applications,”
Clin. Chem., 57
(5), 675
–687
(2011). http://dx.doi.org/10.1373/clinchem.2010.153767 0009-9147 Google Scholar
M. Shiet al.,
“Salivary tau species are potential biomarkers of Alzheimer’s disease,”
J. Alzheimers Dis., 27
(2), 299
–305
(2011). http://dx.doi.org/10.3233/JAD-2011-110731 JADIF9 1387-2877 Google Scholar
J. A. Shipet al.,
“Diminished submandibular salivary flow in dementia of the Alzheimer type,”
J. Gerontol., 45
(2), M61
–M66
(1990). http://dx.doi.org/10.1093/geronj/45.2.M61 JOGEA3 0022-1422 Google Scholar
J. A. Shipet al.,
“Longitudinal study on oral health in subjects with Alzheimer’s disease,”
J. Am. Geriatr. Soc., 42
(1), 57
–63
(1994). JAGSAF 0002-8614 Google Scholar
Y. S. Ohet al.,
“Effect of -secretase inhibitors on muscarinic receptor-mediated calcium signaling in human salivary epithelial cells,”
Am. J. Physiol. Cell. Physiol., 291
(1), C76
–C82
(2006). http://dx.doi.org/10.1152/ajpcell.00508.2005 0363-6143 Google Scholar
Z. Wanget al.,
“Microcontact printing of polyelectrolytes on PEG using an unmodified PDMS stamp for micropatterning nanoparticles, DNA, proteins and cells,”
Soft Matter, 8
(29), 7630
–7637
(2012). http://dx.doi.org/10.1039/c2sm25835h 1744-683X Google Scholar
F. Bermejo-Parejaet al.,
“Saliva levels of Abeta1-42 as potential biomarker of Alzheimer’s disease: a pilot study,”
BMC Neurol., 10 108
(2010). http://dx.doi.org/10.1186/1471-2377-10-108 BNMEC8 1471-2377 Google Scholar
M. F. Folsteinet al.,
“Mini-mental state: a practical method for grading the cognitive state of patients for the clinician,”
J. Psychiatr. Res., 12
(3), 189
–198
(1975). http://dx.doi.org/10.1016/0022-3956(75)90026-6 JPYRA3 0022-3956 Google Scholar
J. L. Cummings,
“Mini-mental state examination norms, normals, and numbers,”
JAMA, 269
(18), 2420
–2421
(1993). http://dx.doi.org/10.1001/jama.1993.03500180112046 JAMAAP 0098-7484 Google Scholar
S. A. Decker,
“Low salivary cortisol and elevated depressive affect among rural men in Botswana: reliability and validity of laboratory results,”
J. Physiol. Anthropol., 25
(1), 91
–101
(2006). http://dx.doi.org/10.2114/jpa2.25.91 1880-6791 Google Scholar
K. E. Mostov,
“Transepithelial transport of immunoglobulins,”
Annu. Rev. Immunol., 12 63
–84
(1994). http://dx.doi.org/10.1146/annurev.iy.12.040194.000431 ARIMDU 0732-0582 Google Scholar
R. Motteret al.,
“Reduction of beta-amyloid peptide42 in the cerebrospinal fluid of patients with Alzheimer’s disease,”
Ann. Neurol., 38
(4), 643
–648
(1995). http://dx.doi.org/10.1002/(ISSN)1531-8249 ANNED3 0364-5134 Google Scholar
T. Sunderlandet al.,
“Decreased beta-amyloid 1–42 and increased tau levels in cerebrospinal fluid of patients with Alzheimer disease,”
JAMA, 289
(16), 2094
–2103
(2003). http://dx.doi.org/10.1001/jama.289.16.2094 JAMAAP 0098-7484 Google Scholar
M. O. Dietrichet al.,
“Megalin mediates the transport of leptin across the blood-CSF barrier,”
Neurobiol. Aging, 29
(6), 902
–912
(2008). http://dx.doi.org/10.1016/j.neurobiolaging.2007.01.008 NEAGDO 0197-4580 Google Scholar
A. Tamaokaet al.,
“Amyloid beta protein 42(43) in cerebrospinal fluid of patients with Alzheimer’s disease,”
J. Neurol. Sci., 148
(1), 41
–45
(1997). http://dx.doi.org/10.1016/S0022-510X(96)00314-0 JNSCAG 0022-510X Google Scholar
C. H. Schencket al.,
“A case of REM sleep behavior disorder with autopsy-confirmed Alzheimer’s disease: postmortem brain stem histochemical analyses,”
Biol. Psychiatr., 40
(5), 422
–425
(1996). http://dx.doi.org/10.1016/0006-3223(96)00070-4 BIPCBF 0006-3223 Google Scholar
|


