|
|
1.IntroductionIron acts as an essential cofactor in many cellular functions of the central nervous system, such as DNA synthesis, the mitochondrial electron transport system, and neurotransmission.1 During normal aging, iron accumulates in various brain areas, with especially high concentration in the structures of the globus pallidus, red nucleus, dentate nucleus, and substantia nigra (SN).2 It is not certain yet why iron is selectively accumulated in these areas in a nonuniform manner. Dopaminergic neurons are located in a subarea of the SN and the pars compacta. Progressive loss of these neurons is a pathological hallmark of Parkinson’s disease (PD), together with abnormally high deposition of iron in this area.3 The elevated iron level in the SN of PD has been demonstrated by autopsy,2 with 7-Tesla magnetic resonance imaging,4 and by transcranial sonography.5 The abnormal accumulation of iron may be associated with oxidative stress,6 and imbalance of mechanisms controlling iron homeostasis may have a causal influence on the pathogenesis of PD.7 The iron is changed in the brain between ferrous () and ferric () states via electron exchange process. The accumulated irons participate in the fenton reaction with hydrogen peroxide and bring about oxidative stress through the reactive oxygen species (ROS). Both neuromelanin and synthetic dopamine-melanin are bound to iron with a high degree and act as a strong iron chelator and scavenger of cytoplasmic iron.8 Dopaminergic cells in the SN and ventral tegmental areas might be vulnerable to oxidative stress and selectively involved in this manner. Then the degree of oxidative stress in the iron-laden dopaminergic cells might be various depending on the location of iron in the nucleus, mitochondria, and other cytosolic organelles. Specific neurotoxin is used for the cellular model of PD in vitro. 1-Methyl-4-phenyl-1,2,3,6-tetrahydropyridine is a potent neurotoxin, converted by monoamine oxidase type B to the 1-methyl-4-phenylpyridinium (MPP+) in the brain. MPP+ is moved into the cell via dopamine transporter, particularly concentrated into mitochondria and therefore induces significantly decreased mitochondrial complex-I activity. Through this process, the depletion of ATP and increasing of reactive oxygen species (ROS) linking iron induces selective cell death of dopaminergic neurons.9 To elucidate the role of iron as a potential cause of PD, understanding the distribution and quantification of cellular iron is essential. However, the extremely low concentration of iron in the cell is difficult to detect and to quantify by existing microscopy. Most previous quantification studies depended on the colorimetric ferrozine-based assay using cell lysates.10,11 With a matter of concern, cellular iron level is influenced by microscopic changes in temperature or pH and may be changed by the physiological state of the cells with various chemicals.11 Moreover, the previous methods have limitations to observe the location of iron and have difficulty analyzing the amount of iron in the intracellular organelles. An analytical technique with high-resolution imaging is needed for the visualization and quantification of cellular iron elevation as the pathology of PD progresses. Conventional optical microscopy, with its large field-of-view and easy accessibility, is a popular choice for observing cells and tissues in biological experiments. Conventional optical microscopy has a near submicron range of spatial resolution (SR) by visible light,12 but this resolution is not sufficient to image cellular iron. In this paper, we introduce a cellular iron imaging technique with a nanoscale SR optical microscope () which does not require staining or chemical modification as with ferrozine. To observe the localized cellular iron and perform direct quantification without cell lysis or a staining method, we used a visible/near infrared (VNIR) hyperspectral fluorescence signal imaging system with a high-resolution dark-field optical condenser.13 This nanoscale optical hyperspectral imaging system is different from the conventional optical microscope with regard to SR and spectral absorption techniques. The SR is 40–90 nm by metal halide light, which is a relatively high SR compared to that of a conventional optical microscope. For instance, it has been used to image quantum dots14 and the interaction and uptake of nanoparticles in cells and tissues.15,16 The hyperspectral imager absorbs the intrinsic fluorescence signal from the iron in the VNIR spectral range. This signal is scanned and mapped onto the cell image collected under the dark-field optical microscope. Because of the large field-of-view with high SR, we were able to image and map a large number of cells at one time—a procedure that is not possible with X-ray fluorescence (XRF) microscopy.17,18 In this study, we introduced high-resolution dark-field optical microscopy to directly observe the VNIR hyperspectral fluorescence signal of cellular iron in a cellular model of PD.13 2.Materials and Methods2.1.Cell CultureHuman neuroblastoma dopaminergic cells (SHSY5Y; ATCC, Virginia) were grown in Dulbecco’s modified Eagle’s medium (DMEM; Invitrogen, New York) supplemented with 10% heat-inactivated fetal bovine serum (FBS; Sigma-Aldrich, Missouri) and 1% penicillin-streptomycin (Invitrogen, New York) in a T75 flask at 37°C and 5% in an incubator. The cells were incubated in serum-free conditioning medium and were treated with 300 μM of MPP+ for 24 h in the model of PD. MPP+-induced PD cells were treated with 100 μM of FAC (ferric ammonium citrate, Sigma-Aldrich, Missouri) for either 1 or 6 h to induce iron deposition. Each cell preparation was then washed three times with 1 ml of PBS. The cells were seeded on a cover glass coated with laminin (Roche Diagnostics GmbH, Mannheim, Germany) and grown in a 12-well plate in a 5% incubator. 2.2.Sample PreparationThe neural cells on cover glass were fixed for 20 min with a 4% paraformaldehyde solution (Biosesang, Seongnam, South Korea) and rinsed three times with PBS at room temperature. The cells were mounted on a slide using mounting medium (Dako Cytomation, California). The samples were stored at 4°C before imaging. 2.3.ImagingA hyperspectral nanoscale optical imaging system was assembled with a VNIR spectral range hyperspectral imager (CytoViva, Inc., Alabama), a high-resolution dark-field condenser (Numerical Aperture; ; CytoViva, Inc., Alabama) and an illuminator system (metal halide light; Welch Allyn Inc., New York) on an Olympus microscope (BX-53, Japan). The construct diagram of imaging system is shown in Fig. 1(a). This system provided resolution with an improved contrast and signal-to-noise ratio.13 The high-resolution dark-field condenser was directly positioned on the slide glass upon the workstage with the immersion solution and focused until to get a donut ring type in pattern of light. The dark-field optical image of sample was acquired and then hyperspectral absorption signal was recorded in the same position of sample. The images in the slide were obtained and recorded with a CCD camera (Olympus Microsystems, BX-53, Japan). Fig. 1Hyperspectral fluorescence signals and mapping images of iron [ferric ammonium citrate (FAC)] dispersed in water. (a) A schematic of the hyperspectral imaging system with visible/near infrared (VNIR) spectral range. (b) VNIR hyperspectral absorption profile of iron. (c) High-resolution optical image of iron with a dark-field nanoscale optical condenser. (d) The mapped hyperspectral signal is shown in red. Almost all points are identically mapped with the iron deposits shown in (c). 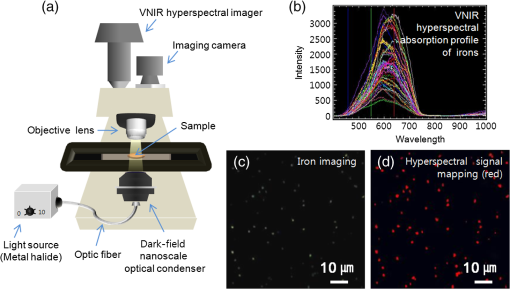 2.4.Data Analysis and StatisticsRegion of interest (ROI) of cells tracing and analysis of the hyperspectral absorption signal were performed using CytoViva imaging software and Olympus microscope software (BX-53, Japan). Statistical evaluation was performed using an independent t-test (SPSS19, International Business Machines Corp., New York). Significant difference, *; -value . 3.Results and Discussion3.1.High-Resolution Hyperspectral Optical Imaging in CellsWe used the high-resolution dark-field imaging and hyperspectral fluorescence signal imaging system for the detection of cellular iron in a cellular model of PD. The imaging system has several compartments for high-resolution imaging up to the several nanometer range, which we have designated nanoscale resolution. These include a VNIR spectral range hyperspectral imager, a dark-field nanoscale optical condenser (numerical aperture; ), and a metal halide light illuminator [Fig. 1(a)]. This imaging system, which was developed by CytoViva, Inc., can visualize dark-field optical images of the sample and record the VNIR hyperspectral fluorescence signal absorption from the intrinsic signal. It can also visualize the fluorescence-tagged biosample. Using this system, we collected the fluorescence absorption signals from iron (FAC) to build a reference signal profile [Fig. 1(b)]. The signals showed peak absorption near 600 nm and varied in intensity; the intensity difference was due to the variable size of the iron aggregates. We also obtained the dark-field optical image of FAC iron [Fig. 1(c)]. This image was scanned with the reference signal, and then mapped in a red color [Fig. 1(d)]. The mapping results were highly correlated in Figs. 1(c) and 1(d). We mapped the reference signal from the FAC iron deposits in water onto the dark-field image of cells treated with FAC [Fig. 2(a)]. The cells were prepared on a laminin-coated glass slide. The numerous extracellular iron aggregates (bulk iron) that were detected are shown in red color [Fig. 2(a)]. The hyperspectral fluorescence absorption signal profiles from the cells and iron deposits were compared in Fig. 2(b). Each square box was an ROI designated in Fig. 2(a). The extracellular bulk iron exhibited a very-high-intensity signal compared to the cell (cytoplasm, nucleus) or glass. The magnified images of the center of ROIs, including the high-intensity signal from the bulk iron, are shown in Fig. 2(c). Fig. 2Spectral profiles of different regions of the cells. (a) Dark-field images of the SHSY5Y cells [1-methyl-4-phenylpyridinium (MPP+)] incubated with FAC for 1 h, with the hyperspectral signal mapping areas marked by colored boxes. (b) The hyperspectral signal intensity of each area. All bulk iron areas have a peak absorbance near 600 nm, whereas the peak signal in the cells is near 500 nm and the signal on the glass plate is almost zero. (c) Magnified images () of the hyperspectral fluorescence signal mapped from the glass, cytoplasm, nucleus, and bulk iron. 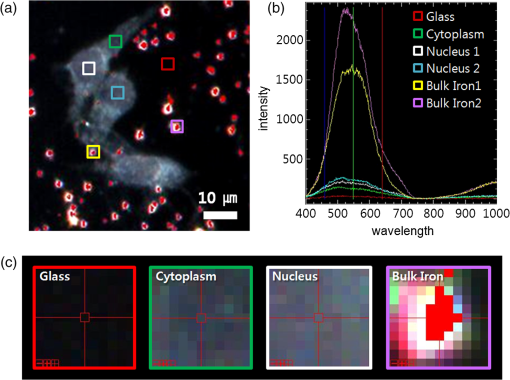 3.2.Cellular Iron Imaging in PD Cell ModelTo investigate the distribution of cellular iron in the PD condition, we used the MPP+-induced SHSY5Y cells for an in vitro cell model of PD.9 Cells were imaged as above, and the hyperspectral signal of iron was mapped in the cells conditioned using an treatment. We studied the variation in iron aggregation between a transient exposure (1 h) and a heavy exposure (6 h) to FAC. Figure 3 shows the hyperspectral mapping images of the cellular iron detected in the cells. Fig. 3Iron detection in the MPP+-induced Parkinson’s disease (PD) cell model and the dependence of iron aggregation on the time of exposure. The dark field optical images (first row) and iron detection images (second row) in the SHSY5Y cells exposed with MPP+ only (without FAC) and with FAC for 1 or 6 h as a sign in right side. The hyperspectral iron signal on the mapping images indicated by red color (third row). All scale bars: 40 μm. 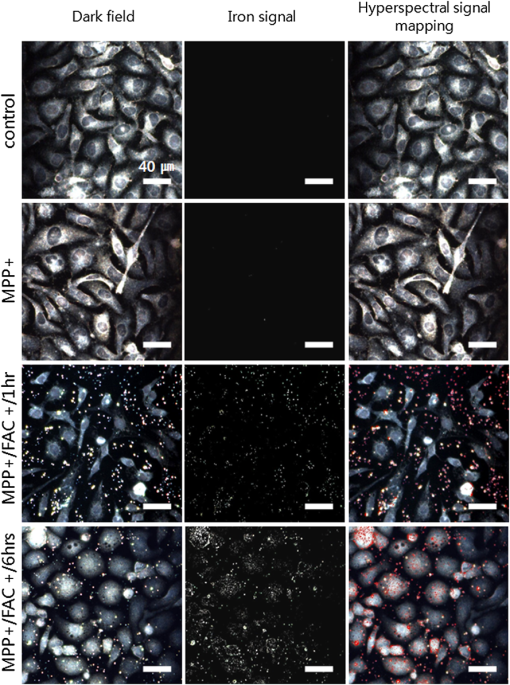 The magnified mapping images show the detailed cellular location of the iron (Fig. 4). Each cell was exposed to FAC for 1 h. The mapped location of iron was near the edge of most of the cells. Points a, b, c, d, and e are the yellow boxes in Figs. 4(a) and 4(b). The large bulk iron aggregates were dispersed in the extracellular area and several were detected on the cell surface. Many small particle-like iron deposits were located in the cells. Specifically, small iron clusters were found in the dendrites of cells, indicated by blue arrows in the images of d and e in Fig. 4. Fig. 4Iron deposition in the MPP+-induced PD model after 1 h of exposure to FAC. The hyperspectral iron signals (a) were mapped onto the cell images (b) with red color. The magnified () and representative images show in the points a, b, c, d, and e image set marked with yellow boxes in (a) and (b). Each a, b, c, d, and e image set has iron signal image (left) and mapped image on a cell (right). The blue arrows in d and e show very small particles. Scale bars (a and b): 40 μm. Scale bars (a, b, c, d, and e): 10 μm. 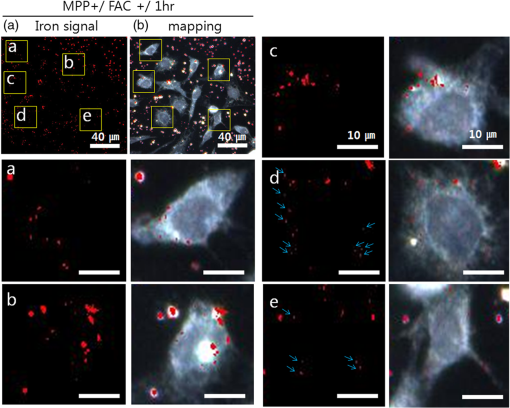 In addition, we observed an even higher iron signal after 6-h exposure (Fig. 5). Dense iron deposits were detected in the MPP+-induced PD cells, and some of the cells shrank. The high iron accumulation was spread uniformly throughout individual cells and was found in most of the imaged cells [Figs. 5(a), 5(b), and 5(d)]. Locally deposited iron existed along the cell membrane of the shrunken cells [Figs. 5(a), 5(c), and 5(e)]. Fig. 5Iron deposition in the MPP+-induced PD model after 6 h exposure to FAC. The hyperspectral iron signals (a) were mapped onto the cell images (b) with red color. The representative images of points a, b, c, d, and e show the magnified images () from the yellow boxes in (a) and (b). Scale bars (a and b): 40 μm. Scale bars (a, b, c, d, and e): 10 μm. 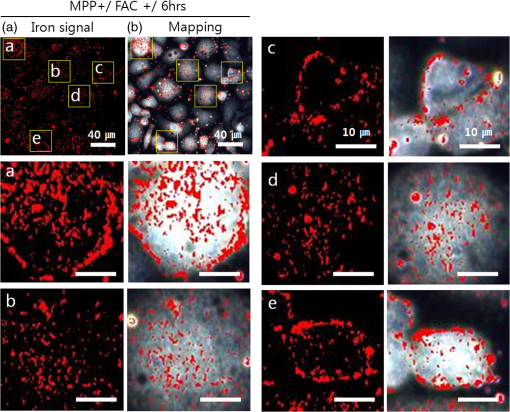 3.3.Quantification of Cellular Iron in the Cellular Model of PDThe hyperspectral signal intensity measurement of iron is easy for quantification method compare with routine iron measuring method of the colorimetric ferrozine-based assay.10,11 Also, this hyperspectral signal imaging provides the location with quantity of iron which was not offered from colorimetric ferrozine-based assay. Using this intensity measurement, we can relatively quantify the intensity differences between sample groups without cell lysis (Fig. 6). To quantify the iron signal in single cells, the hyperspectral absorption intensity was analyzed for ROIs in each cell [Fig. 6(b) and 6(c)]. The ROI was excluded outside the area of cells. In Fig. 6, the average intensity for a single cell (total intensity for 20 cells) after 1 or 6 h of FAC exposure was 198.6 a.u. (3973 a.u.) and 278.6 a.u. (5572 a.u.), respectively. The 6-h group showed statistically high cellular iron deposition compared with little accumulation in the 1-h group. Fig. 6Comparison of the total iron signal intensity (left) and mean iron signal intensity (right) between exposure time of 1 and 6 h (a). The regions of interest (ROIs) analyzed are shown in the hyperspectral iron signal image of (b) (1 h) and (c) (6 h). 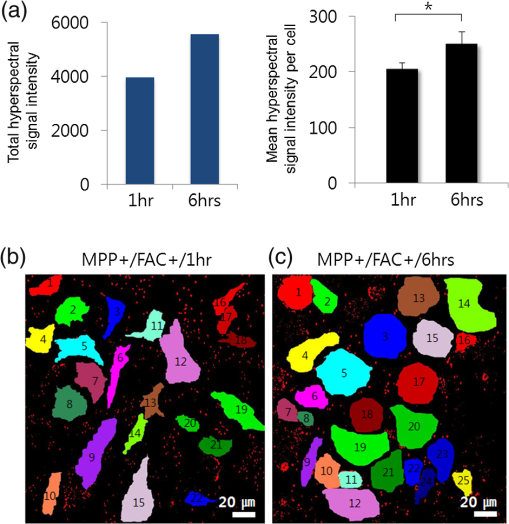 Cellular iron was dispersed in a small, particulate form, whereas the extracellular iron was detected in an aggregated form. Additionally, iron particles were found to be concentrated around the edge of the cell membranes of shrunken cells. Cellular iron accumulation was easily triggered in MPP+-induced cells, mirroring the previous studies and demonstrating the elevated iron levels in the SN of PD.2–7,9,19 In further studies, we will investigate which transporting pathway is mainly related to cellular uptake of iron in the cellular PD model. The extracellular iron can be transported into the cell via iron transporting proteins such as divalent metal transporter 1, ferroportin 1, transferrin receptor, and these transporters were upregulated in the PD models.9,20,21 Intracellular iron uptakes and overloads might be correlated with overexpression of these proteins. Therefore, the colocalization study of various iron transporters and cellular iron mapped using hyperspectral fluorescence signal imaging will give a better understanding of the pathophysiological processes in PD progression. 4.ConclusionThis study demonstrated that iron particles move into dopaminergic cells in an MPP+-induced cellular model of PD. Nanoscale dark-field optical microscopy clearly showed the cellular deposition of iron and its subcellular location. Iron particles were dispersed as small, particulate forms in the cytosol. In shrunken cells, the particles were found to be concentrated at the cell membrane/edge. Our iron imaging methods can be applied to analyze the pathophysiological role of iron in PD. The application of this method might further be expanded to various neurological disorders that involve other metals, such as copper, manganese, or zinc. AcknowledgmentsThis work was supported by Seoul National University Bundang Hospital (02-2005-027) and the Research Center Program of the IBS (Institute for Basic Science) in South Korea. Author contributions: E.S.O., C.H., and J.M.K. designed the experiment; E.S.O. and C.H. performed experiments and analyzed the data; E.S.O., C.H., M.S., Y.H.L., and J.M.K. wrote the paper. ReferencesP. T. Lieuet al.,
“The roles of iron in health and disease,”
Mol. Aspects Med., 22
(1), 1
–87
(2001). http://dx.doi.org/10.1016/S0098-2997(00)00006-6 MAMED5 0098-2997 Google Scholar
E. Soficet al.,
“Selective increase of iron in substantia nigra zona compacta of Parkinsonian brains,”
J. Neurochem., 56
(3), 978
–982
(1991). http://dx.doi.org/10.1111/jnc.1991.56.issue-3 JONRA9 0022-3042 Google Scholar
P. Damieret al.,
“The substantia nigra of the human brain. I. Nigrosomes and the nigral matrix: a compartmental organization based on calbindin D(28K) immunohistochemistry,”
Brain, 122
(8), 1421
–1436
(1999). http://dx.doi.org/10.1093/brain/122.8.1421 BRAIAK 0006-8950 Google Scholar
D. H. Kwonet al.,
“Seven-Tesla magnetic resonance images of the substantia nigra in Parkinson disease,”
Ann. Neurol., 71
(2), 267
–277
(2012). http://dx.doi.org/10.1002/ana.v71.2 ANNED3 0364-5134 Google Scholar
D. Berget al.,
“Echogenicity of the substantia nigra: association with increased iron content and marker for susceptibility to nigrostriatal injury,”
Arch. Neurol., 59
(6), 999
–1005
(2002). http://dx.doi.org/10.1001/archneur.59.6.999 ARNEAS 0003-9942 Google Scholar
A. H. Koeppen,
“The history of iron in the brain,”
J. Neurol. Sci., 134
(134 Suppl), 1
–9
(1995). http://dx.doi.org/10.1016/0022-510X(95)00202-D JNSCAG 0022-510X Google Scholar
R. R. CrichtonD. T. DexterR. J. Ward,
“Brain iron metabolism and its perturbation in neurological diseases,”
J. Neural. Transm., 118
(3), 301
–314
(2011). http://dx.doi.org/10.1007/s00702-010-0470-z JNTMAH 0300-9564 Google Scholar
L. Zeccaet al.,
“Iron, brain ageing and neurodegenerative disorders,”
Nat. Rev. Neurosci., 5
(11), 863
–873
(2004). http://dx.doi.org/10.1038/nrn1537 NRNAAN 1471-0048 Google Scholar
S. V. Kalivendiet al.,
“1-Methyl-4-phenylpyridinium (MPP+)-induced apoptosis and mitochondrial oxidant generation: role of transferrin-receptor-dependent iron and hydrogen peroxide,”
Biochem. J., 371
(1), 151
–164
(2003). http://dx.doi.org/10.1042/BJ20021525 BIJOAK 0264-6021 Google Scholar
J. Riemeret al.,
“Colorimetric ferrozine-based assay for the quantitation of iron in cultured cells,”
Anal. Biochem., 331
(2), 370
–375
(2004). http://dx.doi.org/10.1016/j.ab.2004.03.049 ANBCA2 0003-2697 Google Scholar
K. Tulpuleet al.,
“Uptake of ferrous iron by cultured rat astrocytes,”
J. Neurosci. Res., 88
(3), 563
–571
(2010). http://dx.doi.org/10.1002/jnr.22217 JNREDK 0360-4012 Google Scholar
Y. GariniB. J. VermolenI. T. Young,
“From micro to nano: recent advances in high-resolution microscopy,”
Curr. Opin. Biotechnol., 16
(1), 3
–12
(2005). http://dx.doi.org/10.1016/j.copbio.2005.01.003 CUOBE3 0958-1669 Google Scholar
A. VainrubO. PustovyyV. Vodyanoy,
“Resolution of 90 nm (lambda/5) in an optical transmission microscope with an annular condenser,”
Opt. Lett., 31
(19), 2855
–2857
(2006). http://dx.doi.org/10.1364/OL.31.002855 OPLEDP 0146-9592 Google Scholar
A. Nairet al.,
“Enhanced intratumoral uptake of quantum dots concealed within hydrogel nanoparticles,”
Nanotechnology, 19
(48), 485102
(2008). http://dx.doi.org/10.1088/0957-4484/19/48/485102 NNOTER 0957-4484 Google Scholar
K. Sarloet al.,
“Tissue distribution of 20 nm, 100 nm and 1000 nm fluorescent polystyrene latex nanospheres following acute systemic or acute and repeat airway exposure in the rat,”
Toxicology, 263
(2), 117
–126
(2009). http://dx.doi.org/10.1016/j.tox.2009.07.002 TXCYAC 0300-483X Google Scholar
J. N. Meyeret al.,
“Intracellular uptake and associated toxicity of silver nano particles in Caenorhabditis elegans,”
Aquat. Toxicol., 100
(2), 140
–50
(2010). http://dx.doi.org/10.1016/j.aquatox.2010.07.016 AQTODG 0166-445X Google Scholar
T. Dučićet al.,
“X-ray fluorescence analysis of iron and manganese distribution in primary dopaminergic neurons,”
J. Neurochem., 124
(2), 250
–261
(2013). http://dx.doi.org/10.1111/jnc.2012.124.issue-2 JONRA9 0022-3042 Google Scholar
R. Ortegaet al.,
“Iron storage within dopamine neurovesicles revealed by chemical nano-imaging,”
PLoS One, 2
(9), e925
(2007). http://dx.doi.org/10.1371/journal.pone.0000925 1932-6203 Google Scholar
D. BergH. Hochstrasser,
“Iron metabolism in Parkinsonian syndromes,”
Mov. Disord., 21
(9), 1299
–1310
(2006). http://dx.doi.org/10.1002/(ISSN)1531-8257 MOVDEA 0885-3185 Google Scholar
J. Salazaret al.,
“Divalent metal transporter 1 (DMT1) contributes to neurodegeneration in animal models of Parkinson’s disease,”
Proc. Natl. Acad. Sci. U. S. A., 105
(47), 18578
–18583
(2008). http://dx.doi.org/10.1073/pnas.0804373105 1091-6490 Google Scholar
N. Songet al.,
“Ferroportin1 and hephaestin overexpression attenuate iron-induced oxidative stress in MES23.5 dopaminergic cells,”
J. Cell. Biochem., 110
(5), 1063
–1072
(2010). http://dx.doi.org/10.1002/jcb.v110:5 JCEBD5 0730-2312 Google Scholar
|

