|
|
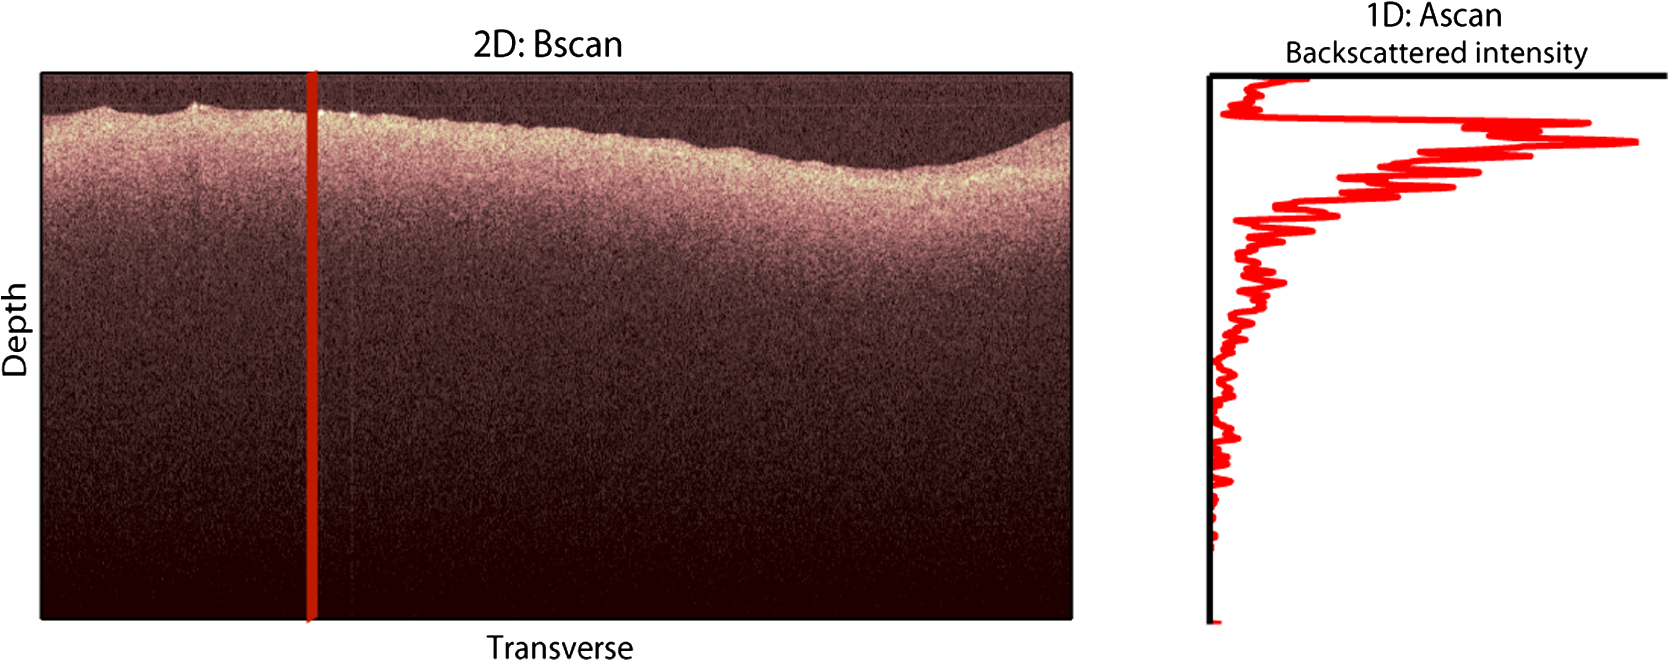
1.IntroductionAn aortic aneurysm is a cardiovascular disease that causes the dilation of the aorta diameter.1 This pathological growth generally induces an underlying weakness in the vessel wall, and the main concern is to minimize the risk of rupture of the vessel. Although difficult, some authors2 have evaluated the five-year risk of rupture of an ascending thoracic aneurysm as 16% for aneurysms with diameters between 4 and 5.9 cm and 31% for aneurysms . The rupture of an aneurysm carries a risk of death up to 90%.2 The diameter of the aorta is conventionally measured with noninvasive imaging modalities including ultrasound and computed tomography. When the rate of diameter growth exceeds a specific threshold, treatment based on open surgery or endovascular repair is performed. Open surgery is more common and it involves exposure of the dilated portion of the aorta, with no presence of blood, and insertion of a synthetic graft that helps to prevent an aneurysm from bursting.3 Accurate graft placement is required under intraoperative conditions. Cardiovascular surgeons face certain challenges in open surgery: to prevent postoperative pseudoaneurysm formation if the graft is sutured close to a degraded aortic wall and to be able to evaluate the quality of the aortic arch to extend the graft placement if necessary. Moreover, a trade off must be accomplished between the ratio of excised aorta and the safety of the graft placement. Degradation of the connective tissue of the aortic wall has been shown to be a hallmark of aneurysm formation.4 Collagen and elastin are the two major connective tissues found in the aorta wall. Histologically, elastin fragmentation and degeneration are observed in the aneurysm wall.5 Increased turnover and loss of types I and III fibrillar collagens, as well as excessive elastolysis caused by increased collagenase, elastase, and especially matrix metalloproteinase expression, probably underlie aortic dilation and rupture. The major forms of collagen found in the aorta are type I and III (Ref. 6) whose expression is found to be increased in aneurysmal tissue.7 The increased expression of collagen is localized to adventitial fibroblasts, medial smooth muscle cells (SMC), and transformed myofibroblasts found within areas of local inflammation and atherosclerosis.8 Elastin, the scaffold of the medial lamellae, is found in a reduced concentration as well as in a fragmented organization within tissues of diseased aorta.9 So, it appears to be a positive relationship between the severity of the aortic wall abnormalities and the risk of aneurysm rupture. On the other hand, there is a need of providing real-time assessment of the state of the aortic wall in the operating room where conventional histopathological techniques are not applicable. Optical coherence tomography (OCT) becomes a natural candidate for imaging structures just under the tissue surface. Interest moves here from the study of the narrowing of the arterial lumen, i.e., in case of atherosclerosis,10,11 toward the analysis of the tissue microstructure under the luminal surface. The actual axial resolution of OCT allows for the study of morphological details within the arterial wall not yet resolved by the conventional ultrasound techniques currently used for vascular monitoring. Disorders in the elastin and collagen of an aneurysmal wall lead to a directional anisotropy of the optical properties of the media layer of the aorta vessel, which is revealed in an uneven attenuation of the OCT signal. Few studies have been found dealing with the OCT characterization of the aortic wall,12–16 most of them related to animal samples and few to human aortas.14 This work proposes the OCT imaging, under in vitro conditions, of the wall of human aorta from aneurysms to find evidences of abnormalities in its structure. OCT measurements become contrasted with the histopathological gold standard provided by a pathologist. Healthy control and ascending thoracic aneurysmal aortas are surgically excised and measured at the laboratory. The goal is to find an automatic and real-time technique that is able to differentiate between healthy and aneurysmal aorta wall specimens, providing diagnosis on wall degradation. The study has been focused on the media layer of the aortic wall that should be properly delimited. Two techniques have been explored and compared: the numerical fitting of the decay of tissue backscattering along the vessel thickness and the textural analysis of the spatial distribution of tissue reflectivity. Both approaches are conventionally used in the analysis of OCT images. Backscattering fitting has been applied to characterize absorption and scattering properties in cardiovascular vessel tissues.17–19 It has been previously used for artery walls identification16 and to detect changes in tissue, such as hemoglobin oxygenation levels.20 Although it provides interesting physical magnitudes, some drawbacks are present: regions of interest must be defined on the intensity profile for accurate results; the fitting procedure is time consuming and it does not consider the information about the spatial distribution of the optical properties. On the other hand, textural analysis has been used for image classification21 and, specifically in OCT applications, it has been used to provide information on the spatial distribution of atherosclerosis plaques22 or for the detection of gastrointestinal tumor tissue.23 Once the textural analysis becomes designed, results can be quickly obtained because optimization procedures based on parallelization are feasible. In the present work, disorders on the aortic wall structure become highlighted when the textural approach is implemented. 2.Materials and Methods2.1.Fresh Aorta SpecimensIn this prospective study, approved by the Comité de Ética en Investigación Clínica de Cantabria, human aneurysmal specimens from ascending thoracic aorta were collected during cardiovascular surgery (Bentall, Wheat) of aorta replacement, isolated into a phosphate buffered saline (PBS) and refrigerated until the OCT measurement was performed. Each aorta sample was divided into different regions of interest (ROIs) of average size . Different orientations were considered for each ROI: along and across the direction of blood flow. Fiducial markers with India ink delimit the area of each ROI to facilitate coregistration with the histopathological examination. During the image acquisition procedure, tissue was continuously rehydrated with PBS. After the OCT measurement, the examined tissue was placed in 10% buffered formalin solution for the histopathological analysis. Four different histological stains were analyzed: hematoxylin and eosin (H&E), Verhoeff’s Van Gieson (EVG) to check the atrophy of elastic tissue and the thinning and loss of elastic fibers, Alcian Blue (AB) at pH 2.5 to determine acidic polysaccharides, and some types of mucopolysaccharides, and Alpha-smooth muscle actin () used as a marker of vascular SMC. Healthy ascending thoracic aortas, i.e., control specimens, come from donors for heart transplantations. Donors were selected following standard cardiac donation criteria. Patients with previous cardiac history or other heart diseases were excluded, gender was not an exclusion criterion and donors older than 55 years of age were excluded. In this study, 36 ROIs from 14 patients have been analyzed: 28 ROIs are extracted from ascending thoracic aorta with aneurysm (average diameter 55 mm; max. 70 mm; min. 46 mm) and 8 from controls with average diameters of 40 mm. As histopathological diagnosis becomes the gold standard for the OCT image interpretation, all samples were stained with H&E, EVG, AB, and stains. Two experienced pathologists, blinded to the clinical data, graded the aortic specimens. A semiquantitative grading scheme that accounts for fibrosis, medionecrosis, cystic medial change, SMC orientation, and elastic fiber fragmentation24 was applied. Each indicator was graded from 0 (no change) to 3 (most severe change). The aortic wall score for each individual patient (from 0 to 15) arises from the sum of the results of all variables. The global aortic wall score in control specimens varies from 0 to 1 [Figs. 1(a), 1(b), and 1(c)], whereas in aneurysmal samples, it reaches scores of 12. High scores are due to changes in the SMC orientation [Fig. 1(d)], focal fragmentation of elastic lamellae in the media [Fig. 1(e)], and mucoid material accumulation [Fig. 1(f)]. 2.2.Swept-Source Optical Coherence Tomography SystemAortic wall reflectivity measurements are obtained with the OCT system Thorlabs OCS1300SS, Newton, New Jersey. It is based on a swept source with a center wavelength of 1325 nm and a spectral bandwidth at half maximum of 100 nm. The system provides a resolution in air of 12 μm axial and 25 μm transverse, giving a maximum penetration in air conditions of 3 and 10 mm width. The sampling resolution is () and 8 bits for intensity levels digitalization, with a sensitivity of 100 dB. The point spread function (PSF) of the OCT system, , has been measured using a mirror as a reference. By changing the relative position of the focusing lens in relation with the mirror, differences in intensity level are obtained.25 These variations depend on the shift of the mirror surface from the lens focal point, as described by Eq. (1).25 where is the distance shift from the mirror surface to the lens focal point and represents the apparent Rayleigh length of the focusing lens. This parameter depends on the spot radius at the focal point, , as described in Eq. (2). where is the index of refraction of the tissue and the factor is introduced to distinguish specular reflection () in the case of the mirror from diffuse reflection () in the case of arterial tissue.26 By fitting the OCT signal levels, proportional to the electric field, to the model on Eq. (1), an apparent Rayleigh length of 505 μm and a spot radius of 29 μm were measured. As these values were obtained from the OCT signal, it also includes the system fall-off response within sample penetration.Aorta anatomy consists of three different layers: intima, media, and adventitia. B-scan images were acquired by focusing the probe on the surface of the intima layer and applying a temporal average of four acquisitions per B-scan. Figure 2 shows a comparison between OCT images and H&E histological stains of a control specimen (upper row) and an aneurysmal tissue (lower row). As hypothesized, OCT measurements show subsurface disorders appearing in the media layer of an aneurysmal vessel. The aortic wall score of the control specimen is 1 [Fig. 2(b)], where minute foci of mucoidal material (cyst) were present within a single lamellar unit. This minimum cystic change has no evidence on the OCT backscattered signal [Fig. 2(a)]. However, the aneurysmal specimen exhibits an aortic wall score of 9 [Fig. 2(d)] motivated by severe abnormalities due to alterations in the orientation of the SMC and the appearance of a large cyst in an area with fragmented elastin fibers. These media abnormalities also become displayed on the OCT image [Fig. 2(c)] with regions where the backscattered signal decreases significantly. 2.3.OCT Image PreprocessingOCT analysis is focused on the media layer of the aortic wall whose location needs to be tracked within the raw OCT images. To this end, the region of air above the aorta intima needs to be removed. In addition, images are also affected by noise, measurement artifacts, surface pools of saline buffer, and surface misalignments. OCT images are then conditioned for an automatic analysis on one dimension, along the tissue depth, or on two dimensions taking advance of the transverse and depth reflectivity information. Figure 3 represents the scheme of the preprocessing stage that provides, as outcome, the border that delimits the air–sample interface taking into account the mentioned effects. First of all, an area over the surface, known to be air, is selected. This preliminary region is used to establish the threshold for artifacts detection. The artifacts detection threshold is calculated as ·IQR,23,27 with being the upper quartile and IQR the interquartile range of this region of air, while is a constant value set to 1.5. Detected artifacts are then interpolated with neighboring pixels to provide more accurate air–sample interface detection. In the next stage, the standard deviation, , and the mean value, , of every A-scan of the image is computed. The threshold for air–sample interface is then established as . Once the air–sample interface becomes identified, a soft spatial smoothing filter is applied to the border to correct for the small imperfections due to intensity noise. This process is repeated independently for every image because it only depends on the statistical reflectivity distribution of the image and thus, it can be fully automatized. 2.4.A-Scan Analysis: Coefficient ExtractionImages from OCT are combinations of different backscattering lines (A-scans), one for each transverse scanning along a B-scan, as shown in Fig. 4. Each A-scan can be analyzed individually by performing a one-dimensional (1-D) characterization. To this end, the amplitude of the OCT signal reflectivity decay along the depth is fitted against an exponential law. As the wall structure of healthy and aneurysmal vessel differs, so does the reflectivity. Therefore, the changes in the decay law for both clinical cases could become diagnosis hallmarks for the risk of aneurysm. Under healthy conditions, the structure of each of the three different layers of the aortic vessel could be considered homogenous. The maximum imaging depth of the OCT system allows one to obtain information only about the first two layers (intima and media), but it is enough for characterization purposes. As stated, the media layer reflects the most interesting histological features for the evaluation of the risk of aneurysm. After the preliminary air–intima interface detection, the border between intima and media layers should be identified to filter the intima contribution to the A-scan and to avoid its interference in the fitting process. The intima layer of the aorta is mainly composed of endothelial cells and subendothelial connective tissue. Histological measurements reveal that the medium thickness of the intima of healthy specimens is , whereas the thickness of aneurysmal intima is . Taking an approximate refraction index for the aortic intima layer of 1.35,19 this implies a thickness between 12 and 15 pixels on each A-scan from the air–intima interface. A safety thickness of 20 pixels has been selected for the segmentation of the intima. Moreover, to account for the sensitivity loss due to the roll-off effect, the fitting range has been limited to 150 pixels beyond the intima–media interface. After isolating the media layer, the backscattering signal is fitted against an exponential model to extract synthetic coefficients of characterization. The exponential decay has been chosen to be consistent with the expected evolution of the optical backscattering signal along the penetration depth following the Beer-Lambert law.19 Here, is proportional to the electric field of backscattered light returning from the sample. The PSF effect on the curve decay has been included.25 This modeling is shown in Eq. (3), where is the optical depth measured from the surface of the intima layer, collects the deviation on attenuation (), and is proportional to backscattering amplitude. where to. An offset or independent term has been added to compensate for background differences among samples.28 Pixel values of the B-scan have been converted into metric values in μm considering a refractive index of the aorta media layer of 1.38.19 This way, results of the fitting parameters of control and aneurysm specimens can be compared, concluding if they are relevant for automatic characterizations and classification of the risk of aneurysm.2.5.Texture Analysis: Two-Dimensional Morphological StructureAlthough OCT images are generated on individual backscattering profiles, interesting features often occur between adjacent A-scans. The inherent structural and morphological information that appears along the traverse direction is not accounted in the 1-D analysis described earlier. In fact, after visual inspection of B-scans, differences of granularity, holes, or pixel distribution can be observed between control and aneurysm specimens. A two-dimensional (2-D) texture analysis is then proposed on a localized window where only the media layer is present. Image texture can be defined as the spatial variation in pixel intensities, in this case, the OCT signal amplitude, and it can identify a morphological tendency in the image. Co-occurrence analysis has been the strategy selected because it is a well-validated technique on image analysis.21 This strategy requires the preliminary computation of the so-called co-occurrence matrix, which represents a 2-D histogram to evaluate the image properties related to second-order statistics of gray values along the texture. Different orientations and distances of occurrence, as well as diverse sizes of the window of analysis, can be evaluated. Figure 5 represents a scheme to guide the computation of the co-occurrence matrix. The central pixel is separated from pixel with the parameters described in Eq. (4). The process consists of checking the repetition of this pattern along and across the whole image, and collecting the results in a 2-D matrix as a histogram. This matrix with checking results is known as the gray-level co-occurrence matrix (GLCM).21 Fig. 5Representation of co-occurrence matrix computing: , pixel elements for co-occurrence computing; , distance between pixel elements; and , angle between pixel elements.  Once the GLCM is computed and normalized by dividing all its elements by the total number of pairs considered, the joint probability density can be obtained. Several metrics can then be derived from it: energy, correlation, entropy, homogeneity, etc.21 2.6.Validation of the Diagnosis PerformanceIn order to validate the goodness of the detection of risk of aneurysm on OCT images of both 1-D fitting and 2-D textural analysis, different statistical representations have been used. The criterion on evaluation has always been whether the sample in analysis comes from a healthy control or from an aneurysm. First, box plot representations have been used to visually evaluate whether a feature has direct classification power. If one does, different levels of a classification threshold are evaluated and the receiver operating characteristic (ROC) is then computed.29 The area under the ROC curve (AUC) will be considered as a figure of merit to evaluate the accuracy of a feature for classification. If the area under the ROC is , it will be considered as appropriate to diagnose aneurysmal conditions. 3.Results and DiscussionThe risk of aneurysm is evaluated on aorta arteries based on OCT measurements. Two analyses have been proposed and compared: 1-D fitting of the reflectivity profile and 2-D texture evaluation. Results are divided following both approaches. 3.1.1-D Backscattering FittingThe model fitting of the backscattering is applied over each A-scan portion of the media layer to isolate its reflectance behavior. Figure 6 displays an A-scan of the media layer of a healthy aorta when compared with an A-scan from an aneurysm. As expected, the homogeneous structure of a healthy wall is represented by a smoother A-scan, whereas the disordered aneurysmal aorta displays an uneven decay. The fitting approach performs better, according to the Pearson’s correlation coefficient (), on the healthy aortic wall reaching a value of 0.98 of correlation. Figure 7 displays one of the fittings for a control sample where the range is limited to 150 pixels beyond the intima–media interface. The values obtained for the attenuation coefficient of healthy aorta vary from 17.6 to (25th to 75th percentile), as can be observed in Fig. 8. As measurements are done in reflection and since it is a tissue with a high scattering media, values will be near ; hence these values can be compared with the values obtained by other authors of 17.8 and .30 Fig. 6A-scan section corresponding to the media layer of the aorta wall: aorta from an aneurysmal aorta (a) and from a healthy aorta (b). 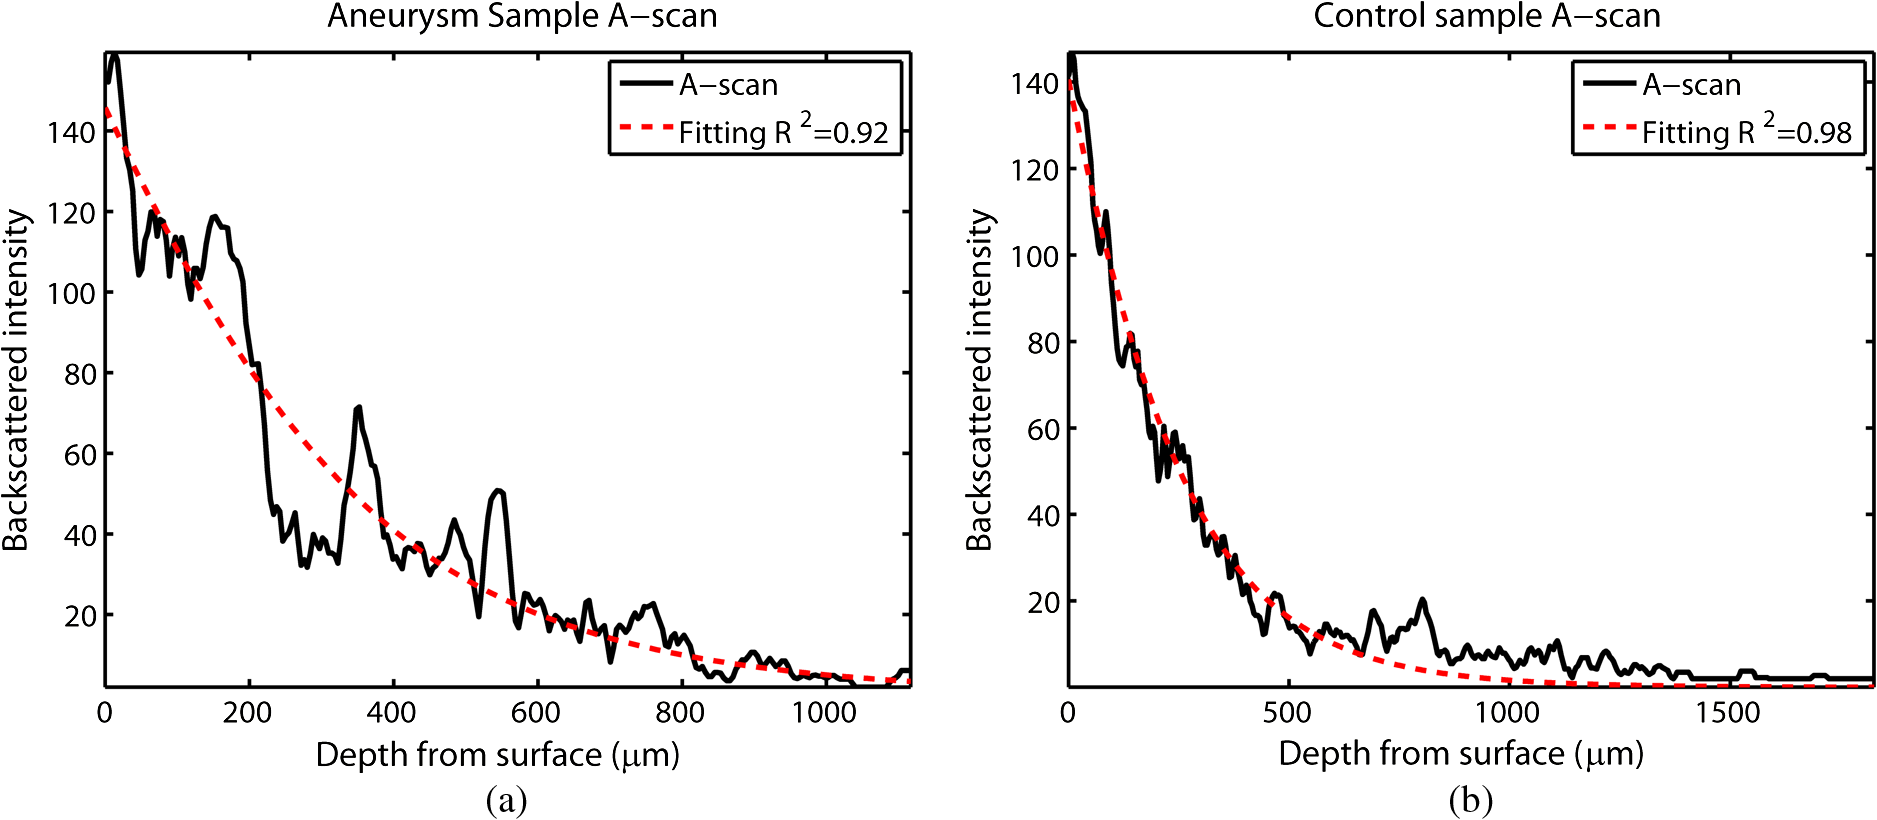 Fig. 7Fitting of a control sample decay according to the model applied [(Eq. (3)]. Attenuation coefficients measured () in the case of healthy samples vary from 17.6 to .  Fig. 8Box plots of the classification power of the exponential fitting coefficients: (a) amplitude , (b) attenuation coefficient (), (c) fitting error.  Box plots of the resulting parameters of the exponential fitting displayed on Fig. 8 show that the absorption-related parameter might suggest a higher classification ability when compared with the scattering-based one , although this is not very conclusive. As Fig. 6 may suggest, the Pearson’s correlation coefficient could appear as a good indicator to differentiate aneurysmal and control tissues. When an exhaustive analysis is performed along the whole tissue dataset, the fitting of aneurysmal samples seems to produce bigger errors due to the presence of more irregularities and anatomical changes on its media layer. To assess this point, Fig. 9 displays the ROC curves of each coefficient of the exponential fitting, showing that the exponential coefficient and the fitting error provide equivalent results in terms of tissue differentiationm but not good enough for automatic diagnosis. Fig. 9Detection performance of the fitting parameters of the exponential law. The classification capability is equivalent for the attenuation coefficient () and for the fitting error parameter .  Although some 1-D extracted features provide interesting information and reflect optical characteristics of the diagnosis of the sample, they are not powerful enough for automatic diagnosis. Most of the anatomical changes that define the risk of aneurysm have a spatial behavior along and across the artery axis. A spatial 2-D analysis, considering both directions of change in the reflectivity, is then considered to explore dependencies between adjacent A-scans. 3.2.2-D Textural AnalysisVisual inspection of the OCT-measured images already suggests that there exists a textural difference between healthy and aneurysm specimens in the media layer of the aortic wall. This texture difference also appears on the stained histopathology images, so it can be described as part of the anatomical pathology of the aorta. To be properly focused on the media layer of the vessel wall, an automatic safety margin of 20 pixels (87 μm) under the air–intima interface is defined to segment the intima layer according to the histopathological measurement of its thickness. GLCM characterizes this texture and it will determine new features from the OCT images that allow fast and automatic identification of the aneurysmal samples. GLCM computation requires defining a window size, an orientation , and a distance of occurrence . The first step is to obtain the optimum value of these three parameters. The histological study of the aneurysmal aortic wall has revealed that abnormalities in the media layer are not uniform. The size of the abnormality depends on the degradation of the wall, and its shape can become highly irregular. As observed in Fig. 1, the histological analysis shows that anomalies with dimensions to 350 microns can be found on aneurysmal specimens with an aortic wall score of 12. These dimensions are proportional to the aortic wall score. The uncertain shape, orientation, and size of the lesions make the square window appropriate for the textural analysis as rectangular windows miss the bidimensional information of the abnormality. Different window sizes, from 10 to 150 pixels (43 to 650 μm), have been probed. The orientation can also be important as the risk of aneurysm correlates with disorders on the SMC of the media layer and the layer-based aortic wall anatomy has a clear horizontal alignment. Both 0- and 90-deg orientations have been computed for different neighbor distances between 2 and 10 adjacent pixels (separations between 8 and 43 μm). Figure 10 shows the performance for each parameter combination (window size, orientation, and pixel distance) in terms of AUC. The window size is the parameter with the highest influence on the classification, while the distance and the angle of occurrence generate small variations in the AUC. The best AUC value, 0.9, was achieved for a square side of 110 pixels () and a co-occurrence distance of 2 pixels (). Figure 11 shows examples of the regions of OCT raw data selected for the textural analysis. As expected, the correlation is higher in control aortas (upper row), whereas aneurysmal specimens (lower row) behave more irregularly due to the morphological changes in the media layer. Fig. 10Co-occurrence homogeneity and correlation features computed for 0 and 90 deg orientations as a function of the window size and the distance between pixels .  Fig. 11Windows of backscattered signal, with dimension of () selected for the textural analysis. The signal is more uniform in control aortas (upper row), whereas aneurysmal specimens (lower row) behave more irregularly due to the morphological changes on the media layer.  Box plots for different GLCM properties (energy, homogeneity, etc.) have been obtained for the previous parameter combination. Results displayed in Fig. 12 show that correlation and homogeneity again become the best GLCM matrix indicators for diagnosis purposes. After this initial approach, the ROC curves of correlation and homogeneity are computed. Figure 13 displays the ROC curves for both metrics. Correlation becomes the best indicator for aneurysm diagnosis, reaching a sensitivity of 0.9065 and specificity of 0.8636 when a threshold of 0.6193 is selected for the evaluation of healthy and aneurysmal aortas. Finally, Fig. 14 shows the relationship between the texture of the OCT image and the histological aortic wall score. The texture of the OCT measurements of specimens with low grading scores exhibits a higher value of the correlation feature at 90 deg in the backscattered signal. On the other hand, the correlation is lower in aneurysmal samples as discussed. Good agreement between the optical and histological hallmarks can be observed. Texture correlation features agree with histological grading scores . The OCT technique then appears as a very promising alternative for intraoperative assessment of the degradation of aortic wall. 4.ConclusionsOCT technology is proposed as a high-resolution tomography strategy to study aortic layers looking for morphological changes related to aneurysms. OCT technology is a real-time alternative to traditional histopathology, where no stain or micro cuts are needed in addition. The use of OCT allows a significantly faster analysis with similar accuracy of wall degradation identification, allowing the intraoperative diagnostic to be less problematic. Aortic walls have been characterized with an OCT system at 1325 nm to provide aortic wall degradation assessment to the cardiovascular surgeon. As a first step, ex vivo specimens, harvested during aneurysm surgical interventions and from control donors, have been measured and compared. Two different approaches have been followed for the diagnosis of the sample. On one hand, a 1-D evaluation based on the exponential fitting of the decay of the backscattering signal along the penetration depth that has not contributed notoriously to the diagnosis performance is proposed. On the other hand, a 2-D textural analysis based on GLCM computation is proposed. As the aorta artery is a strongly layered vessel with a clear organized structure, differences on the spatial distribution of the backscattering intensity can be correlated with layers’ inhomogeneity. The correlation feature of the GLCM attains a pair sensitivity:specificity of 0.906:0.864 when the aortic wall is diagnosed as aneurysmal on an ROC curve. Textural results also agree with a semiquantitative histological criterion employed to grade the aortic wall alterations. AcknowledgmentsThis work has been supported by the Spanish Government through the CYCIT projects DA2TOI (FIS2010-19860), TFS (TEC2010-20224-C02-02), and the Alma’s Eguizabal PhD Grant (FPU12/04130). ReferencesK. W. Johnstonet al.,
“Suggested standards for reporting on arterial aneurysms. Subcommittee on Reporting Standards for Arterial Aneurysms, Ad Hoc Committee on Reporting Standards, Society for Vascular Surgery and North American Chapter, International Society for Cardiovascular Surgery,”
J. Vasc. Surg., 13
(3), 452
–458
(1991). http://dx.doi.org/10.1067/mva.1991.26737 0741-5214 Google Scholar
W. D. Clouseet al.,
“Improved prognosis of thoracic aortic aneurysms: a population-based study,”
JAMA, 280
(22), 1926
–1929
(1998). http://dx.doi.org/10.1001/jama.280.22.1926 JAMAAP 0098-7484 Google Scholar
L. F. Hiratzkaet al.,
“Guidelines for the diagnosis and management of patients with thoracic aortic disease: executive summary,”
J. Am. Coll. Cardiol., 55 1509
–1544
(2010). http://dx.doi.org/10.1016/j.jacc.2010.02.010 JACCDI 0735-1097 Google Scholar
Y. H. Shenet al.,
“Stem cells in thoracic aortic aneurysms and dissections: potential contributors to aortic repair,”
Ann. Thorac. Surg., 93
(5), 1524
–1533
(2012). http://dx.doi.org/10.1016/j.athoracsur.2012.01.063 ATHSAK 0003-4975 Google Scholar
R. J. Rizzoet al.,
“Collagen types and matrix protein content in human abdominal aortic aneurysms,”
J. Vasc. Surg., 10
(4), 365
–373
(1989). http://dx.doi.org/10.1016/0741-5214(89)90409-6 0741-5214 Google Scholar
M. J. Barnes,
“Collagens in atherosclerosis,”
Coll. Relat. Res., 5 65
–97
(1985). http://dx.doi.org/10.1016/S0174-173X(85)80048-0 CREXDV 0174-173X Google Scholar
C. L. Meshet al.,
“Collagen and elastin gene expression in aortic aneurysms,”
Surgery, 112
(2), 256
–261
(1992). SURGAZ 0039-6060 Google Scholar
G. C. Hunteret al.,
“Incidence and histologic characteristics of blebs in patients with abdominal aortic aneurysms,”
J. Vasc. Surg., 24
(1), 93
–101
(1996). http://dx.doi.org/10.1016/S0741-5214(96)70149-0 0741-5214 Google Scholar
R. P. Mechamet al.,
“Elastic fibre assembly: macromolecular interactions,”
Ciba Found. Symp., 192 172
–181
(1995). CIBSB4 0300-5208 Google Scholar
M. E. Brezinskiet al.,
“Optical coherence tomography for optical biopsy. Properties and demonstration of vascular pathology,”
Circulation, 93
(6), 1206
–1215
(1996). http://dx.doi.org/10.1161/01.CIR.93.6.1206 CIRCAZ 0009-7322 Google Scholar
S. Taharaet al.,
“Intravascular optical coherence tomography detection of atherosclerosis and inflammation in murine aorta,”
Arterioscler. Thromb. Vasc. Biol., 32
(5), 1150
–1157
(2012). http://dx.doi.org/10.1161/ATVBAHA.111.243626 ATVBFA 1079-5642 Google Scholar
J. M. Schmittet al.,
“Optical-coherence tomography of a dense tissue: statistics of attenuation and backscattering,”
Phys. Med. Biol., 39
(10), 1705
–1720
(1994). http://dx.doi.org/10.1088/0031-9155/39/10/013 PHMBA7 0031-9155 Google Scholar
J. G. Fujimotoet al.,
“High resolution in vivo intra-arterial imaging with optical coherence tomography,”
Heart, 82
(2), 128
–133
(1999). 1355-6037 Google Scholar
N. A. Patelet al.,
“Guidance of aortic ablation using optical coherence tomography,”
Int. J. Cardiovasc. Imaging, 19
(2), 171
–178
(2003). http://dx.doi.org/10.1023/A:1022877220226 1569-5794 Google Scholar
K. C. Hoanget al.,
“Use of an oxygen-carrying blood substitute to improve intravascular optical coherence tomography imaging,”
J. Biomed. Opt., 14
(3), 034028
(2009). http://dx.doi.org/10.1117/1.3153895 JBOPFO 1083-3668 Google Scholar
D. P. Popescuet al.,
“Signal attenuation and box-counting fractal analysis of optical coherence tomography images of arterial tissue,”
Biomed. Opt. Express, 1
(1), 268
–277
(2010). http://dx.doi.org/10.1364/BOE.1.000268 BOEICL 2156-7085 Google Scholar
W.-F. CheongS. A. PrahlA. J. Welch,
“A review of the optical properties of biological tissues,”
IEEE J. Quantum Electron., 26
(12), 2166
–2185
(1990). http://dx.doi.org/10.1109/3.64354 IEJQA7 0018-9197 Google Scholar
D. Levitzet al.,
“Determination of optical scattering properties of highly-scattering media in optical coherence tomography images,”
Opt. Express, 12
(2), 249
–259
(2004). http://dx.doi.org/10.1364/OPEX.12.000249 OPEXFF 1094-4087 Google Scholar
F. J. van der Meeret al.,
“Temperature-dependent optical properties of individual vascular wall components measured by optical coherence tomography,”
J. Biomed. Opt., 11
(4), 041120
(2006). http://dx.doi.org/10.1117/1.2333613 JBOPFO 1083-3668 Google Scholar
C. W. Luet al.,
“Measurement of the hemoglobin oxygen saturation level with spectroscopic spectral-domain optical coherence tomography,”
Opt. Lett., 33
(5), 416
–418
(2008). http://dx.doi.org/10.1364/OL.33.000416 OPLEDP 0146-9592 Google Scholar
R. M. HaralickK. ShanmugamI. Dinstein,
“Textural features for image classification,”
IEEE Trans. Syst. Man Cybern., SMC-3
(6), 610
–621
(1973). http://dx.doi.org/10.1109/TSMC.1973.4309314 ITSHFX 1083-4427 Google Scholar
A. ElbasionyH. Levkowitz,
“Characterization of atherosclerosis plaque in OCT images using texture analysis and parametric equations,”
in IEEE Int. Con. Inf. Vis.,
237
–240
(2011). Google Scholar
P. B. Garcia-Allendeet al.,
“Morphological analysis of optical coherence tomography images for automated classification of gastrointestinal tissues,”
Biomed. Opt. Express, 2
(10), 2821
–2836
(2011). http://dx.doi.org/10.1364/BOE.2.002821 BOEICL 2156-7085 Google Scholar
J. F. M. Bechtelet al.,
“Histopathological grading of ascending aortic aneurysm: comparison of patients with bicuspid versus tricuspid aortic valve,”
J. Heart Valve Dis., 12
(1), 54
–61
(2003). Google Scholar
T. G. van LeeuwenD. J. FaberM. C. Aalders,
“Measurement of the axial point spread function in scattering media using single-mode fiber-based optical coherence tomography,”
IEEE J. Sel. Topics Quantum Electron., 9
(2), 227
–233
(2003). http://dx.doi.org/10.1109/JSTQE.2003.813299 IJSQEN 1077-260X Google Scholar
D. J. Faberet al.,
“Quantitative measurement of attenuation coefficients of weakly scattering media using optical coherence tomography,”
Opt. Express, 12
(19), 4353
–4365
(2004). http://dx.doi.org/10.1364/OPEX.12.004353 OPEXFF 1094-4087 Google Scholar
F. Bazant-HegemarkN. Stone,
“Near real-time classification of optical coherence tomography data using principal components fed linear discriminant analysis,”
J. Biomed. Opt., 13
(3), 034002
(2008). http://dx.doi.org/10.1117/1.2931079 JBOPFO 1083-3668 Google Scholar
F. J. van der Meeret al.,
“Localized measurement of optical attenuation coefficients of atherosclerotic plaque constituents by quantitative optical coherence tomography,”
IEEE Trans. Med. Imaging, 24
(10), 1369
–1376
(2005). http://dx.doi.org/10.1109/TMI.2005.854297 ITMID4 0278-0062 Google Scholar
T. Fawcett,
“An introduction to ROC analysis,”
Pattern Recognit. Lett., 27 861
–874
(2006). http://dx.doi.org/10.1016/j.patrec.2005.10.010 PRLEDG 0167-8655 Google Scholar
E. Regaret al., Optical Coherence Tomography in Cardiovascular Research, Informa Healthcare, Abingdon
(2007). Google Scholar
|