
|
|
1.IntroductionChanges in the mechanical properties of skin, as well as in the time- and orientation-dependence of these properties occur gradually with age, but also for many other reasons including injury, scarring, dehydration, swelling, impaired heart function, rehydration therapy, sun exposure, skin cancer, psoriasis, oedema, and genetic conditions affecting connective tissue. Therefore, the mechanical properties of skin and underlying tissue have potential for assessing ageing, the effect of environmental factors, and also for clinical diagnosis and treatment of various diseases. One example of a commonly used technique is the pinch test, where skin’s recovery following stretching is assessed, and the time taken for skin to return to its original shape is an indicator of hydration and age. Techniques allowing visualization of tissue stiffness contrast have been recently developed by performing high-resolution imaging of tissue strain, from which tissue stiffness can be inferred. Recent advances have led to a multitude of image modalities being used for this purpose such as ultrasound1 and optical techniques. To date, the majority of optical elastography techniques have been developed using coherent optical imaging, for example, by tracking optical coherence tomography images2–4 or laser speckle.5,6 In contrast, the noncontact, incoherent, photography-based optical method proposed in this study would have the attractions of low cost and utility when skin contact is undesirable. The surface of diseased skin is often not intact, for example, in suspicious pigmented lesions. Therefore, a technique which avoids contact with the area of interest being imaged would have the benefit of reduced susceptibility to infection. Although for the proposed technique the loading requires contact, this is away from the area of interest, or nonintact region. As is also the case for ultrasound and coherent optical techniques, tracking surface topography has the potential to produce high-resolution images of tissue stiffness, which would have the potential to provide useful diagnostic information. Previously, other incoherent photography-based optical techniques have been suggested for producing strain images of the skin at high spatial resolution, for example, by applying paint or ink to the surface of the skin and acquiring photographs of the skin at different strains.7 Although it appears sometimes to be possible to create strain images without paint or ink to be applied to the skin,8 often the structure present in color photographs of tissue, with no paint or ink, was too low in contrast for successful tracking.7 In addition to direct contact with the region of interest being undesirable in the assessment and diagnosis of many skin diseases, such approaches may affect the mechanical properties of the region of interest, by altering its frictional properties. The current study proposes and evaluates a noncontact alternative to adding marks to the skin where the natural contrast is low, by making use of the natural features of the skin surface, or topography, for tracking. The topography of the skin is dominated by skin lines, which increase in separation and straighten as the skin is stretched and provide sufficient information for tracking such that any extra preparation such as paint is not required. Although these features are present to some extent in simple photographic imaging, images of the skin’s topography, acquired with techniques such as photometric stereo imaging or fringe projection, provide more clearly and consistently defined data. As this novel technique has not been previously investigated, this paper describes a study undertaken to investigate the potential of skin surface topography elastography, prior to clinical assessment. The study aimed to determine whether the change in skin line profile due to stretching can be used to measure strain. It also investigated the accuracy of tracking and methods of image optimization. The test objects chosen were silicone replicas (SILFLO from Flexico, England) of different skin surface topographies and the quality of the strain images was assessed by measuring the noise content. The optical elastography technique only measures strain, not stiffness, so there was no need to construct a test object that mimicked the stiffness properties of skin. For this study, a device that is frequently used in skin clinics called the Primos™ micro-profilometry system (GFMesstechnik GmbH, Germany) was used to image the skin topography, despite slow image acquisition and the author’s finding that accuracy suffers with sudden changes in surface height, for example, those typically encountered at the edge of pigmented skin lesions. This was justified as sudden changes would not be encountered for the current study, where normal skin was investigated, and the Primos device was deemed accurate for the assessment of skin line tracking in skin free from irregularities. Furthermore, the slow image acquisition was unimportant, as the use of replicas meant that there was no movement. A subsequent study is to be described in a forthcoming paper, where the optimized technique reported herein was used to track pigmented lesions in vivo, using a faster, lower cost, and more accurate surface topography measuring technique, called photometric stereo.9 The frequency of the major skin lines present within the skin’s topography varies with the body site (see Fig. 1) and the technique uses these major skin lines for tracking. Therefore, a second aim of this study was to develop a method which would allow optimization of strain images, independently of body site, by optimizing tracking parameters, such as the area of data (or window size) that is used for cross-correlation between images. Fig. 1regions within the surface height profile images of different skin types: (a) and (b) deep lines (approximate height variation 0.4 mm), (c) frequent lines (approximate height variation 0.2 mm), (d) shallow lines (approximate height variation 0.1 mm). Image brightness indicates height in a linear manner.  2.MethodsAn Extensometer™ (Cardiff-Biometrics Ltd, Cardiff, Wales, United Kingdom), designed for applying tensile loading to skin in vivo, was used to apply tensile strain to test specimens attached by two tabs, as shown in Fig. 2. At fixed levels of strain, surface height images were acquired with a Primos™ micro-profilometry system (GFMesstechnik GmbH, Germany), with the pixel dimensions , a height resolution of 3 μm, and an image area of . The system measures the deflections in stripes projected optically onto the skin surface caused by the variation in height. In addition to the spatial resolution of the micro-profilometry system, for displacement tracking, the spatial resolution of the technique will depend on the tracking parameters used. Optimization of the tracking parameters to optimize spatial resolution was therefore the main focus of the study. Fig. 2(a) Overview and (b) more detailed view of the Primos™ micro-profilometry system and the Extensometer™ setup.  When using the technique in vivo, during the two seconds taken to acquire a complete image of height data by the Primos system, subject movement may occur, adding noise to the height profiles acquired. In addition, the time-dependent mechanical behavior of skin leads to stress relaxation during the height profile acquisition, leading to blurring, reduced tracking performance, and variations in the strain distribution across the test area. To overcome this issue, silicone rubber skin replicas were used as phantoms in the present study to reduce these sources of noise, making trends in the dependence on tracking parameters easier to observe. A silicone resin called SILFLO from Flexico (England) has been previously used to produce accurate negative surface maps of the skin’s topography.10 Skin tends to behave in a viscoelastic manner,11,12 to a much greater extent than Silflo, as can be seen in examples of skin and Silflo stress relaxation curves (Fig. 3). As typical strains were small, differences between local strain patterns within the replicas and skin were considered as negligible. Fig. 3Stress relaxation of Silflo and forearm skin tested in vivo, under constant strain. The peak of each plot represents the end of the loading phase and the beginning of the hold phase.  To investigate the ability of the technique to be used for different skin types, 16 replica samples were analyzed from various skin sites and age groups. For each replica, the spacing of the skin lines was calculated by eye by finding the mean distance between skin lines measured along three horizontal lines and three vertical lines running through the 0% strain height profile image. Although the main aim of this study was to investigate normal skin, two additional samples from lesioned skin were included, to provide preliminary evidence as to whether this might have an effect on tracking performance. The local NHS Trust research ethics committee granted ethical approval. Silicone rubber replicas were made of skin samples by applying an approximately 3-mm thick layer of the silicone mixture to the skin surface and leaving the mixture to set for 5 min. After this time period, the silicone rubber replica easily peeled away from the skin surface, retaining a negative imprint. These replicas could then be attached to the Extensometer feet to be stretched, whilst height profile images were acquired with the Primos system. The length of the samples was sufficient to allow them to be glued to the two Extensometer feet, where the feet were spaced 40 mm apart, and the width of the sample was 10 mm, the same as that of the Extensometer feet (see Fig. 2). Samples were loaded in a tensile manner, to each of the desired strains (see subsequent paragraph). Once at the desired strain, the Extensometer held the sample at a constant strain whilst the height image was acquired, and then unloaded the sample to return to 0% strain before stretching to a different applied strain. Height profiles of each Silflo sample were acquired, using the setup shown in Fig. 2, at strains from 0% to a maximum applied strain of 11.8%, at intervals of 0.26%, which covered the typical range of strains encountered through normal physical movement. The initial 0% strain height image was then paired with the height images for each of the different applied strains. For each pair of height images, an image of local displacement was then formed using a two-dimensional (2-D) cross-correlation block-matching technique to find the corresponding individual regions of topography in the paired height image. Corresponding regions between height images were found using a cross-correlation calculation on small segments of the height image (“reference windows”) at a time, to find the most similar height image structure for the same-sized window in the second height image. High precision of the displacement estimates was achieved by finding the height pixel location that defined the center of the window whose data had the highest correlation with the data in the reference window. To achieve subpixel estimation, a localized 2-D cross-correlation function was calculated for the window with the highest cross-correlation value and its nearest window neighbors. A 2-D curve was then fitted to the cross-correlation function and the location of the peak of the function indicated a more precise estimate of the displacement of the center pixel of the window. The distribution of and displacements over the whole original image can be displayed as - and -displacement images, with the sampling interval equal to that of the original image and resolution proportional to the window size in both the - and -directions. Some locations may be skipped when choosing the centers of the reference windows to reduce the tracking processing time, i.e., by using nonoverlapping windows, but at the cost of degradation in resolution. The spatial resolution of the displacement images increases with a reduction in the window size. However, the smaller the window size, the lower the precision of each displacement estimate. Miller13 and Doyley14 give a more detailed description of this method of displacement estimation. As mentioned above, the larger the displacement estimation window size, the lower the noise, but the poorer the spatial resolution. The skin surface is made up of skin lines running in various directions, forming peaks and troughs, which form the structure of the signal being tracked, as indicated in Fig. 4. Therefore, unlike ultrasound elastography, where the optimum displacement estimation window size would be determined by the size of the speckle (which in turn is a property of the ultrasound beam width and pulse length as described by Ophir et al.15), in this application, the optimum window size is likely to be determined by the frequency of the skin line pattern. A range of displacement estimation window sizes was therefore used to produce displacement images. Tracking performance was assessed using two methods: (1) cross-correlation coefficient, a measure of how similar regions are and (2) displacement signal-to-noise ratio (SNR), a measure of the precision of displacement estimates. The cross-correlation coefficient was calculated as the spatially averaged cross-correlation coefficient over the entire displacement image and the displacement SNR was calculated as the mean displacement over the image divided by the standard deviation of the displacement. The effect of window size on displacement SNR and correlation coefficient was investigated over a number of different skin types and applied strains. For each sample, at each different strain, eight different window sizes were investigated. The size of the (square) windows was increased from to a maximum of , in increments of 0.29 mm, or 10 pixels, in both window dimensions. Fig. 4Surface height profiles of the replica of the skin of a 25-year-old female’s ankle: (a) before strain and (b) after a strain of 1.2%. The boxed region in (a) shows an example of a reference window and in (b) shows the corresponding matching region found.  To calculate strain, consider the situation of applying tensile strain with an Extensometer where, for example, the elastic medium is tethered to the stationary tab and the other tab moves away from the first, applying tensile load and strain. The displacement estimates associated with the adjacent reference windows covering the medium between the two tabs are cumulative, as the object elements within any window would have translated away from the static tab by a total displacement equal to the sum of the displacements created in the regions toward the static end of the sample plus the displacement caused by extension of the object in the window itself, as shown in Fig. 5. Figure 6 also illustrates this behavior, but as data points for displacements of the object in adjacent reference windows. Displacements are illustrated for a section of one row in the -displacement image. As strain is equal to the extension divided by the original length, the strain between the two adjacent displacement estimates will therefore be equal to the difference between the displacement estimates divided by the window spacing, i.e., the gradient of the displacement image. If the displacement measurements are noisy, which they usually are, calculating the strain in this way (i.e., from just two neighboring displacement estimates) will emphasize the noise. One type of noise-smoothing gradient estimator used in elastography, and that employed for the present work, is known as the least squares strain estimator.16 This estimates the strain by fitting a straight line to a series of displacement estimates and computing a local average of the gradient across the distance of a number of reference window positions, as shown in Fig. 6. Fig. 5Schematic diagram of two adjacent windows and their displacement following an applied strain. It is assumed that the elastic medium is tethered to a rigid support on the left and to a support on the right that moves to the right so as to apply the tensile strain. The displacement of window 2 includes the extension for the region in the image in window 2 plus a translation to the right, caused by the extension in the region of the image in window 1.  When strain is calculated in the same direction as the estimated displacement component (in this case calculated as , where is the component of displacement in the -direction), the result is known as the normal strain. Shear strain may also be estimated, by calculating the strain in the orthogonal direction to the estimated displacement component. It should be noted that inaccurate displacement estimates will lead to inaccurate strain estimates. Strain estimates can be displayed as a strain image, or “elastogram.” In a similar manner to the window size trade-off in displacement estimation, the number of displacement estimates used to measure the gradient will affect the precision and the spatial resolution of the elastogram. The larger the window (i.e., the greater the number of displacement values used), the higher the SNR but the poorer the spatial resolution of the strain values. Therefore, the spatial resolution of the final strain image will result from a combination of both the displacement estimation “reference window” size and the strain estimation window size chosen. The strain was calculated for each sample at strain estimation window sizes between 0.29 and 7.20 mm, in increments of 0.86 mm. Assuming that the mechanical properties of the silicone replica were homogeneous, the strain SNR was then calculated as the mean strain over the entire image divided by the standard deviation of the strain over the entire image. It is also possible to measure the gradient orthogonal to the direction of displacement (e.g., ), in which case the result is a component of shear strain. However, for this study, solely the normal strain in the direction of stretch was calculated and analyzed. 3.ResultsThere were two stages to the elastography processing, first the tracking stage to obtain displacement estimates and second the strain estimation stage. The next sections describe the results in the two different stages separately. 3.1.Displacement EstimationIn general, noise reduces, and displacement SNR increases, with increasing reference window size (as shown in Fig. 7). However, this is at the cost of reduced spatial resolution, where spatial resolution is the ability to image points a fixed distance apart, and, assuming sufficient density of information to track in the original images, is limited by the size of the tracking window, as found by Miller et al.17 Note that the reduction in spatial resolution with increasing window size is not to be confused with the reduction in number of displacement estimation pixels with increasing window size indicated in Fig. 7. This reduction in displacement image pixel number arises due to the use of a constant overlap (as a fixed proportion of the window size) between consecutive reference windows. A larger overlap may be used with increasing window size, to keep the number of displacement pixels the same as for small window sizes, but this will not increase the ability to image points a fixed distance apart (i.e., spatial resolution). Fig. 7Displacement images produced when tracking height profile images (shown in Fig. 3) of the Silflo replica from a 25-year-old’s ankle (sample 3, see Table 1), strain 1.2%, window sizes (a) 0.58 mm, (b) 0.86 mm, (c) 1.15 mm, and (d) 1.44 mm.  In order to establish the accuracy of the technique, measured strains can be compared with the known applied strain. For example, the displacement estimates shown in Fig. 7 are an average of 0.15 mm greater at the lowest region of the images compared to the upper region of the images. As the vertical size of the image is 14 mm, this would indicate an approximate average strain of 1.1%, comparable to the applied strain of 1.2%. Results for the effect of tracking window size on displacement SNR are shown for replicas from three skin samples in Fig. 8. It is clear that there is a plateau, i.e., increasing window size beyond a threshold value has no or little effect on SNR, at the cost of continuing to reduce spatial resolution. Therefore, setting a threshold at which this plateau occurred allowed optimization of the trade-off between SNR and resolution. The threshold was set such that increasing to the next larger window size (an increment of 0.29 mm) resulted in an increase in displacement SNR of , i.e., there was less than 50 units increase in displacement SNR per millimeter increase in window size. The optimum window size could therefore be selected for different skin types; these are shown alongside resulting displacement SNR and skin line spacing in Table 1. Fig. 8Displacement SNR as a function of window size, at an applied strain of 0.26%, for (a) 25-year-old female, different sites (samples 1, 2, and 4, see Table 1); (b) hand, different age groups (samples 1, 8, and 12, see Table 1).  Table 1Optimum window sizes for tracking different skin types, at an applied strain of 0.26%. Remarks: Sample #7: only horizontal skin lines apparent, no vertical lines visible, displacement estimation may benefit from a non-square window. Sample #15: large difference between the skin line pattern in the lesion and the surrounding skin, and the values shown in parentheses were calculated from only a small section of the image area, where skin was not pigmented. Sample #16: lesion too raised—imaging system unable to obtain height profile image.
In addition to using displacement SNR to determine optimum window size, the correlation coefficient is a measure of the degree of similarity between the cross-correlated data window and the matched data set in the second image and is another useful measure to analyze tracking performance. A high correlation coefficient indicates an increased probability that the correct part of the image has been identified, resulting in lower noise in displacement estimates. When performing elastography, it is generally accepted that the greater the window size, the higher the correlation coefficient. However for large windows, the correlation coefficient begins to decrease. The data shown in Fig. 9 (which is for height profile images from sample number 3, acquired at strains of 0% and 0.26% and then tracked using a wide range of different sized windows) is typical of all results and illustrates this behavior, where the spatial mean value of the correlation coefficient varies with the window size. The results so far have been shown for an applied strain of 0.26% only. The study included different levels of strain to also analyze the tracking performance with strain. As the signal is progressively stretched (when the replica is strained), the signal becomes progressively less similar to the original prestretched signal to which it is being compared. In general, the larger the applied strain, the poorer the correlation between the prestretched and poststretched signals. This effect is shown in Fig. 10, where the corresponding correlation coefficients are shown against applied strain for one of the Silflo samples. Fig. 10Mean correlation coefficient as a function of applied strain , for sample number 3 in Table 1, when tracked at a window size of 1.15 mm.  The data in Fig. 10 show the resulting mean correlation coefficients, which appear to sharply decrease as the applied strain increases. The data are typical of all tested replicas; however, despite the analysis being carried out using the optimum reference window size for each sample, the rate of reduction in mean correlation coefficient with strain occurred more severely for samples with low frequency skin lines. This may be due to the larger reference windows required for lower frequency skin line samples containing higher levels of strain decorrelation noise. 3.2.Strain EstimationFigure 11 shows an example of how the strain SNR typically increases with an increase in strain estimation window size. The larger the window size, the greater the smoothing of the data, therefore noise reduces accordingly. All samples tested in this study showed a similar trend in strain SNR with strain estimation window size. As SNR is the ratio of mean to standard deviation of the data, comparing SNR for different magnitudes of applied strain will inevitably lead to complication due to different mean strain values being used in the calculation. Therefore, although an increase in standard deviation was measured for increasing applied strain, the increase in mean measured strain more than compensated for this effect, such that, in general, larger applied strains resulted in higher strain SNR. Fig. 11Relationship between strain SNR and strain estimation window size at an applied strain of 0.26% (sample 3, see Table 1).  4.Discussion4.1.Displacement EstimationWhen choosing which tracking window size to use, the first consideration should be the choice of trade-off between spatial resolution and noise, as the higher the spatial resolution, the higher the noise. Once this trade-off has been considered, assuming that the plateau in displacement SNR with the window size occurs for all skin samples, there is no value in choosing a larger window size once this plateau has been reached. Therefore in order to achieve high spatial resolutions, the smallest window size should be chosen on the plateau. This is referred to herein as the optimum window size. Using the optimum window size, the samples described in this study showed mean correlation coefficients higher than 0.93. Using this method, a linear relationship between skin line spacing and optimum window size has been found across the samples tested, as shown in Fig. 12, where the following relationship between optimum window size, , and skin line spacing, , was found. Fig. 12Relationship between optimum tracking window size and skin line spacing. The linear best-fit line was obtained using samples 1 to 6 and 8 to 14 only (indicated by ♦). The referenced samples are described in Table 1. The details of the outliers (indicated by ▪) omitted from the fitting process are provided in the text.  This was calculated using 13 of the 16 sample replicas made (, ). For the remaining three samples, sample 16 was not able to be imaged and samples 7 and 15 were abnormal (described later). Sources of noise, such as random additive noise or strain decorrelation noise, can lead to errors in the measured displacement and strain. Random additive noise arises during the acquisition of each height image and will therefore be statistically the same, although different at the pixel level, from one height image to the next. Strain decorrelation noise arises when strain is applied to tissue between separate image frames. Walker and Trahey18 have shown that when tracking, the precision of the displacement estimate (i.e., the position of the peak in the cross-correlation function) due to random additive noise (at the point of data acquisition and in the absence of strain) is proportional to the width of the cross-correlation function peak, which is inversely proportional to the signal spatial frequency. Therefore for a given window size and fixed random noise standard deviation, the error on the displacement estimate will be larger for lower signal frequencies (i.e., larger skin line spacing). Closer skin lines would provide a narrower correlation peak, and so would provide more precise displacement estimation. As skin line frequency varies with the subject and body site, whereas the spatial frequency characteristics of ultrasound or optical coherence speckle are set for a given imaging system, tracking parameters have to be modified to allow for this change between samples. Keeping the width of this window proportional to skin line frequency therefore ensures a fairly constant displacement SNR irrespective of skin line spacing. A window size of half the skin line spacing appears the optimum choice. It may be noted that, although it is not stated in the literature as far as the authors are aware, the same could be said to be true in ultrasound and optical coherence elastography if one were tracking resolved backscattering structure rather than fully developed speckle. The spatial frequency of the image texture that represents the signal to be tracked would then vary with the tissue region and thus require a tissue-adapted window optimization similar to that described here. The converse of this is also true. That is, in skin surface laser speckle tracking3 there should be no need to use a tissue-adapted tracking window size, so long as the speckle is fully developed. Some of the samples had an atypical skin line pattern, as shown in Fig. 13. Whereas all points chosen for calculating the best-fit straight line between optimum window size and skin line spacing were within one standard deviation of the fitted straight line, these points were more than one standard deviation away from the line. They were therefore excluded from the least-squares calculation. These samples did, however, provide further insight into how window size and shape must be adapted for different skin line trends. Fig. 13Surface height images for (a) sample 7 and (b) sample 15 where the rectangle indicates the small section used for further analysis, as shown in (c) (referenced samples are described in Table 1). 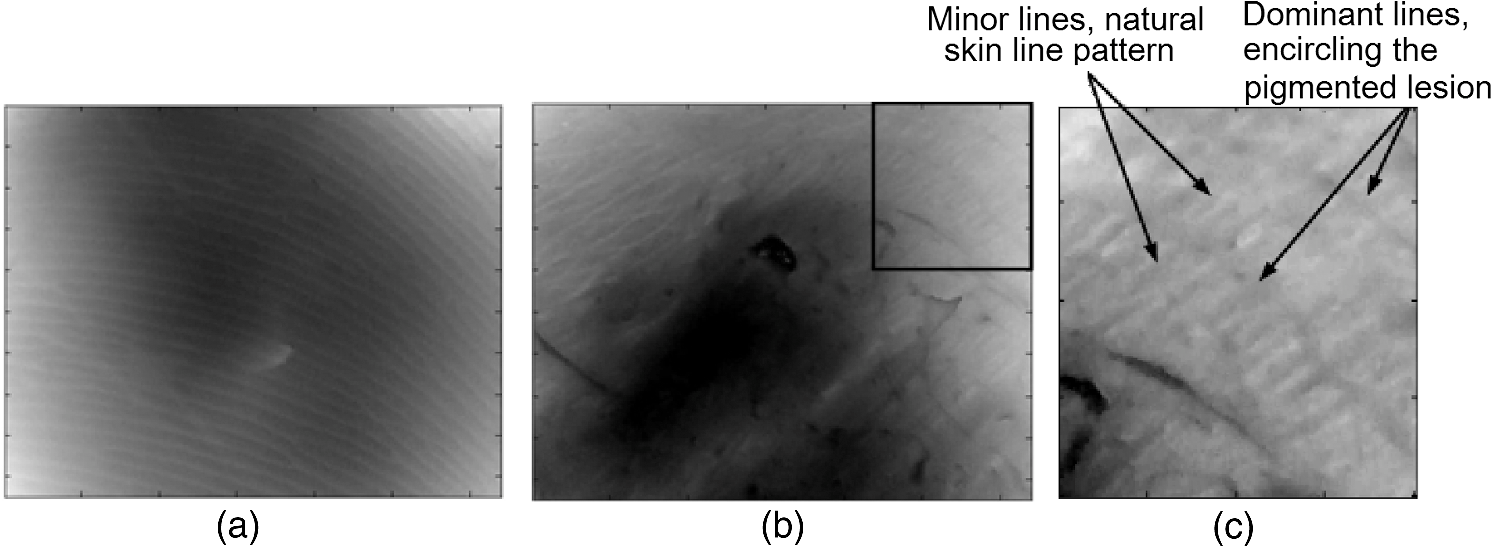 For sample number 7, skin lines mostly followed a predominant direction [as shown in Fig. 13(a)] with few lines in other directions. The optimum window size was much larger than the expected possibly due to the lack of detail to track in this predominant skin line direction. Because of the highly uni-directional skin line pattern, the use of a nonsquare window may improve the ability to track the signal at smaller window sizes. Alternatively, rotation of the direction in which strain was applied could have reduced the optimum window size and consequently improved the spatial resolution of the displacement measurement. This also means that relying on skin surface profile as a signal to track in elastography has the consequence that, in general, the performance is not isotropic. Sample 15 was a replica of a pigmented lesion with three regions of different skin line patterns. The skin line pattern within the pigmented lesion itself was different to the surrounding skin, and there was also a third region which encircled the pigmented lesion with a skin line pattern different to that of both the lesion and the surrounding skin. Figure 13(b) shows a small section of the height profile image from the nonpigmented skin immediately surrounding the pigmented lesion, where the lesion is situated to the bottom left of the section of image shown. The dominant lines are a feature of the pigmented lesion, even though they are outside of the pigmented area of the lesion, whilst the minor lines correspond to the natural skin line pattern. This is consistent with the fact that malignant pigmented lesions tend to have disrupted skin line pattern.19 Analysis of this small section of skin surrounding the pigmented lesion gave results shown in parentheses for sample 15 in Table 1, which more closely followed the trend between optimum window size and skin line pattern than the results within the lesion. It would appear beneficial, therefore, if height profile images could be analyzed in an automated manner prior to tracking, to observe spatial variations in skin line pattern across the image, to allow a locally adaptive optimum window size to be determined, which would then allow further optimization of displacement images. Prior to tracking, an analysis to establish whether samples follow the linear trend may even be a useful indicator of malignancy, although this would perhaps be a cumbersome form of texture analysis that is better accomplished by more efficient means.19 The dependency of optimum window size, displacement noise, and correlation coefficient on the skin line frequency leads to complex behavior, for example, where extremely large window sizes are used, tracking ability decreases and correlation coefficients begin to reduce (see Fig. 9), however just as optimum window size varies with skin line pattern, the window size at which correlation coefficients start to reduce also depends on the skin line pattern. This is because for the reference windows containing a high number of skin lines (either due to high skin line frequency or the reference window itself being large), see Fig. 14(a), there is more signal to correlate to, so when the signal is stretched, it will appear more different than a reference window containing less skin lines (either due to a lower skin line frequency or the reference window itself being smaller), see Fig. 14(b). Because an implicit assumption, that negligible strain exists within a reference window, no longer holds true above a certain reference window size, correlation coefficients start to reduce, and the point at which this occurs will be a result of the number of skin lines within the reference window and also the amount of strain applied. Fig. 14Effect of window size on the correlation between unstrained and strained signals: (a) more skin lines or (b) less skin lines within the reference window.  The applied strain was varied during the study to assess the relationship between strain decorrelation noise and strain, using the correlation coefficient as a measure. The greater the strain, the greater the degree of poststrained signal stretching and/or flattening compared to the prestrained signal, and hence the resulting correlation values would be expected to worsen. As predicted, Fig. 10 shows that the correlation coefficient decreases as applied strain increases. This behavior, observed for optical elastography, appears to be in agreement with the previous work for ultrasound elastography20 where the correlation coefficient was found to decrease from 1 at a strain of approximately 1% to 0.5 at a strain of approximately 10%. Minimizing the applied strain will therefore reduce the likelihood of inaccurate displacement estimation and improve strain SNR. However if this is not possible, “companding” may be performed, whereby the strained signal is distorted (in the stretching case, compressed) using signal processing, to improve its correlation with the original signal.20 The total strain is then given by summing the strain value used to compress the stretched signal and any residual strain measured between the two signals. The advantage of this technique is that the compressed version of the stretched signal more closely resembles the unstretched signal, so there is less decorrelation when performing block matching. Companding to compensate for skin profile strain may, however, be more complex than that for ultrasound echo signal strain, since it may also have to correct for “thinning” of the skin height profile that occurs as tensile strain is applied. A second approach may be to track incrementally, where multiple image frames are collected throughout the straining process and tracking is performed between consecutive pairs of frames,21 each frame having been acquired at a slightly larger applied strain. The total strain at each point would then be obtained by summing together the strain values measured at each increment. This technique is, however, limited by the maximum frame rate of the height profile imaging device. Alternatively, the strain rate may be reduced to match the acquisition rate of the imaging system, if visco-elastic effects are negligible. Even with these techniques, the height profile “thinning” mentioned above is likely to be a limiting factor on the total strain that can be applied when tracking skin surface topography, as eventually skin lines will completely disappear and there will no longer be enough structure to track. 4.2.Strain EstimationThe choice of strain estimation window size appears to be much more straightforward than the choice of displacement estimation reference window size and, as in previous strain imaging methods,18 must be a compromise between strain SNR, spatial resolution and contrast, and must be chosen depending on the individual requirements of the task. The larger the strain estimation window size, the more displacement estimates are used to calculate the strain, thereby smoothing strain estimates and increasing strain SNR as shown in Fig. 11. Therefore, this effect smooths out noise, but also smoothes out high-resolution detail and reduces the contrast. Novel techniques such as weighted least squares estimation, could also be employed to further improve the proposed technique, by weighting the influence of each of the displacement estimates used to calculate the strain estimate, by the displacement estimate’s correlation metrics.22 5.Strain Estimation in a Silicone Replica With Stiffness ContrastTo investigate the ability of the technique to distinguish between regions of different stiffness, a silicone replica with a step change in thickness was made, thereby creating regions which would exhibit different strain behavior. A mold was used to create the step thickness change on the back surface of the replica, with the skin surface replicated on the front surface as shown in Fig. 15. As the material properties varied on the back surface, this allowed undisrupted skin topography, for tracking strain, however, this meant that the transition in strain would be more gradual between the two regions. This sacrifice was deemed worthwhile in order to allow undisrupted skin topography on the imaging face, to rule out the possibility of surface topography influencing strain measurement. Fig. 15Replica with step change in thickness and corresponding elastogram showing lower strain above the dotted line and higher strain below the dotted line (strain in %).  The strain image in Fig. 15 was produced at an applied strain of 0.15%, with a displacement estimation window size of 1.15 mm and a strain estimation window size of 5 mm. The dashed line indicates the region where the change in thickness occurs. The two thicknesses of the replica were 2 and 6 mm, hence the thicker region would be approximately three times stiffer and consequently more resistant to strain. The image shows a corresponding region of lower strain in the top half of the image () and higher strain in the lower half of the image (). Differences between these regional average strain measurements would be larger if it were possible to create a replica with immediate transition in strain resistance, nevertheless strain contrast can still be observed. Strain variation is also apparent within each stiffness region, and corresponds to variation in thickness due to skin line pattern. 6.Tracking Skin Surface Topography In VivoA suspected malignant melanoma was tested at the Pigmented Lesion Clinic at Sutton Hospital, Epsom and St Helier Trust, Surrey, UK (trial reference number 05/Q0806/90). The feet of the Extensometer were attached to the skin using cyanoacrylate gel. Skin surface topography images were acquired at 0% and 1.25% strain using a photometric stereo technique.9 The lesion was then excised under local anesthetic and histologically evaluated as a junctional benign nevus. The photometric stereo device has the benefits of having a higher frame rate, larger skin height dynamic range and being based on less expensive video photography compared to the Primos system. The original pixel dimensions were . A displacement estimation tracking window size of was chosen based on the frequency of the skin lines. The mean correlation coefficient over the entire image was 0.9076, comparable with the values found in the silicone replicas. Strain was then calculated from the displacement images using the least squares strain estimator, as previously described. A strain estimation window size of 4.6 mm was used, resulting in a strain image size of approximately . Note that the current device had a relatively limited field of view but this can easily be upgraded in a more extensive in vivo study. A color photographic image and resulting strain image are shown in Fig. 16. The mean strain within the lesion boundary (as drawn by a dermatologist using the color photograph) was calculated as and the mean strain in the surrounding skin was , both similar in magnitude to the applied strain. As this lesion was a junctional nevus, minimal structural variation would be expected, but nevertheless are measurable with the technique. In malignant melanomas, large structural variations occur, particularly in the dermis, and they are also associated with disruption to skin line pattern,23 where the skin lines tend to be finer and more random in orientation, but are nevertheless still apparent at high enough frequency to allow texture analysis to be performed.24 7.ConclusionThis study has shown that elastography of skin surface height profile images is feasible. Using techniques such as photometric stereo9 to extract the height profile it may also be as inexpensive as simple video photography but with the potential advantage that the result is not dependent on natural skin pigment markings, or on adding paint or ink marks to the skin. Strain images of reasonable quality may be produced by tracking the height profile signal when silicone replicas are used to reproduce the skin surface topography. The next step toward developing the technique would be to assess the feasibility of skin surface elastography in vivo, using an improved surface topography system (i.e., lower cost, higher frame rate, and larger skin height dynamic range) and in direct comparison with the simple surface photography color or gray-scale tracking approach. A preliminary example of a skin surface elastogram of a pigmented lesion was produced in vivo using the photometric stereo system and illustrates that the technique shows promise. To ensure optimum image quality throughout the imaged field, optimum tracking window size must be selected for a given region of skin, using the frequency of the skin lines. Measuring across the entire image (to assess regional variation in frequency), may enable further reduction in the optimum reference window size compared to the average of 1.2 mm found for the samples described in this study. In this study, skin samples were deliberately chosen to cover a wide range of skin line frequencies. In practice, skin line frequency is generally toward the higher end of this range, such that the majority of skin samples would be expected to achieve spatial resolution in the order of 1 mm. Without compromising the measured displacement SNR, similar spatial resolutions should be possible to those reported with the previously published spray technique of ,7 where the spray technique had the disadvantage of requiring contact with the skin. Due to the ability to use smaller reference windows, improved spatial resolution is likely in samples with high skin line frequency, although this will also be dependent on the strain estimation window size chosen. A future publication will describe the optimized technique reported herein, when used to track pigmented lesions in vivo. ReferencesL. V. Couttset al.,
“Ultrasound elastography of the skin and subcutis under surface extensive loading,”
Ultrasound, 14
(3), 161
–166
(2006). http://dx.doi.org/10.1179/174313406X120558 56LBAT 1742-271X Google Scholar
A. Grimwoodet al.,
“Elastographic contrast generation in optical coherence tomography from a localized shear stress,”
Phys. Med. Biol., 55
(18), 5515
–5528
(2010). http://dx.doi.org/10.1088/0031-9155/55/18/016 PHMBA7 0031-9155 Google Scholar
X. LiangS. A. Boppart,
“Biomechanical properties of in vivo human skin from dynamic optical coherence elastography,”
IEEE Trans. Biomed. Eng., 57
(4), 953
–959
(2010). http://dx.doi.org/10.1109/TBME.2009.2033464 IEBEAX 0018-9294 Google Scholar
B. F. Kennedyet al.,
“In vivo three-dimensional optical coherence elastography,”
Opt. Express, 19
(7), 6623
–6634
(2011). http://dx.doi.org/10.1364/OE.19.006623 OPEXFF 1094-4087 Google Scholar
S. J. KirkpatrickD. D. Duncan,
“Acousto-optical assessment of skin viscoelasticity,”
Proc. SPIE, 4961 209
–220
(2003). http://dx.doi.org/10.1117/12.488373 PSISDG 0277-786X Google Scholar
S. J. Kirkpatricket al.,
“Imaging the mechanical stiffness of skin lesions by in vivo acousto-optical elastography,”
Opt. Express, 14
(21), 9770
–9779
(2006). http://dx.doi.org/10.1364/OE.14.009770 OPEXFF 1094-4087 Google Scholar
D. ZhangD. D. Arola,
“Applications of digital image correlation to biological tissues,”
J. Biomed. Opt., 9
(4), 691
–699
(2004). http://dx.doi.org/10.1117/1.1753270 JBOPFO 1083-3668 Google Scholar
Y. Zhanget al.,
“In vivo skin elastography with high-definition optical videos,”
Skin Res. Technol., 15
(3), 271
–282
(2009). http://dx.doi.org/10.1111/srt.2009.15.issue-3 0909-752X Google Scholar
J. Sunet al.,
“Reflectance of human skin using colour photometric stereo: with particular application to pigmented lesion analysis,”
Skin Res. Technol., 14
(2), 173
–179
(2008). http://dx.doi.org/10.1111/j.1600-0846.2007.00274.x 0909-752X Google Scholar
P. CorcuffJ.-L. Leveque,
“Skin surface replica image analysis of furrows and wrinkles,”
Handbook of Non-Invasive Methods and the Skin, 89
–96 CRC Press, London
(1995). Google Scholar
J. C. Barbenel,
“Identification of Langer’s lines,”
Handbook of Non-Invasive Methods and the Skin, 341
–344 CRC Press, London
(1995). Google Scholar
L. V. CouttsJ. C. BamberN. R. Miller,
“Multi-directional in vivo tensile skin stiffness measurement for the design of a reproducible tensile strain elastography protocol,”
Skin Res. Technol., 19
(1), e37
–e44
(2013). http://dx.doi.org/10.1111/j.1600-0846.2011.00604.x 0909-752X Google Scholar
N. R. Miller,
“Human and computer assisted perception of elastic lesions in ultrasound images,”
University of London,
(2000). Google Scholar
M. M. Doyley,
“An investigation into methods for improving the clinical usefulness of elasticity imaging,”
University of London,
(2000). Google Scholar
J. Ophiret al.,
“Elastography: a quantitative method for imaging the elasticity of biological tissues,”
Ultrason. Imaging, 13
(2), 111
–134
(1991). http://dx.doi.org/10.1177/016173469701900303 ULIMD4 0161-7346 Google Scholar
F. KallelJ. Ophir,
“A least-squares strain estimator for elastography,”
Ultrason. Imaging, 19
(3), 195
–208
(1997). http://dx.doi.org/10.1177/016173469701900303 ULIMD4 0161-7346 Google Scholar
N. R. MillerJ. C. BamberP. M. Meaney,
“Fundamental limitations of non-invasive temperature imaging by means of ultrasound echo strain estimation,”
Ultrasound Med. Biol., 28
(10), 1319
–1333
(2002). http://dx.doi.org/10.1016/S0301-5629(02)00608-7 USMBA3 0301-5629 Google Scholar
W. F. WalkerG. E. Trahey,
“A fundamental limit on delay estimation using partially correlated speckle signals,”
IEEE Trans. Ultrason. Ferroelectr. Freq. Control, 42
(2), 301
–308
(1995). http://dx.doi.org/10.1109/58.365243 ITUCER 0885-3010 Google Scholar
Z. SheY. LiuA. Damatoa,
“Combination of features from skin pattern and ABCD analysis for lesion classification,”
Skin Res. Technol., 13
(1), 25
–33
(2007). http://dx.doi.org/10.1111/srt.2007.13.issue-1 0909-752X Google Scholar
S. K. AlamJ. Ophir,
“Reduction of signal decorrelation from mechanical compression of tissue by temporal stretching; applications to elastography,”
Ultrasound Med. Biol., 23
(1), 95
–105
(1997). http://dx.doi.org/10.1016/S0301-5629(96)00164-0 USMBA3 0301-5629 Google Scholar
M. Doyleyet al.,
“A freehand elastographic imaging approach for clinical breast imaging: system development and performance evaluation,”
Ultrasound Med. Biol., 27
(10), 1347
–1357
(2001). http://dx.doi.org/10.1016/S0301-5629(01)00429-X USMBA3 0301-5629 Google Scholar
B. F. Kennedyet al.,
“Strain estimation in phase-sensitive optical coherence elastography,”
Biomed. Opt. Express, 3
(8), 1865
–1879
(2012). http://dx.doi.org/10.1364/BOE.3.001865 BOEICL 2156-7085 Google Scholar
Z. SheP. S. Excell,
“Skin pattern analysis for lesion classification using local isotropy,”
Skin Res. Technol., 17
(2), 206
–212
(2011). http://dx.doi.org/10.1111/srt.2011.17.issue-2 0909-752X Google Scholar
Z. SheA. W. G. DullerP. J. Fish,
“Enhancement of lesion classification using divergence, curl and curvature of skin pattern,”
Skin Res. Technol., 10
(4), 222
–230
(2004). http://dx.doi.org/10.1111/srt.2004.10.issue-4 0909-752X Google Scholar
BiographyLouise V. Coutts carried out her PhD by The Institute of Cancer Research, London in mechanical anisotropy of normal and diseased skin using high resolution ultrasound and optical elastography, with particular application to pigmented skin lesions and breast cancer related lymphedema. Her first postdoctoral research project involved using near infra-red spectroscopy to assess abnormal visual cortex response in migraineurs and response to migraine treatment. Her current research involves investigating mechanical properties of bone in health and disease. Naomi R. Miller carried out her PhD at The Institute of Cancer Research, London in the human perception of elasticity information in ultrasound images. Her postdoctoral research interests in medical physics included ultrasonic temperature imaging and ultrasound guided radiotherapy. She is currently conducting research in acoustic phonetics at City University London. Christopher C. Harland is a general dermatologist with an interest in cutaneous surgery and laser therapy. His research interests include the non-invasive screening of pigmented lesions, hence he has developed an expertise in non-invasive imaging of suspicious pigmented lesions. Jeffrey C. Bamber is head of Ultrasound and Optical Imaging Physics at the Institute of Cancer Research and Royal Marsden Hospital. His current research aims to increase the functional and molecular imaging capability of ultrasound, thus providing new tools to experimental cancer biology and helping to personalise cancer treatment by bringing the cost-effectiveness, safety, repeatability, speed and convenience of ultrasonic methods to clinical problems such as assessing tumour aggressiveness and response, and guiding treatment. |


