
|
|
1.IntroductionFluorescent protein imaging is useful for the in vitro and in vivo detection of biological events. Although transduction of fluorescent proteins into cultured cells can be easily visualized using fluorescent microscopy, it is not easy to detect these proteins in animals because the emitted fluorescence below 600 nm is usually absorbed by hemoglobin, skin melanin, body fluids, and lipids as well as being diminished by light-scattering.1–3 To enhance light penetration through deep tissues, it has been proposed that the optimal wavelength of emitted light involved should be between 650 and 900 nm.3 This wavelength range corresponds to the near-infrared (NIR) window, and it can be approached using various different types of biomaterials, including nanoparticles, quantum dots, organic dyes, and modified red-shifted fluorescent proteins.3–9 Among these approaches, fluorescent proteins are ideal for optical imaging of living cells because gene transcription and translation will not occur in dead cells.10 In vivo imaging of living cells is important for monitoring tumor growth kinetics as well as the effect of a therapy on tumors.11 Use of NIR emitted fluorescent proteins would help the analysis of cell viability or survival in deep tissues, including tumors or normal organs. Currently, infrared fluorescent protein (IFP) 1.4 and near-infrared fluorescent protein (iRFP) are the two fluorescent proteins with apparent NIR characteristics, because both of their emission wavelengths are longer than 700 nm.12,13 The excitation/emission peaks of IFP 1.4 and iRFP are and , respectively. Both IFP 1.4 (DrBphP) and iRFP (RpBphP2) belong to bacteriophytochromes. The IFP 1.4 was modified from the bacteriophytochrome of radioresistant bacterium Deinococcus radiodurans,13 and iRFP was modified from the bacteriophytochrome of the photosynthetic bacterium Rhodopseudomonas palustri.12 The optical characteristics of these bactriophytochromes, including excitation/emission wavelength, photostability, and brightness can be improved by site-directed mutagenesis and random mutagenesis.14–16 However, it has been challenged that the photostability and effective brightness of IFP 1.4 are suboptimal and exogenous addition of cofactor biliverdin (BV) IX is required for enhancing the fluorescent signal in vitro and in vivo.12 The BV is a metabolic product of heme by heme-oxygenase 1 (HO-1), and is known for the pigment of bruises under the skin, and it interacts with phytochromes covalently as a chromophore in eukaryotes.17,18 Compared to IFP 1.4, iRFP has been reported to exhibit higher brightness in mammalian cells and animal tissues, and exogenous supplement of the BV is not required.5,12,19 Nevertheless, whether IFP 1.4 itself can be modified to improve its brightness without the necessity of additional factor is of interest to further investigate. Förster resonance energy transfer (FRET) is a distance-dependent, nonradiative transfer of energy between a donor fluorophore and an acceptor one. The excitation of the donor fluorophore will form an oscillating dipole that transfers energy to the acceptor fluorophore, which then undergoes fluorescent emission.20 For instance, cyan fluorescent protein (CFP) and yellow fluorescent protein (YFP) are usually used for the detection of molecular interactions, such as protein-protein interaction, gene transcription regulation, and histone modification in cells by the FRET.21–24 However, the excitation and emission wavelengths of these two fluorescent proteins are relatively short (ex/em of the CFP: ; ex/em of the YFP: ), so that detection of molecular events using CFP/YFP-based FRET would not be applicable in deep animal tissues. In this context, whether fluorescent proteins with excitation and emission wavelengths at NIR range can exhibit FRET associated properties are of significant scientific interest because they may be useful for in vivo imaging. In this study, we fused a far red mPlum fluorescent protein to an IFP 1.4 protein with the expectation that this modification would change the optical property of the IFP 1.4 protein. The mPlum-IFP 1.4 fusion protein could emit IFP 1.4 fluorescent signals using excitation wavelength of mPlum in both cultured cells and xenograft tumors without the requirement of the exogenous supply of the BV, but native IFP 1.4 could only be detected in the presence of the BV. Because the emission spectrum of the mPlum fluorescent protein closely overlaps the excitation spectrum of the IFP 1.4 protein, excitation of mPlum protein may give rise to potent FRET properties to detect fluorescent emission of the IFP 1.4 in this fusion protein. Therefore, the current results suggest that this novel fusion protein is likely to be useful for the investigation of pathophysiological events in vivo by NIR-based fluorescent protein imaging. 2.Materials and Methods2.1.Plasmids and Construct the mPlum-IFP1.4 Fusion ProteinThe pcDNA3-IFP1.4-IRES-GFP construct was kindly provided by Dr. Roger Y. Tsien, University of California, San Diego. The pmPlum vector was purchased from Clontech Laboratories Inc. (Clontech Laboratories Inc., Mountain View, California) and the embedded mPlum gene was amplified from this vector using a polymerase chain reaction (PCR). The sequence of forward primer was 5′-GACCATGATTACGCCAAGCTTGCATGCCTGCAGGTCGACTC-3′. Three reversal primers containing different lengths of linkers were used, namely 5′-CCCAAGCTTGGCGCCGGTGGAGTG-3′ (linker #1), 5′-CCCAAGCTTCTCGAGCTGGCGGCGCCGGTGGAGTGG-3′ (linker #2), and 5′-CCCAAGCTTGCCTCCACACTCTCCGAGAGCGGTACAACACTCTCCGAGAGCGGTACAACACTCTCCGAGAGCGGTAAGCTTCTCGAGCCAGCGGCGCCGGTGGAGTGG-3′ (linker #3). The amplified mPlum fragments with different lengths of linkers were then digested with Hind III and separately ligated upstream of the IFP 1.4 DNA sequence in the pcDNA3-IFP1.4-IRES-GFP construct. The obtained construct was confirmed as containing the appropriate mPlum-IFP 1.4 fusion fragment with in-frame structure using DNA sequencing analysis. 2.2.Cell Culture and TransfectionSV40 large T-antigen transformed human embryonic kidney 293 cells (293T) were purchased from Bioresource Collection and Research Center in Taiwan (BCRC, Hsinchu, Taiwan). The cells were cultured in Dulbecco’s Modified Eagle Medium and supplemented with 10% fetal bovine serum, 200-mM glutamine, of penicillin, and of streptomycin (Invitrogen Inc. Carlsbad, California). The culture was maintained at 37°C in a humid incubator with 5% and passaged every two days. For DNA transfection, cells were seeded into a plate overnight. The established mPlum-IFP 1.4 fusion protein construct or other plasmids were then transfected into the cells according to the manufacturer’s instructions (JetPEI™ transfection agent, Polyplus-transfection SA., Illkirch, France). 2.3.Western Blot AnalysisAfter transfection, protein extraction and the Western blot analysis were performed as reported previously.25 The primary antibodies used in this study included anti-green fluorescent protein (GFP) antibody (GeneTex Inc., San Antonio, Texas), anti-DsRed antibody (Clontech, Takara Bio Inc., Shiga, Japan), and anti-glyceraldehyde 3-phosphate dehydrogenase (GAPDH) antibody (Sigma-Aldrich Co., St. Louis, Missouri). The secondary antibodies used in this study included anti-mouse and anti-rabbit antibodies (EMD Millipore Co., Billerica, Massachusetts). 2.4.Reverse Transcription-PCRTotal ribonucleic acid (RNA) was extracted using the TRIzol reagent (Life Technologies Inc., Carlsbad, California) according to manufacturer’s instruction. Two μg total RNA was reversely transcribed into cDNA by SuperScript III reverse transcriptase (Life Technologies Inc., Carlsbad, California) with random hexamer. The platinum taq DNA polymerase (Life Technologies Inc., Carlsbad, California) was used for amplifying 190 base pair and 96 base pair of IFP1.4 and -actin DNA fragments by MyCycler thermo-cycler (Bio-Rad Laboratories Inc., Hercules, California), respectively. The primer sets used for amplification of IFP1.4 was forward: 5′-GAATATGGGAGTGGGCTCCTCCCTG-3′, reversal: 5′-TCATTTATACAGCTCGTCCATTCCG-3′. The primer sets used for -actin was forward: 5′- GGAAATCGTG CGTGACATTAAG-3′, and reversal: 5′-GGCCATCTCTTGCTCGAAGT-3′. 2.5.Confocal Fluorescent Microscopy and FRET AnalysisFor cell imaging, 293T cells that have been transfected with fluorescent protein expressing plasmids were fixed with 4% paraformaldehyde for 10 min on coverslips, rinsed, and mounted using a mounting medium. The cell imaging was visualized and obtained using a laser confocal microscope containing a charge-coupled device camera (FV1000, Olympus Corporation, Tokyo, Japan). For the FRET analysis, images of single 293T cells were acquired at magnification by exciting at 488, 543, and 633 nm to confirm the original expression of GFP, mPlum, and IFP1.4, respectively, prior to acceptor photobleaching. Subsequently, the 488- and 543-nm channels were shut off and the intensity of the 633-nm channel was switched to 100% in order to photobleach the acceptor (IFP 1.4) in mPlum-IFP 1.4 fusion protein. Twenty-five times of pulsed light excitation was delivered to the slide to achieve the photobleaching. Cell images were then acquired using the 488-, 543-, and 633-nm channels after photobleaching. The FRET properties were then analyzed using the acceptor photobleaching method and a Förster critical distance for common resonance energy transfer donor-acceptor pairs in the analytical software that accompanied the Olympus FV1000 microscope was chosen. 2.6.Animalsmice ( total) were purchased from National Laboratory Animal Center and housed in the animal maintenance room of department of biomedical imaging and radiological sciences, National Yang-Ming University. The animal study was approved (No. 1000616) by Institutional Animal Care and Use Committee (IACUC) of National Yang-Ming University, Taipei, Taiwan. 2.7.In Vivo Fluorescent ImagingAn in vivo imaging system (IVIS) 50 optical imaging system (PerkinElmer Inc., Walthem, Massachusetts) was used for the macroscopic detection of the fluorescent intensity of mPlum-IFP 1.4 fusion protein in vivo. Transfected cells after trypsinization were either aliquot in 96-well plates, or subcutaneously implanted into nude mice. Plates were directly placed on the stage of IVIS 50 system, but those implanted animals were imaged 7 days after the inoculation. The BV was dissolved in dimethyl sulfoxide as a 25-mM stock solution. This solution was then added to cells or intravenously injected into animals after dilution.13 2.8.Statistical AnalysisData obtained from independent experiments were analyzed using the Student’s t-test in order to determine whether there were any significant differences between the control groups and the independent experimental groups. The statistical results were calculated using GraphPad Prism software version 3.0 (Graphpad software Inc., La Jolla, California). 3.Results3.1.Establishment of the NIR-based mPlum-IFP 1.4 Fusion ProteinAt first, we attempted to fuse a far red fluorescent mPlum protein to IFP 1.4 by ligating the gene fragments of these two proteins. Three DNA linkers (#1, #2, and #3) with different lengths were designed based on sequence information of the 3′ end of the mPlum gene. These linkers were separately used to amplify mPlum gene from the pmPlum vector by combining with another primer corresponding to 5′ end of mPlum gene (see Sec. 2). The PCR products were then separately ligated to IFP 1.4 gene in pcDNA3-IFP1.4-IRES-GFP plasmid. However, an mPlum-IFP 1.4 fusion construct was only successfully obtained using linker #2. The map of pcDNA3-mPlum-IFP1.4-IRES-GFP plasmid harboring mPlum-IFP1.4 fusion sequence was illustrated [Fig. 1(a)]. This plasmid was subjected to DNA sequencing analysis using a primer that was designed from the cytomegalovirus promoter to demonstrate the anticipated in-frame nucleotide linkage of these two proteins [Fig. 1(b)]. The encoded amino acid sequence corresponding to the DNA sequence encompassing the linker sequence was also presented [Fig. 1(b)]. This fusion construct also contained a GFP expressive cassette driven by an internal ribosomal entry site (IRES) to function as an internal control. 3.2.Comparison of Fluorescent Intensity between IFP 1.4 and the NIR-based mPlum-IFP 1.4 Fusion ProteinThe established mPlum-IFP 1.4 fusion protein construct was then transfected into 293T cells and visualized using a fluorescent microscope. The pcDNA3-IFP1.4-IRES-GFP plasmid that expressed native IFP 1.4 and pmPlum vector that expressed mPlum were used for comparison. Transfected cells were visualized using the IFP channel of confocal microscopy at an excitation wavelength of 543 or 633 nm. The results showed that the brightness of mPlum-IFP 1.4 fusion protein was stronger than that of IFP 1.4 at 543-nm excitation channel [Fig. 2(a), D and H], while the brightness of both proteins were comparable at 633-nm excitation channel [Fig. 2(a), B and F]. Individually expressed mPlum and IFP 1.4 were also examined using excitation wavelengths at 543 and 633 nm for comparison with the fusion protein, respectively [Fig. 2(a), B-D and I-K]. Minor IFP signals were captured in mPlum expressing cells by 543- and 633-nm laser excitation, suggesting that mPlum may have partially bleed through in the infrared emission channel [Fig. 2(a), I and K]. Additionally, co-expressed GFP was only detected in cells expressing native IFP 1.4 and mPlum-IFP 1.4 fusion protein, but not in cells expressing mPlum because the pmPlum vector did not contain the GFP expressive cassette [Fig. 2(a), A, E and H]. The Western blot analysis also demonstrated that the protein levels of co-expressed GFP in IFP 1.4 and mPlum-IFP 1.4 transfected cells were similar [Fig. 2(b)]. By normalization of co-expressed GFP, the fluorescent intensities of the mPlum-IFP 1.4 fusion protein was stronger than that of IFP 1.4 in transfected cells at their optimal excitation wavelength, namely 543 nm for fusion protein and 633 nm for IFP 1.4 protein [Fig. 2(c)]. To examine whether the different brightness is possibly due to different gene expressive level, we used the reverse transcription (RT)-PCR to determine the mRNA expression of IFP 1.4 gene and mPlum-IFP 1.4 in transfected cells. The primer set was designed to amplify a 190-bp DNA fragment from IFP 1.4 cDNA after cells were separately transfected with native IFP 1.4 plasmid or mPlum-IFP 1.4 plasmid (see Sec. 2). The result showed that no significant gene expressive difference was detected between IFP 1.4 and mPlum-IFP 1.4 [Fig. 2(d)]. Whether the stronger brightness of mPlum-IFP 1.4 fusion protein than that of IFP 1.4 is related to higher protein level would be of interest to further investigate. Fig. 2Visualization of IFP 1.4 signals from the mPlum-IFP 1.4 fusion protein exposed to the mPlum excitation channel. (a) 293T cells expressing mPlum-IFP 1.4 (middle panel) fusion protein exhibited stronger signals than similar cells expressing IFP 1.4 (upper panel) after they were exposed to the 543-nm laser and detected using the IFP emission channel (680 to 740 nm). Co-expressed GFP was detected by 488-nm excitation. Panel A–D: IFP 1.4 transfected cells; panel E–H: mPlum-IFP 1,4 fusion construct transfected cells; panel I–L: mPlum transfected cells; ch: channel. (b) The Western blot analysis for co-expressed GFP in IFP1.4 and mPlum-IFP1.4 fusion protein. Glyceraldehyde 3-phosphate dehydrogenase was used as an internal control. (c) Semi-quantification of the brightness in IFP 1.4 or the mPlum-IFP 1.4 fusion protein normalized against GFP. ***: . (d) The reverse transcription-polymerase chain reaction (RT-PCR) for comparing the mRNA level of IFP 1.4 and mPlum-IFP 1.4 genes that were transfected to cells. The target of the RT-PCR was an IFP 1.4 DNA fragment with a 190 bp length. -actin (96 bp) was used as an internal control.  3.3.Exhibition of FRET Related Properties in the mPlum-IFP 1.4 Fusion ProteinThe excitation and emission spectra of mPlum and IFP 1.4 fluorescent proteins reveal that the emission peak (648 nm) of the mPlum donor closely overlaps the excitation peak (684 nm) of the IFP 1.4 acceptor [Fig. 3(a)]. This optical property obeys one of the FRET principles between donor and acceptor fluorophores.20,26 Based on this fact, we investigated whether the increased fluorescent intensity of the mPlum-IFP 1.4 fusion protein shown above was associated with a FRET phenomenon. First, photobleaching of the IFP 1.4 acceptor showed that the fluorescent intensity of mPlum donor in the fusion protein was increased, and this is an important optical characteristic of the FRET [Fig. 3(b)]. Increase of mPlum donor fluorescent intensity of the fusion protein after photobleaching was also quantified, and the results were compared to cells co-transfected with separate mPlum plasmid and IFP 1.4 plasmid [Fig. 3(c)]. According to the mathematic relationship between the FRET efficiency () and distance () ( is inversely proportional to the sixth power of ), we also estimated the FRET efficiency and distance in a series of single cells [Fig. 3(d)]. The FRET efficiency of the mPlum-IFP1.4 fusion protein was calculated by the correspondance to the B-Phycoerythrin-Cy5 pair, in which the Förster distance () was designated by 7.2 nm. The FRET efficiency and donor/acceptor distance of mPlum-IFP 1.4 fusion protein were quantified and compared to individually expressed mPlum and IFP 1.4 in cells [Fig. 3(e). Therefore, the current findings suggest that excitation of mPlum using 543 nm caused emission of IFP fluorescence in mPlum-IFP 1.4 fusion protein [Fig. 2(a)] and is likely to be associated with potent FRET mechanism. Fig. 3The Förster resonance energy transfer (FRET)-like properties of the mPlum-IFP 1.4 fusion protein. (a) The excitation and emission spectra of mPlum and IFP 1.4. (b) Detection of the brightness of mPlum donor after photobleaching of IFP 1.4 acceptor in the mPlum-IFP 1.4 fusion protein using confocal microscopy. (c) Quantification of fluorescent intensity of the mPlum donor before and after photobleaching of the acceptor in the mPlum-IFP 1.4 fusion protein and separately expressed mPlum and IFP 1.4 plasmids (mPlum + IFP). (d) Analysis of the distance between the donor and acceptor in relation to FRET efficiency in single cells. A higher FRET efficiency corresponds to a shorter distance between donor and acceptor. The color bars were shown on the upper-left of each picture. (e) Quantification of FRET efficiency and donor/acceptor distance in cells expressing mPlum-IFP 1.4 fusion protein or co-transfected mPlum and IFP 1.4 constructs (mPlum+IFP). *: .  3.4.Effects of BV on Fluorescent Intensity of the mPlum-IFP 1.4 Fusion ProteinThe BV is known to increase the fluorescent intensity of IFP 1.4 in vitro and in vivo. Using the IVIS 50 system, we showed that exogenous addition of the BV to IFP 1.4 transfected 293T cells exhibited a dose-dependent increase in photon flux via the Cy5.5 channel (ex/em: 615 to to 770 nm) [Fig. 4(a)]. To investigate whether the fluorescent intensity of the mPlum-IFP 1.4 fusion protein was also enhanced by the BV, the IVIS 50 system was again used to detect the photon flux in fusion protein expressing 293T cells in the presence of the BV or solvent only. Interestingly, the results showed that at 580- to 610-nm excitation wavelengths, the mPlum-IFP 1.4 transfected cells exhibited significant fluorescent signals without BV, although the signals were slightly enhanced by adding the BV [Fig. 4(b)]. On the contrary, the fluorescent signals of native IFP 1.4 could not be detected using the same excitation wavelength range with or without BV. However, the BV did significantly enhance the fluorescent signals of native IFP 1.4 at a 615- to 665-nm excitation range, but, by way of contrast, this did not occur with mPlum-IFP 1.4 fusion protein [Fig. 4(b)]. Quantification of the optical signals further showed that mPlum-IFP 1.4 fusion protein could provide an apparent fluorescent signal by 580- to 10-nm excitation, but that was not significantly improved by adding the BV [Fig. 4(c)]. Therefore, exogenous addition of the BV would not be required to visualize or enhance fluorescent emission of mPlum-IFP 1.4 fusion protein in cultured cells. Fig. 4Effects of biliverdin (BV) on mPlum-IFP 1.4 fusion protein. (a) A dose dependent experiment demonstrated that BV increased the brightness of IFP 1.4 expressed in 293T cells detected using the in vivo imaging system (IVIS) 50 system (ex: 580 to 610 nm; em: 695 to 770 nm). Photon flux was quantified and compared across different concentrations of BV. **: and ***: . (b) Comparison of the brightness of cells transfected with IFP 1.4, mPlum, and mPlum-IFP 1.4 fusion construct and exposed to the excitation wavelength at DsRed channel (ex: 580 to 610 nm) or Cy5.5 channel (615 to 665 nm) with and without BV (25 μM). (c) Quantification of photon flux in (b). *: .  3.5.Noninvasive Imaging of mPlum-IFP 1.4 Fusion Protein Expression in Xenograft Tumors Using Small AnimalsNext, the fluorescent imaging was used to investigate whether the expression of mPlum-IFP 1.4 fusion protein is detectable in vivo. The nude mice were subcutaneously implanted with tumorigenic 293T cells transfected with the mPlum-IFP 1.4 fusion construct, or co-transfected with the IFP 1.4 and the mPlum constructs. These mice were then subjected to the IVIS system. The results showed that cells expressing the mPlum-IFP 1.4 fusion protein construct could be detected in implanted small animals when excited using the DsRed (ex: 580 to 610 nm) channel but not using the Cy5.5 (ex 615 to 665 nm) channel [Fig. 5(a)]. Additionally, intravenous injection of the BV did not enhance the fluorescent signals of the mPlum-IFP 1.4 fusion protein. On the contrary, the fluorescent signals emitted from native IFP 1.4 was only detected using the Cy5.5 channel in the presence of the BV [Fig. 5(a)]. The fluorescent intensity was also semi-quantified by selected regions of interests, and no significant difference was detected in fusion proteins with or without BV injection, compared to IFP 1.4 alone [Fig. 5(b)]. Therefore, the mPlum-IFP 1.4 fusion protein would be useful for the in vivo fluorescent imaging without the need for an extra injection of the BV to enhance the signals. Fig. 5Imaging of mPlum-IFP 1.4 fusion protein expression in a xenograft tumor model. (a) Imaging of the tumor-bearing nude mice with and without BV individual excitation at DsRed channel or Cy5.5 channel (ex: 580 to 610 nm and 615 to 665 nm), and collected using the same Cy5.5 channel (em: 695 to 770 nm) via the IVIS 50 system. For each nude mouse, IFP 1.4 transfected 293T cells were subcutaneously implanted in the left thigh, and mPlum-IFP 1.4 fusion protein construct transfected cells were implanted in the right thigh. Control is the nude mouse without injection of cells. The regions of interests (ROIs) were indicated by circles. (b) Semi-quantification of the fluorescent signals by selecting ROIs in different conditions with duplicated experiments. *: . FP: mPlum-IFP 1.4 fusion protein. 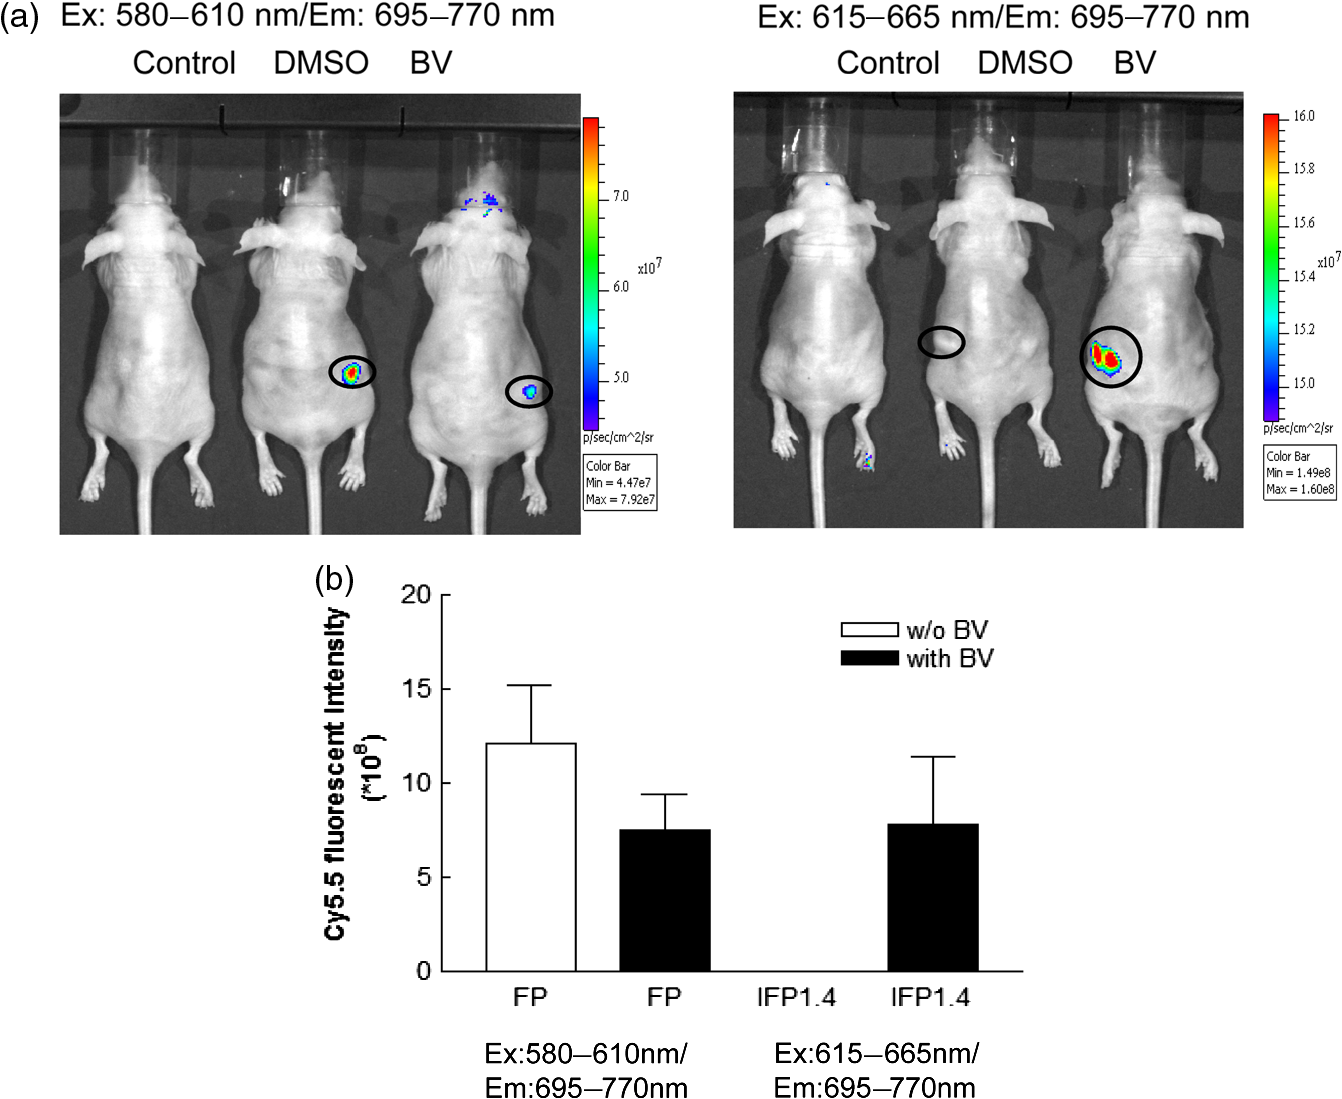 4.DiscussionGeneration of the NIR materials for noninvasive in vivo imaging is an active research area at the moment because it is important for detection of molecular and pathophysiological events that occur in deep tissues of animals. Development of fluorescent reporter genes would be important for detecting cell viability and survival because gene expression is only found in living cells.10 Fusion of the NIR-based fluorescent protein genes to tissue specific gene promoters also allows the investigation of a variety of biological responses stimulated by environmental changes. It is believed that in vivo optical imaging of deep tissue is best performed between 650 and 900 nm, and it has been suggested the tissue absorption coefficient is similar across all of this range.3 However, the lowest absorption coefficient in vivo falls between 700 and 750 nm.3 Therefore, it seems unnecessary that the emission wavelength should be longer than 750 nm to enhance the light penetration efficiency of a fluorescent protein. The longest emission wavelengths of known fluorescent proteins expressed in mammalian cells are mainly around 710 nm. Therefore, they should be ideal for the imaging of deep tissues.12,13 However, the brightness and photostability of NIR fluorescent proteins remains to be improved in order to provide better optical imaging in vivo. Site-directed mutagenesis and random mutagenesis can be used to improve the optical properties of original bacteriophytochromes, namely their brightness and photostability. However, the experimental procedures are complex and time consuming, and it is difficult to predict which mutation(s) will provide the greatest improvements in NIR properties.12–14,16 Here, we constructed an in-frame fusion protein between mPlum fluorescent protein and IFP 1.4, and showed that significant fluorescence of IFP 1.4 was detectable via mPlum excitation channel but not via Cy5.5 channel compared to IFP 1.4 expression alone. Moreover, the BV was found to be dispensable under these conditions, and this is similar to previously reported iRFP.12 This approach avoids complex procedures to obtain a genetically modified fluorescent protein for NIR-based imaging in vitro and in vivo. However, the excitation wavelength of the fusion protein was reduced to to 610 nm, which results in a weaker penetration ability of the excitation spectrum. Nevertheless, this novel fusion protein should be useful for in vivo fluorescent imaging using small animals because their body thickness is also relatively small. Whether it can be usefully applied to large animals or human beings remain to be investigated. One of the primary conditions for the FRET is that the emission spectrum of the donor must overlap the excitation spectrum of the acceptor.26 Among NIR-related fluorescent proteins, the mPlum fluorescent protein (ex/em: ) and IFP 1.4 (ex/em: ) pair appropriately matches this requirement. Indeed, we were able to show that the fusion protein exhibited a FRET phenotype in transfected cells after photobleaching of IFP 1.4 acceptor, which led to increase of fluorescent intensity of mPlum donor [Fig. 3(b)]. However, after acceptor photobleaching using 25 times of pulsed light excitation (633 nm), weak fluorescent signals of IFP 1.4 remained detectable, suggesting that the acceptor photobleaching was incomplete. Actually, the optimal wavelength for completely photobleaching the acceptor of fusion protein should be , but this laser device for confocal microscopy was not available in our area. Moreover, because cells were apparently shrinking and dead when they were exposed to over 25 times of pulsed light excitation (data not shown), we could only collect the data of 25 times of excitation, and that might cause a substantial error in estimating the FRET efficiency.27 Because of these limitations, whether the FRET is the primary mechanism to render the mPlum-IFP 1.4 fusion protein displaying stronger fluorescence than native IFP 1.4 using mPlum excitation wavelength remains to be investigated. However, the occurrence of the FRET may be still theoretically possible because the excitation wavelength of mPlum donor is closely overlapped with the emission wavelength of IFP 1.4 acceptor.26 Our current data showed that the fluorescent signals of mPlum-IFP 1.4 fusion protein are brighter than that of native IFP 1.4 after excitation via the mPlum excitation channel (580 to 610 nm) in vitro and in vivo. Interestingly, no fluorescent signal can be detected with the fusion protein with or without BV after excitation via the Cy5.5 channel (615 to 665 nm) using the IVIS system. On the contrary, expression of IFP 1.4 alone could be detected by adding BV [Fig. 4(b)]. It is completely unknown why the BV was unable to enhance the fluorescence of IFP 1.4 portion of mPlum-IFP 1.4 fusion protein. Because the three-dimensional structure of mPlum-IFP 1.4 fusion protein has not been analyzed, it is anticipated that the changes of optical characteristics of mPlum and IFP 1.4 in this fusion protein can be better understood when the structure is resolved. We also did not exclude that fluorescent signals collected at Cy5.5 channel were partially from thebmPlum portion of the fusion protein because part of the mPlum emission spectrum overlaps with the major IFP 1.4 emission spectrum over 700 nm [Fig. 3(a)]. Additionally, the excitation energy is used for detection of IFP 1.4 signal of mPlum-IFP 1.4 fusion protein may be higher than that used for detection of native IFP 1.4 because of the shorter wavelength. We have not demonstrated that the protein levels are the same in cells expressing either IFP 1.4 or mPlum-IFP 1.4 because no anti-IFP 1.4 antibody is available currently. This concern is important to confirm that increased brightness of mPlum-IFP 1.4 fusion protein detected in confocal microscopy is not simply caused by higher protein level compared to IFP 1.4 alone. A flag or histidine tag can be attached to the fluorescent proteins and detected by anti-flag or anti- histidine antibody for comparison in the future. At present, the known FRET donor/acceptor pair with the longest wavelengths is Cy3 (em: 566 nm) and Cy5 (ex: 649 nm).28 Therefore, the fluorescent interaction between mPlum and IFP 1.4 at NIR range is very interesting as it will allow an exploration of whether the FRET would authentically occur at long wavelengths. Further investigations are required to confirm that the FRET would occur at extremely long wavelength. 5.ConclusionThe current data demonstrated that the fluorescent intensity of mPlum-fused IFP 1.4 is comparable to native IFP 1.4 under their own optimal excitation conditions. The fluorescent signals from theb mPlum-IFP 1.4 fusion protein could be detected between 580- and 610-nm excitation using the IVIS system without the exogenous supply of BV, but the BV is required for detection of native IFP 1.4 in vitro and in vivo. Although the excitation wavelength of mPlum-IFP 1.4 fusion protein is slightly shorter than that of native IFP 1.4, it seems that the brightness of both proteins is comparable. Use of mPlum-IFP 1.4 for in vivo imaging may be more convenient and less complex than IFP 1.4 because the step of BV injection can be omitted. Additionally, although FRET may be potentially involved in visualization of IFP 1.4 fluorescence via excitation of mPlum in this fusion protein, the underlying mechanisms remain to be addressed. To the best of our knowledge, this is the first report showing that mPlum-IFP 1.4 fusion protein could be detected in vitro and in vivo for NIR-based optical imaging. This novel construct would be ideal for imaging the pathophysiology in deeper tissues of small animals and preclinical studies. AcknowledgmentsWe thank Dr. Roger Y Tsien who provided us the pcDNA3-IFP1.4-IRES-GFP construct. This study was supported by National Science Council of Taiwan (NSC 100-2627-E-010-001) and a grant from the Ministry of Education, Aim for the Top University Plan, National Yang-Ming University. We thank the Molecular and Genetic Imaging Core/National Research Program for Genomic Medicine at National Yang-Ming University for their instrument support. We also thank the Taiwan Mouse Clinic (NSC 102-2325-B-001-042) which is funded by the National Research Program for Biopharmaceuticals (NRPB) at the National Science Council (NSC) of Taiwan for technical support in the IVIS service and animal care. ReferencesF. F. Jobsis,
“Noninvasive, infrared monitoring of cerebral and myocardial oxygen sufficiency and circulatory parameters,”
Science, 198
(4323), 1264
–1267
(1977). http://dx.doi.org/10.1126/science.929199 SCIEAS 0036-8075 Google Scholar
V. Ntziachristos,
“Going deeper than microscopy: the optical imaging frontier in biology,”
Nat. Methods, 7
(8), 603
–614
(2010). http://dx.doi.org/10.1038/nmeth.1483 1548-7091 Google Scholar
R. WeisslederV. Ntziachristos,
“Shedding light onto live molecular targets,”
Nat. Med., 9
(1), 123
–128
(2003). http://dx.doi.org/10.1038/nm0103-123 1078-8956 Google Scholar
K. D. PiatkevichF. V. SubachV. V. Verkhusha,
“Far-red light photoactivatable near-infrared fluorescent proteins engineered from a bacterial phytochrome,”
Nat. Commun., 4 2153
(2013). http://dx.doi.org/10.1038/ncomms3153 NCAOBW 2041-1723 Google Scholar
D. M. ShcherbakovaV. V. Verkhusha,
“Near-infrared fluorescent proteins for multicolor in vivo imaging,”
Nat. Methods, 10
(8), 751
–754
(2013). http://dx.doi.org/10.1038/nmeth.2521 1548-7091 Google Scholar
L. ChengC. WangZ. Liu,
“Upconversion nanoparticles and their composite nanostructures for biomedical imaging and cancer therapy,”
Nanoscale, 5
(1), 23
–37
(2013). http://dx.doi.org/10.1039/c2nr32311g 1556-276X Google Scholar
K. ChengZ. Cheng,
“Near infrared receptor-targeted nanoprobes for early diagnosis of cancers,”
Curr. Med. Chem., 19
(28), 4767
–4785
(2012). http://dx.doi.org/10.2174/092986712803341458 CMCHE7 0929-8673 Google Scholar
L. Yuanet al.,
“Far-red to near infrared analyte-responsive fluorescent probes based on organic fluorophore platforms for fluorescence imaging,”
Chem. Soc. Rev., 42
(2), 622
–661
(2013). http://dx.doi.org/10.1039/c2cs35313j CSRVBR 0306-0012 Google Scholar
Y. Yanget al.,
“An individually coated near-infrared fluorescent protein as a safe and robust nanoprobe for in vivo imaging,”
Nanoscale, 5
(2), 10345
–10352
(2013). 1556-276X Google Scholar
M. F. KircherS. S. GambhirJ. Grimm,
“Noninvasive cell-tracking methods,”
Nat. Rev. Clin. Oncol., 8
(11), 677
–688
(2011). http://dx.doi.org/10.1038/nrclinonc.2011.141 NRCOAA 1759-4774 Google Scholar
Y. L. Chenet al.,
“Remnant living cells that escape cell loss in late-stage tumors exhibit cancer stem cell-like characteristics,”
Cell Death Dis., 3
(e399),
(2012). http://dx.doi.org/10.1038/cddis.2012.136 CDDEA4 2041-4889 Google Scholar
G. S. Filonovet al.,
“Bright and stable near-infrared fluorescent protein for in vivo imaging,”
Nat. Biotechnol., 29
(8), 757
–761
(2011). http://dx.doi.org/10.1038/nbt.1918 NABIF9 1087-0156 Google Scholar
X. Shuet al.,
“Mammalian expression of infrared fluorescent proteins engineered from a bacterial phytochrome,”
Science, 324
(5928), 804
–807
(2009). http://dx.doi.org/10.1126/science.1168683 SCIEAS 0036-8075 Google Scholar
J. R. Wagneret al.,
“Mutational analysis of Deinococcus radiodurans bacteriophytochrome reveals key amino acids necessary for the photochromicity and proton exchange cycle of phytochromes,”
J. Biol. Chem., 283
(18), 12212
–12226
(2008). http://dx.doi.org/10.1074/jbc.M709355200 JBCHA3 0021-9258 Google Scholar
E. Giraudet al.,
“A new type of bacteriophytochrome acts in tandem with a classical bacteriophytochrome to control the antennae synthesis in Rhodopseudomonas palustris,”
J. Biol. Chem., 280
(37), 32389
–32397
(2005). http://dx.doi.org/10.1074/jbc.M506890200 JBCHA3 0021-9258 Google Scholar
A. T. Ulijaszet al.,
“Characterization of two thermostable cyanobacterial phytochromes reveals global movements in the chromophore-binding domain during photoconversion,”
J. Biol. Chem., 283
(30), 21251
–21266
(2008). http://dx.doi.org/10.1074/jbc.M801592200 JBCHA3 0021-9258 Google Scholar
T. Lamparteret al.,
“Biliverdin binds covalently to agrobacterium phytochrome Agp1 via its ring A vinyl side chain,”
J. Biol. Chem., 278
(36), 33786
–33792
(2003). http://dx.doi.org/10.1074/jbc.M305563200 JBCHA3 0021-9258 Google Scholar
S. J. DavisA. V. VenerR. D. Vierstra,
“Bacteriophytochromes: phytochrome-like photoreceptors from nonphotosynthetic eubacteria,”
Science, 286
(5449), 2517
–2520
(1999). http://dx.doi.org/10.1126/science.286.5449.2517 SCIEAS 0036-8075 Google Scholar
J. LecoqM. J. Schnitzer,
“An infrared fluorescent protein for deeper imaging,”
Nat. Biotechnol., 29
(8), 715
–716
(2011). http://dx.doi.org/10.1038/nbt.1941 NABIF9 1087-0156 Google Scholar
R. B. SekarA. Periasamy,
“Fluorescence resonance energy transfer (FRET) microscopy imaging of live cell protein localizations,”
J. Cell Biol., 160
(5), 629
–633
(2003). http://dx.doi.org/10.1083/jcb.200210140 JCLBA3 0021-9525 Google Scholar
C. W. LinC. Y. JaoA. Y. Ting,
“Genetically encoded fluorescent reporters of histone methylation in living cells,”
J. Am. Chem. Soc., 126
(19), 5982
–5983
(2004). http://dx.doi.org/10.1021/ja038854h JACSAT 0002-7863 Google Scholar
J. L. Vinkenborget al.,
“Enhanced sensitivity of FRET-based protease sensors by redesign of the GFP dimerization interface,”
Chembiochem: a Eur. J. Chem. Biol., 8
(10), 1119
–1121
(2007). http://dx.doi.org/10.1002/(ISSN)1439-7633 14394227 Google Scholar
R. N. DayA. PeriasamyF. Schaufele,
“Fluorescence resonance energy transfer microscopy of localized protein interactions in the living cell nucleus,”
Methods, 25
(1), 4
–18
(2001). http://dx.doi.org/10.1006/meth.2001.1211 MTHDE9 1046-2023 Google Scholar
E. Kiyokawaet al.,
“Fluorescence (Forster) resonance energy transfer imaging of oncogene activity in living cells,”
Cancer Sci., 97
(1), 8
–15
(2006). http://dx.doi.org/10.1111/cas.2006.97.issue-1 1347-9032 Google Scholar
T. H. Huanget al.,
“Antiproliferative effects of N-heterocyclic indolyl glyoxylamide derivatives on human lung cancer cells,”
Anticancer Res., 31
(10), 3407
–3415
(2011). ANTRD4 0250-7005 Google Scholar
T. Zimmermannet al.,
“Spectral imaging and linear un-mixing enables improved FRET efficiency with a novel GFP2-YFP FRET pair,”
FEBS Lett., 531
(2), 245
–249
(2002). http://dx.doi.org/10.1016/S0014-5793(02)03508-1 FEBLAL 0014-5793 Google Scholar
C. BerneyG. Danuser,
“FRET or no FRET: a quantitative comparison,”
Biophys. J., 84
(6), 3992
–4010
(2003). http://dx.doi.org/10.1016/S0006-3495(03)75126-1 BIOJAU 0006-3495 Google Scholar
A. Iqbalet al.,
“Orientation dependence in fluorescent energy transfer between Cy3 and Cy5 terminally attached to double-stranded nucleic acids,”
Proc. Natl. Acad. Sci. U. S. A., 105
(32), 11176
–11181
(2008). http://dx.doi.org/10.1073/pnas.0801707105 PNASA6 0027-8424 Google Scholar
|


